
 ?Mathematical formulae have been encoded as MathML and are displayed in this HTML version using MathJax in order to improve their display. Uncheck the box to turn MathJax off. This feature requires Javascript. Click on a formula to zoom.
ABSTRACT
This paper applies the autoregressive distributed lag bounds testing method to investigate the long- and short-run relationship between the size of the shadow economy and income inequality in Uganda. The findings reveal evidence of the long and short-run relationship between the shadow economy and income inequality. We find that a rise in income inequality significantly increases the size of the shadow economy in Uganda, all else equal. These results are robust to the use of alternative econometric methods. At the policy level, instituting income redistribution policies to uplift the standard of the poor, improving resource allocation to productive sectors of the economy, reforming the tax system and macroeconomic environment, and implementing political and institutional reforms to address corruption could be viable policy options to address informality in Uganda.
JEL CLASSIFICATION:
1. Introduction
This paper investigates the long- and short-run relationship between income inequality and the shadow economyFootnote1 in Uganda. Using data that cover the period from 1991 to 2017, this paper applies the autoregressive distributed lag bounds (ARDL) testing approach to cointegration to examine whether changes in income inequality result into changes in the size of the shadow economy in Uganda. Income distribution is important in a country like Uganda because it determines the outcomes of development and influences the extent to which welfare programs affect poverty reduction (Hailemariam and Dzhumashev Citation2020). A large income gap between the poor and the rich may cause political unrest and undermines government effort to improve the welfare of the poor hence worsening their livelihood opportunities (Berg and Ostry Citation2011; Esaku Citation2021a). Given the above, a widening income gap between the rich and poor provides an incentive for the poor to practice informal production and distribution of goods and services. This is particularly true if income gap is large and steadily increasing.
For instance Berdiev and Saunoris (Citation2019) analyze the links between the informal economy and income inequality covering the period from 1960 to 2009 in a panel of 144 economies. Applying a vector autoregressive framework, the above authors find a positive relationship between income inequality and the size of the shadow economy. They find that an increase in income inequality also translates into a rise in the size of the shadow economy, all else equal. Similarly, Hatipoglu and Ozbek (Citation2011) develop a political economy framework to account for the relationship between income distribution and the size of the shadow economy. The above authors find evidence supporting the positive effect of income inequality on the size of the informal sector. These authors show that the political system that favors the rich over the poor worsens income inequality which also leads to wide spread informality. Correspondingly, Elveren and Ozgur (Citation2016) apply a combination of econometric methods to test the relationship between the size of the shadow economy and income inequality between 1963 and 2008 in Turkey. The above authors find evidence of a positive and statistically significant relationship between the informal economy and income inequality. These authors find that a rise in income inequality promotes the expansion of the shadow economy as a result of dwindling livelihood opportunities among the poor.
Taken together, the above discourse indicates that income distribution is important in influencing economic growth and the welfare of the citizens. This paper follows along the extant literature that examines the effect of income inequality on the size of the shadow economy. The specific research question we seek to answer is whether a rise in income inequality increases the size of the informal economy in Uganda. Uganda as a country is chosen for various reasons. First, there is evidence that income inequality has been rising despite government’s effort to introduce programs aimed at addressing it in Uganda (see Lwanga-Ntale Citation2015). Additionally, households presumed to have moved out of poverty over the past two decades have slumped back into poverty in recent years (see Ssewanyana and Kasirye Citation2012). This justifies the study of the effect of income inequality on the size of the shadow economy. Second, Uganda is one of the African countries that have implemented a number of reforms and poverty reduction programs over the past three decades but is still classified as a low income country. Therefore, one would ask whether income inequality is partially responsible for the sluggish growth and rising levels of informality in this country. This paper clarifies on the effect of widening income inequality on rising informality in Uganda. Thirdly, this country has experienced a turbulent political history since the 1970s when the then democratically elected government of Obote was overthrown by the military junta led by Idi Amin Dada which resulted into economic hardships and rising informality (Esaku Citation2021b). The important question now is whether the widening income inequality has created a thriving informal sector in the country given that a large size of the shadow economy is detrimental to the overall performance of the economy (Esaku Citation2021b). Fourth, the relationship between informality and income inequality has been investigated previously, in economies outside of Sub-Saharan Africa (to the best of the author’s knowledge). However, there is little evidence to suggest that this relationship has ever been examined in the context of Sub-Saharan Africa. Thus, this might be the first attempt to examine this relationship in Sub-Saharan African context. This study could provide helpful insights on how income inequality influences the size of the shadow economy in this context. Lastly, the bulk of the studies that investigated the relationship between income inequality and the size of the shadow economy have largely used a panel of countries and applied panel data and cross-sectional regression methods. One main limitation of such studies is that they rely on the assumption of homogeneity of coefficients, where they assume that countries are homogeneous, as such empirical results can be generalized across all economies (Keho Citation2017). However, this assumption may not hold given that countries are heterogeneous with respect to the business environment, level of economic development, technology and quality of institutions, among other factors (Esaku Citation2021c). In case the cross-sectional homogeneity assumption is violated, this leads to policy recommendations that do not reflect the local economic conditions of the countries involved (Esaku Citation2021f). This paper attempts to fill this gap by investigating the relationship between income inequality and the size of the informal sector in a country-level framework.
This study contributes to the literature in three important ways: first, we extend the study of the relationship of income inequality and the informal economy to a less studied context, Uganda. This will enrich our understanding of factors that cause wide spread informality in less developed contexts like Uganda. Second, this paper examines an important relationship with implications for policy. For instance, how can income redistribution programs be tailored to mitigate wide spread informality in both developing and developed economies? Thirdly, investigating the relationship between income inequality and the size of the shadow economy could unearth findings and policy implications which provide new insights on how to address informality in less developed contexts.
While this study follows in the footsteps of Berdiev and Saunoris (Citation2019), it differs with that study in three important ways. First, while the above authors focus on developed economies, this paper situates its investigation of the relationship between income inequality and the shadow economy in a different context, Sub-Saharan African country. Second, whereas the above authors use a panel of countries, this paper uses a single country framework to analyze the above relationship. Lastly, this paper employs a relatively new cointegration approach- the ARDL bounds testing method of Pesaran and Shin (Citation1999) and its extension by Pesaran, Shin, and Smith (Citation2001), to analyze this relationship. This method is considered more robust than the traditional cointegration methods (Menegaki Citation2019) because of its ability to provide unbiased estimates and valid t-statistics, regardless of the endogeneity of some of the regressors (Jalil and Ma Citation2008). Furthermore, the ARDL model allows for the correction of outliers and distinguishes between the outcome and explanatory variables (Marques, Fuinhas, and Marques Citation2017).
Apart from Section 1, Section 2 reviews related literature while Section 3 presents the data and descriptive statistics. Section 4 presents the methodology while Section 5 reports the findings and discussion. Finally, Section 6 concludes this paper.
2. Review of related literature
Recent global evidence indicates that much of the production and distribution of goods and services occurs in the two most important sectors of the economy: formal and informal sectors (Esaku Citation2021c). Available estimates from Medina and Schneider (Citation2019) suggest that the production and distribution of goods and services in the informal sector, as share of gross domestic product (GDP), has steadily increased across many regions of the world. Across the 157 countries (both developed and developing) that were surveyed, activities in the shadow economy are estimated to average 31% of GDP; with Bolivia having the largest size of the shadow economy in Latin America; that is, 62.9% of GDP, and Georgia leading in Europe with 61.8% of GDP. In Africa, Nigeria and Tanzania have the largest shares of shadow activities as a proportion of GDP. For instance, Nigeria’s informal sector activities are estimated to account for 56.8% of GDP, while Tanzania’s accounts for 56% of GDP (Medina and Schneider Citation2019). The theoretical model of Harris and Todaro (Citation1970) emphasized that the shadow economy is essentially a stagnant and unproductive economy which acts as a ‘refuge’ for the urban unemployed and a reception center for ‘new arrivals’ from rural areas that come to urban centers in search for better livelihood opportunities. In this case, the growth of the informal sector was viewed as the outcome of underdevelopment and expected to disappear once the economy experienced sustainable levels of economic growth (Geertz Citation1963; Loayza Citation2016). Contrary to the above widely held view, the empirical evidence indicates that the shadow economy is persistent and steadily increasing over the past three decades despite high levels of economic growth and development (Medina and Schneider Citation2019).
Consequently, the empirical literature continues to view the shadow economy as a dynamic and efficient sector which contributes significantly to the production and distribution of goods and services. Thus this sector provides opportunities for income generation which benefits the most vulnerable members of society (Esaku Citation2019a; ILO Citation2002). Additionally, this sector continues to attract and sustain a growing number of the labour force, estimated to range between 30% and 70% globally (Fourie Citation2018). Moreover, income generated in informal sector activities ends up in the formal economy, hence complementing the production and distribution of goods and services in the latter. Accordingly, there is recognition that the bulk of ‘migrants’ who come from rural to urban areas in search of better employment opportunities are attracted to engage in informal activities due to income earning opportunities in the shadow economy. Moreover, there is little job search for workers who engage in informal employment (Bhattacharya Citation2011; Mugoda et al. Citation2020). Despite earlier suggestions that the informal sector is transitory, there is acknowledgement that this sector is dynamic in nature and increasingly becoming persistent across many countries of the world. Thus there is recognition of the important role this sector plays in providing a source of livelihood for the poor and vulnerable members of society. Some of the reasons for the rise in the shadow economy seem to point to failure by the formal economy to absorb the unemployed population, which is semi or unskilled in many countries (Goel and Nelson Citation2016). Viewed from the ability of the sector to provide livelihood opportunities for millions of the unemployed, some analysts acknowledge that the shadow economy is not entirely bad. It provides employment to a number of people who cannot find employment in the formal sector of the economy (Esaku Citation2020b) and helps generate incomes for the poor, which incomes also end up in the formal economy, hence raising the demand for goods and services produced in the formal sector (ILO Citation2002).
Despite its importance, there is increasing concern on the impact of informal sector activities on the growth and development of a country (Esaku Citation2021b), given that a large informal sector erodes the tax base which is detrimental to the provision of public goods and services, such as security, infrastructure and hospitals among others (Esaku Citation2021c; Goel and Nelson Citation2016). There is also consensus that the rise of the shadow economy is a consequence of inefficiencies in public administration and failure of institutions mandated to enforce proper functioning of the market system to provide public goods and services (Gallin Citation2001). Government inefficiencies arise when there is corruption, bad governance or wasteful allocation of economic resources for the production and distribution of goods and services. In countries where the size of the informal economy is large, its expansion is correlated with high taxes, corruption, low level of development and overregulation (Buehn and Schneider Citation2012b). Therefore, continuing to offer public goods and services requires governments to levy high taxes or broaden the tax base to cover the cost of public administration and provision of public goods and services. If tax payers view increases in tax as additional burden, they will choose to operate underground in order to avoid taxation and excessive regulation leading to tax evasion (De Soto Citation1989; Loayza Citation2016). Tax evasion further worsens the provision of public goods and services because of reduced tax revenue.
Given that the shadow economy has expanded over the past three decades across most countries, the formal investigation of its size, determinants and consequences is relatively recent with the main focus being on public finance and tax administration (see Buehn and Schneider Citation2012b). In line with De Soto (Citation1989), the expansion of the shadow economy is considered to be the consequence of high taxes and regulatory discretion which impose ‘additional burden’ on start-up businesses causing these businesses to conceal their operations from the ‘radar’ of regulators. Indeed a number of papers have examined the role of taxes and overregulation in determining the size of the shadow economy (see Goel and Nelson Citation2016). Recently though, some papers have extended this analysis to the examination of the interrelationship between the shadow economy and a number of variables such as financial development, institutional quality, corruption, direct democracy, political instability, and the level of development, among others. For instance, Berdiev and Saunoris (Citation2016) use panel data techniques to analyze the relationship between the shadow economy and financial development in 161 economies. Their findings suggest that financial development significantly reduces the size of the shadow economy.
Dreher, Kotsogiannis, and McCorriston (Citation2009) develop a simple framework to capture the interrelationship between corruption, the shadow economy and institutional quality. Their model suggests that institutional quality reduces the size of the shadow economy and corruption. This provides evidence of the primary contribution of institutions in mitigating the spread of informal sector activities. Choi and Thum (Citation2005) present a model of the interrelationship between corruption and the shadow economy and show that corruption limits the expansion of the shadow economy. However, Johnson, Kaufmann, and Zoido-Lobaton (Citation1998) dispute the suggestions advanced by Choi and Thum (Citation2005). In their argument, Johnson, Kaufmann, and Zoido-Lobaton (Citation1998) show that corruption and the shadow economy do reinforce each other. This finding is supported by the empirical work of Buehn and Schneider (Citation2012a), who find evidence of a complementary relationship between corruption and the size of the shadow economy. Additionally, Esaku (Citation2021e) using time series data from Uganda investigates whether corruption increases the shadow economy. The above author finds evidence that a rise in the level of corruption significantly increases the size of the shadow economy.
Some papers have investigated how governance influences the size of the shadow economy. For instance, Teobaldelli and Schneider (Citation2013) study the impact of direct democracy on the shadow economy across 57 economies around the world and find evidence that direct democracy is important in reducing the size of the shadow economy. Correspondingly, Elgin and Erturk (Citation2016) using cross-country panel regressions investigate the effect of the shadow economy on economic growth and find evidence that a large size of the shadow economy is correlated with lower rates of economic growth. Additionally, Esaku (Citation2021b) investigate the long and short-run relationship between the shadow economy and economic growth and find evidence of a negative relationship between the above two variables, all else equal.
Although there is substantial work already done on the shadow economy, there still remain potential determinants of the shadow economy that are not adequately explored, such as the relationship between income inequality and the size of the shadow economy in Uganda’s context. There is strong evidence suggesting that the size of the shadow economy could be positively correlated with the level of income distribution in the economy. For instance Rosser Jr., Rosser, and Ehsan (Citation2000) investigate the relationship between income inequality and the size of the shadow economy in transition countries and find that income inequality is positively associated with the proportion of output produced in the shadow economy. Their evidence further suggests that any changes in income inequality are also followed by changes in the proportion of output produced in the shadow economy implying that income inequality might be one of the determinants of the shadow economy. Chong and Gradstein (Citation2007) present a simple theoretical model in which income inequality is positively correlated with the size of the shadow economy. Their empirical results show that an increase in income inequality increases the relative size of the shadow economy by between 3 and 9 percentage points, implying that income inequality is a significant determinant of the shadow economy.
In this paper we ask whether income inequality is a significant determinant of the size of the shadow economy in Uganda. Although, there is evidence suggesting that the two are correlated, the available evidence is largely based on panel data and cross-sectional regression approaches. Such studies rely on the assumption of homogeneity on coefficients, where they assume that countries are the same and findings can be generalized across all the countries (Keho Citation2017).
2. Data and descriptive statistics
In this section, we present the data and data sources. The data are annual time series drawn from different sources, and cover the period from 1991 to 2017. The data for the outcome variable, the size of the shadow economy is from Medina and Schneider (Citation2019). These authors use the multiple indicator-multiple cause (MIMIC) procedure to generate a global database of the size of the shadow economy for 157 economies around the world. For the main explanatory variables (gini and gim), the data source is The Standardized World Income Inequality Database (SWIID) developed by Solt (Citation2020) version 9.0. The Gini provides an estimate of the Gini index of inequality in equivalized household disposable income estimated using Luxembourg income data as the standard measure. Similarly, we also employ Gini index of inequality in equivalized household market income (gim), to check the robustness of our findings. The main difference between the two indices is that gini index of inequality is calculated using post-tax and post-transfer household income, while gim is estimated using pre-tax and pre-transfer household income. Furthermore we include a number of variables to control for fiscal, macroeconomic and regulatory conditions in line with the literature. We include the following variables: inflation (inf), economic growth (gw), government expenditure (gov/gdp) as a proportion of gross domestic product (GDP), trade openness (open), control of corruption (cor) and institutionalized democracy (Demo). We measure inflation using consumer price index; economic growth is measured by growth of GDP. All these variables are drawn from World Development Indicators (World Bank Citation2020). Control of corruption index is our preferred measure of institutional quality, and is from International Country Risk Guide (ICRG Citation2017) published by Political Risk Services (PRS). Our measure of institutionalized democracy is from the Centre for Systemic Peace (Polity5 version).
We report the descriptive statistics and correlation matrix of the main variables in . (a) reports the descriptive statistics while panel (b) presents the correlation matrix. In panel (a), the average values of the key variables are: shadow economy (Se17), 36.48; income inequality (gini), 43.854; gim, 46.308; inflation (inf), 8.146; openness (open), 37.232; growth (gw), 3.254; government expenditure (Gov/gdp), 11.607; control of corruption (cor), 2.160; and institutionalized democracy (Demo), 0.462. In Panel (b), we note that all of our variables of interest (gini and gim) show a positive correlation with the size of the shadow economy. This could imply that income inequality and the size of the shadow economy are positively correlated. However, a formal examination of this relationship is necessary to ascertain whether the two variables have a long-run relationship. In the sections that follow, we carry out a formal empirical analysis of the relationship between income inequality and the size of the shadow economy in Uganda.
Table 1. Summary statistics and correlation matrix.
3. Methodology
In this section, we present the model specification and estimation strategy for examining whether changes in income inequality result into changes in the size of the shadow economy in both the long- and short-run.
3.1 Model specification
In this section, we formally express the empirical model for testing the long- and short-run relationship between income inequality and the size of the shadow economy. Thus we posit that the shadow economy is influenced by variables that can be expressed as follows:
(1)
(1)
(2)
(2)
where se17 denotes the size of the shadow economy, gini is the index of income inequality in equivalized household disposable income, inf denotes inflation, gw is economic growth or simply, growth. Similarly, Gov/gdp denotes government expenditure, open is trade openness index (exports plus imports as share of GDP), cor is corruption control index, demo is institutionalized democracy and gim is index of inequality in equivalized household market income for robustness checks. We choose these explanatory variables based on the literature review and the standard practice in the extant literature. The literature shows that inflation and the level of economic growth should be included as control variables (see Chong and Gradstein Citation2007; Esaku Citation2021b). Additionally, we also include control of corruption as a measure of institutional quality (Dreher, Kotsogiannis, and McCorriston Citation2009; Esaku Citation2021e) and trade openness to control for the state of the economy (Buehn and Schneider Citation2012a; Esaku Citation2021f). We also include government expenditure to control for fiscal environment since empirical evidence shows that taxation and regulatory burden are positively correlated with the size of the shadow economy (see Goel and Nelson Citation2016). Similarly, we control for the state of democracy as another important determinant of the shadow economy (Teobaldelli and Schneider Citation2013). In what follows, we express the econometric methodology in the next section.
3.2 Econometric methodology
Before the estimation process, we first conducted stationarity tests and then ARDL bounds testing for long-run relationship between the main variables of our interest. Second, we follow the ARDL bounds testing approach to cointegration introduced by Pesaran, Shin, and Smith (Citation2001) to test for the relationship among variables. This testing approach is beneficial over the traditional cointegration techniques because it can correct for any possible endogeneity among the explanatory variables (Wolde-Rufael Citation2010). Furthermore, compared with traditional cointegration tests, the capability of the ARDL bound test is not limited in finite samples when invalid restrictions are imposed (Banerjee, Dolado, and Mestre Citation1998) and performs better even in smaller samples (Tang Citation2004).
Thus, we can express the ARDL model in Equation (1) as follows:
(3)
(3) where
denotes the constant term while
denote the short- and long-run coefficients, respectively, and
denotes the error term. For robustness checks, we test Equation (3) by substituting gini for gim to determine whether the findings are robust to alternative specification.
To implement ARDL bounds testing approach, we first tested for cointegration relationship among variables to ascertain the existence of a long-run relationship using the F-statistic. The null hypothesis of no cointegration, is tested against the alternative hypothesis that there is cointegration among variables
. The result of the F-statistic is compared with the critical values specified in Pesaran, Shin, and Smith (Citation2001). The decision rule is as follows: if the calculated values of F-statistic are above the upper critical bound values, the
(the null hypothesis) is rejected and vice versa. But, if the F-statistic values fall within the bounds, then it means that the test result is inconclusive. Before conducting ARDL bounds testing procedure, the optimal lag length for the ARDL model is first ascertained according to the appropriate lag length selection criteria based on the Schwartz Information Criterion (SIC).
Following the results of the cointegration test on Equation (3), we can express the error correction model (ECM), if there is a long-run relationship, as follows:
(4)
(4) where
denotes the coefficient of the ECT (error correction term) which captures the long-run adjustment to the equilibrium following deviations, while
is the residual error term. The importance of the ECT coefficient lies in its size and sign, which denotes the speed of adjustment and validity of the results. Thus the coefficient of the error correction term (
) should be negative, less than 1 and statistically significant as shown in Enders (Citation2004).
4. Results and discussion
In this section, we present the results of the empirical investigation of the relationship between the size of the shadow economy and income inequality. We also report the results of stationarity tests, ARDL bounds tests, and empirical analysis of the long- and short-run relationship among the variables in the subsequent sections.
4.1 Stationarity tests
This paper first tested the variables to determine whether they are integrated of order zero, I(0), and/or order one, I(1) using two different stationarity tests. We used Augmented–Dickey–Fuller test (ADF) and Phillip–Perron (PP) test, with intercept and with trend and intercept. The results of these tests are reported in . From , we confirm that variables are either stationary in levels or after first differencing, and vary according to the type of stationarity test employed. Following the unit root tests, we proceeded to conduct the ARDL bounds testing procedure. In (a), we formally express the equations to be tested, while panel (b) reports the results of the ARDL bounds test for cointegration. We note that the calculated F-statistic is higher than the asymptotic critical value bounds specified in Pesaran, Shin, and Smith (Citation2001). Hence we reject the null hypothesis of no cointegration and conclude that the variables are cointegrated. Additionally, our diagnostic test shows that the results are reliable and not driven by any bias. We then proceeded to estimate the long- and short-run coefficients for the model by first determining the optimal lag length according to the Schwartz information criterion (SIC), which selected ARDL (2,0,0,1,1,1,0,1) model for both Equations (1) and (2).
Table 2. Results of stationarity tests for all the variables.
Table 3. Results of the ARDL bounds test.
4.2 The long-run relationship between the size of the shadow economy and income inequality
This section reports the results of the long-run relationship between the size of the shadow economy and income inequality. We first report the ARDL results in , columns 2 and 4, and then use fully-modified ordinary least squares (FMOLS) technique to check for the robustness of the ARDL results. We report the results of FMOLS in columns 6 and 8. In , column 2, the empirical findings show evidence of a positive relationship between the size of the shadow economy and income inequality. Specifically, our results show that income inequality significantly influences the size of the shadow economy in Uganda, in the long-run, all else equal. We can observe that both the coefficient on gini and gim are positive and statistically significant at 1% level. This indicates that an increase in income inequality significantly increases the size of the shadow economy by 9.884 units (for gini) and 8.258 units (gim), all statistically significant at 1% level. These results bode well with the finding of Rosser Jr., Rosser, and Ehsan (Citation2000) who study the relationship between income inequality and the size of the shadow economy in transition economies and show that these variables are positively correlated. Chong and Gradstein (Citation2007) present a tractable model to study the relationship between the size of the shadow economy and income inequality, with institutions mediating this relationship. The above authors find a positive relationship between the above variables and emphasized that this relationship is stronger under weak institutions.
Table 4. Long run relationship between democracy and the size of the shadow economy.
These findings are not surprising given the nature of Uganda’s economy and income distribution which seems to mostly benefit the political elites and the fact that nearly 75% of the country’s population still practices subsistence farming (see Ssewanyana and Kasirye Citation2012). The country’s subsistence farming is largely rain fed, causing a large segment of the population to be trapped in poverty hence widening income gap between the poor and the rich (Lwanga-Ntale Citation2015; Ssewanyana and Kasirye Citation2012). Furthermore, a large subsistence sector has a limited taxable base which complicates government’s ability to raise revenue for the provision of public goods and services, such as security, healthcare, and infrastructure, among others (Ssewanyana and Kasirye Citation2012). Thus a weak tax base cannot support government’s effort to redistribute income and prevents the creation of social safety nets which undermines the realisation of better livelihood outcomes for the poor. As a result, the poor will find themselves in the sector of ‘refuge’, that is, the informal sector hence increasing the size of the shadow economy in the process.
The results of the long-run relationship have far reaching policy implications. First, the results imply that an increasing income gap between the poor and the rich might be fuelling the expansion of the shadow economy in the long-run. Second, any policy intended to address informal sector activities must first tackle underlying factors that fuel unequal income distribution between the poor and the rich. Since income inequality and the relative size of the shadow economy are positively correlated, addressing them requires a multi-pronged approach that simultaneously addresses the key drivers of informality and income distribution. These policies could include instituting income redistribution policies to uplift the standard of the poor, improving resource allocation to productive sectors so as to improve the rate of economic growth, reforming the tax system to remove burdensome taxes on start-up business, reforming the macroeconomic environment to address wide spread inflation and implementing political and institutional reforms to address corruption and improve governance.
In some other results of , we observe that improvement in economic growth and more openness of the economy translate into a reduction in the size of the shadow economy by 0.426 and 0.491 units, statistically significant at 1% levels, respectively. As shown by previous studies, a low level of economic development disfranchises most of the poor and drives them to operate in informal economy as the formal sector cannot absorb them (Esaku Citation2021b). Similarly, overregulation increases the size of the shadow economy while a more open economy reduces it (Goel and Nelson Citation2016; Esaku Citation2021f). This suggestion seems to agree with our findings. The coefficient on ‘open’ suggests that trade openness significantly reduces the size of the shadow economy. Institutional quality plays an important role in regulating the operations of businesses (Elgin and Oztunali Citation2014). If institutions are weak, there is a possibility of the expansion of informal economy activities. These results seem to suggest that weak institutions promote informal sector activities. Similarly, institutionalized democracy reduces the size of the shadow economy. The coefficient on ‘demo’ is negative and statistically significant at 1% level, implying that institutionalized democracy reduces the size of the shadow economy (see Teobaldelli and Schneider Citation2013).
As a robustness check, Menegaki (Citation2019) proposes using either dynamic ordinary least squares (DOLS) and/or fully modified ordinary least squares (FMOLS) to verify the robustness of the findings. This is because these two econometric techniques generate asymptotically efficient coefficients while addressing the issue of endogeneity and serial autocorrelation at the same time (Menegaki Citation2019). We report these results in , columns 6 and 8. We can observe that the results of FMOLS are qualitatively and quantitatively similar to the ARDL results. We can conclude that an increase in income inequality significantly increases the size of the shadow economy in the long-run, for the case of Uganda. Furthermore, we conduct residual diagnostics to ensure that these results are not biased. This paper conducted Breusch–Godfrey serial correlation LM, Heteroskedasticity; Breusch–Pagan-Godfrey (BPG) and Normality tests. The results of these tests show no evidence of any bias in the empirical estimation of the ARDL models. In sum, it can be concluded that a widening income inequality increases the size of the shadow economy in the long-run, all else equal.
4.3 The short-run relationship between income inequality and the shadow economy
We present the short-run results in . Column 2 reports results for Equation 1, while column 5 reports the results for Equation (2). We can observe that the coefficients on gini and gim are positive and statistically significant at 1% levels, respectively. These results indicate that an increase in income inequality increases the size of the shadow economy, in the short-run, by11.735 units (gini) and 8.475 units (gim), statistically significant at 1% levels, respectively. This suggests that, in the short-run, high income inequality increases the size of the shadow economy, all else equal. We therefore establish that income inequality and the size of the shadow economy are positively correlated in both the long- and short-run. This conclusion is consistent with previous studies (see Berdiev and Saunoris Citation2019; Esaku Citation2021a). At the policy level, short-run shocks that affect income inequality have adverse effects on the economy, by increasing informal sector activities hence the rise in the size of the shadow economy. These short-run shocks should be addressed by targeting both the underlying drivers of income inequality and the shadow economy. This can prove to be an effective policy option in addressing shadow economy activities in Uganda.
Table 5. Short-run relationship between democracy and the size of the shadow economy.
Additionally, this paper finds evidence of significant effect of other variables on the size of the shadow economy. In column 2, we can observe that an increase in inflation and corruption increase the size of the shadow economy by 0.222 and 9.833 units, statistically significant at 1% levels, respectively. This finding seems to be in line with previous studies that show the positive effect of inflation and corruption on the size of the shadow economy (see Buehn and Schneider Citation2012a). We also find that an improvement in economic growth significantly reduces the size of the shadow economy in the short-run. Specifically, an improvement in economic growth reduces informal sector activities by 0.534 units, statistically significant at 1% level. This is consistent with Esaku (Citation2021b) who finds that improvement in the rate of economic growth significantly reduces the size of the shadow economy. These results seem to suggest the same conclusion that improvement in economic growth reduces the size of the shadow economy.
Similarly, increased openness of the economy statistically reduces the size of the shadow economy by 0.548 units, statistically significant at 1% level. These results are consistent with previous studies that show the negative effect of trade openness on the size of the shadow economy (Esaku Citation2021f). Taken together, the results of the short-run relationship indicate that a widening income gap between the poor and the rich also translates into increased shadow activities.
Finally, examining how the economy adjusts to any deviations from long-run equilibrium, we observe that the lagged coefficient of the error correction term (ECT) is negative and statistically significant at 1% level. The ECM results suggest that the size of the shadow economy adjusts to any deviations from long-run equilibrium at a speed of adjustment that is shown by the coefficient of the lagged error correction term which is 84.8% and statistically significant at 1% level. In sum, these findings suggest that addressing underlying factors that drive income inequality in Uganda could also be an effective policy option for curbing the spread of shadow activities in the country, in the short-run. This seems to be a viable policy option given that the relationship between the size of the shadow economy and income inequality is a reinforcing one. The practical implication of these results is that policies aimed at addressing wide spread informality should also tackle the underlying factors that drive income inequality in Uganda. We also conducted residual diagnostics to determine whether these results are reliable. Both the results of Breusch–Godfrey serial correlation LM, Heteroskedasticity; Breusch–Pagan–Godfrey (BPG) and Normality tests show no evidence of any bias in the empirical estimation of the ARDL models, giving support to the findings.
4.4 Diagnostic tests
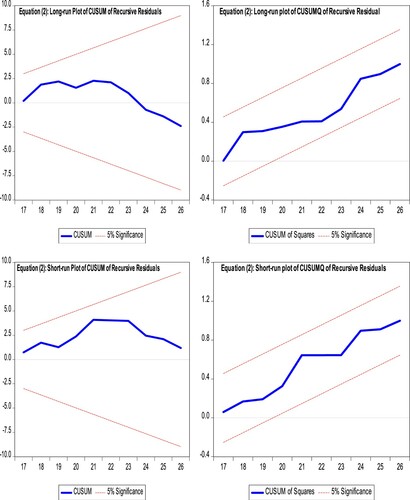
Following the estimation of the long- and short-run coefficients, we conducted stability diagnostics by analyzing recursive residuals. We report the plots of cumulative sum of recursive residuals (CUSUM) and cumulative sum of squared recursive residuals (CUSUMQ) for both long- and short-run coefficients in and . and present both the CUSUM and CUSUMQ plots and provide further evidence on the stability of the estimated ARDL models, for Equations (1) and (2). All these plots present evidence showing that the estimated ARDL models are stable. As shown in the two figures, the results of the residual plots do not cross the boundaries at 5% level of significance which confirms that there is stability in the parameters of the ARDL models.
Figure 1. Plots for CUSUM and CUSUMQ for long-run and short-run coefficients (Equation 1).
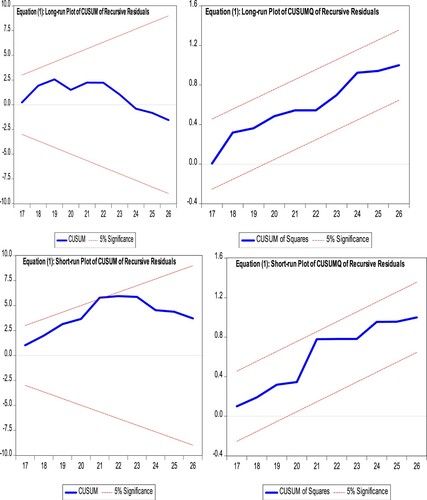
Figure 2. Plots for CUSUM and CUSUMQ for long-run and short-run coefficients (Equation 2).
5. Conclusion
In this paper, we examined the long- and short-run relationship between the size of the shadow economy and income inequality using data covering the period from 1991 to 2017. We examine this relationship by applying the ARDL bounds testing approach in a country-level setting. This paper finds that increase in income inequality significantly increases the size of the shadow economy in Uganda, in both the long- and short-runs, all else equal. These results seem to suggest that the rise of the shadow economy could partly be a consequence of widening income gap between the poor and the rich given the nature of Uganda’s economy, with small tax base due to a large subsistence sector. A large subsistence sector leads to a tax revenue shortfall which further stifles government’s ability to raise revenue for the provision of public goods and services. This undermines government’s effort to attain equitable income distribution in the economy and prevents the creation of social safety nets for the poor. Consequently, the poor will find themselves operating in the informal sector hence increasing the size of the shadow economy in the process.
At the policy level, these results imply that an increasing income gap between the poor and the rich might be fuelling the rise of the shadow economy in the long-run. Therefore, any policy intended to address informality must first tackle underlying factors that fuel unequal income distribution between the poor and the rich. Since income inequality and the relative size of the shadow economy are positively correlated, addressing them requires a multi-pronged approach that simultaneously addresses the key drivers of informality and income distribution. This might include instituting income redistribution policies to uplift the standard of the poor, improving resource allocation to productive sectors so as to improve the rate of economic growth, reforming the tax system to remove burdensome taxes on start-up businesses, reforming the macroeconomic environment to address wide spread inflation and implementing political and institutional reforms to address corruption and improve governance.
Furthermore, we acknowledge one main limitation of this study. The data used for the empirical exercise span only 25 years which might have affected our results. But the number of robustness checks conducted provides evidence of the reliability of these findings. Finally, effort to advance theoretical frameworks that explain the channels through which income inequality affects the shadow economy could be fruitful areas for further research.
Acknowledgement
The author is grateful to the editor of this journal and two anonymous reviewers of this article for their insightful comments that improved the quality of this paper. The remaining errors and omissions are solely the responsibly of the author.
Disclosure statement
No potential conflict of interest was reported by the author(s).
Notes
1 In this paper, we use the word shadow economy to also mean informal economy or underground economy or informal sector or unofficial economy. We use these terms interchangeably.
References
- Banerjee, Anindya, Juan Dolado, and Richardo Mestre. 1998. “Error-Correction Mechanism Tests for Cointegration in a Single Equation Framework.” Journal of Time Series Analysis 19 (3): 267–283. doihttps://doi.org/10.1111/1467-9892-00091.
- Bhattacharya, Prabir C. 2011. “Informal Sector, Income Inequality and Economic Development.” Economic Modelling 28 (3): 820–830. doihttps://doi.org/10.1016/j.econmod.2010.10.007.
- Berdiev, Aziz N., and James W. Saunoris. 2016. “Financial Development and the Shadow Economy: A Panel VAR Analysis.” Economic Modelling 57: 197–207. doi:https://doi.org/10.1016/j.econmod.2016.03.028.
- Berdiev, Aziz N., and James W. Saunoris. 2019. “On the Relationship Between Income Inequality and the Shadow Economy.” Eastern Economics Journal 45: 224–249. doihttps://doi.org/10.1057/s41302-018-0120-y.
- Berg, Andrew G., and Jonathan D. Ostry. 2011. “ Inequality and Unsustainable Growth: Two Sides of the Same Coin?” IMF Staff Discussion Note 11/08. Washington, DC: International Monetary Fund.
- Buehn, Andreas, and Friedrich Schneider. 2012a. “Corruption and the Shadow Economy: Like oil and Vinegar, Like Water and Fire?” International Tax and Public Finance 19 (1): 172–194. doihttps://doi.org/10.1007/s10797-011-9175-y.
- Buehn, Andreas, and Friedrich Schneider. 2012b. “Shadow Economies Around the World: Novel Insights, Accepted Knowledge, and New Estimates.” International Tax and Public Finance 19 (1): 139–171.
- Choi, Jay P., and Marcel Thum. 2005. “Corruption and the Shadow Economy.” International Economic Review 46 (3): 817–836.
- Chong, Alberto, and Mark Gradstein. 2007. “Inequality and Informality.” Journal of Public Economics 91: 159–179. doihttps://doi.org/10.1016/j.jpubeco.2006.08.001.
- De Soto, Hernando. 1989. The Other Path: The Economic Answer to Terrorism. New York: Harper and Row.
- Dreher, Axel, Christos Kotsogiannis, and Steve McCorriston. 2009. “How do Institutions Affect Corruption and the Shadow Economy?” International Tax and Public Finance 16 (6): 773–796. doi:https://doi.org/10.1007/s10797-008-9089-5.
- Elgin, Ceyhun, and Ferda Erturk. 2016. “Is Informality a Barrier to Convergence?” Economics Bulletin 36 (4): 2556–2568.
- Elgin, Ceyhun, and Oguz Oztunali. 2016. “Institutions, Informal Economy and Economic Development.” Emerging Markets Finance and Trade 50 (4): 145–162. doihttps://doi.org/10.2753/REE1540-496(500409.
- Elveren, Adem Y., and Gokcer Ozgur. 2016. “The Effect Informal Economy on Income Inequality: Evidence from Turkey.” PANOECONOMICUS 63 (1): 293–312. doihttps://doi.org/10.2298/PAN1603293E.
- Enders, Walter. 2004. “Applied Econometric Time Series (2nd ed.). Hoboken, NJ: John Wiley & Sons.
- Esaku, Stephen. 2019a. “Trade liberalization, firm dynamics and export participation in Sub-Saharan Africa.” Doctoral Thesis, North-West University South Africa.
- Esaku, Stephen. 2020b. “Job Creation, job Destruction and Reallocation in Sub-Saharan Africa: Firm-Level Evidence from Kenyan Manufacturing Sector.” Cogent Economics & Finance 8(1):1-22. doi:https://doi.org/10.1080/23322039.2020.1782113
- Esaku, Stephen. 2021a. “Does the Shadow Economy Increase Income Inequality in the Short- and Long-run? Empirical Evidence from Uganda.” Cogent Economics & Finance 9 (1): 1–21. doihttps://doi.org/10.1080/23322039.2021.1912896.
- Esaku, Stephen. 2021b. “Is Informality a Barrier to Economic Growth?” Development Studies Research 8 (1): 109–121. doihttps://doi.org/10.1080/21665095.2021.1919167.
- Esaku, Stephen. 2021c. “Political Instability and Informality in Uganda: An Empirical Analysis.” The European Journal of Applied Economics, 1–16.
- Esaku, Stephen. 2021e. “Does Corruption Contribute to the Rise of the Shadow Economy? Empirical Evidence from Uganda.” Cogent Economics and Finance 9 (1): 1–22. doihttps://doi.org/10.1080/23322039.2021.1932246
- Esaku, Stephen. 2021f. “The Long- and Short-run Relationship Between the Shadow Economy and Trade Openness in Uganda.” Cogent Economics and Finance 9 (1): 1–23. doihttps://doi.org/10.1080/23322039.2021.1930886
- Fourie, Frederick. 2018. “Enabling the Forgotten Sector: Informal Sector Realities, Policy Approaches and Formalization in South Africa.” In The South African Informal Sector: Creating Jobs, Reducing poverty, edited by C.v.N. Fourie Frederick, 439–476. Human Sciences Research Council.
- Gallin, Dan. 2001. “Propositions on Trade Unions and Informal Employment in Time of Globalization.” Antipode 19 (4): 531–549. doihttps://doi.org/10.1111/1467-8330.00197.
- Geertz, Clifford. 1963. Old Societies and new States: The Quest for Modernity in Asia and Africa. New York: Glencoe Free Press.
- Goel, Rajeev K., and Michael A. Nelson. 2016. “Shining a Light on the Shadows: Identifying Robust Determinants of the Shadow Economy.” Economic Modelling 58: 351–364. doi:https://doi.org/10.1016/j.econmod.2016.06.009.
- Hailemariam, Abebe, and Ratbek Dzhumashev. 2020. “Income Inequality and Economic Growth: Heterogeneity and Nonlinearity.” Studies in Nonlinear Dynamics & Econometrics 24 (3): 1–15. doihttps://doi.org/10.1515/snde-2018-0084.
- Harris, John.R, and Michael P. Todaro. 1970. “Migration, Unemployment and Development: A Two-Sector Analysis.” The American Economic Review 60 (1): 126–142. Retrieved from: https://www.aeaweb.org/aer/top20/60.1.126-142.pdf.
- Hatipoglu, Ozan, and Gulenay Ozbek. 2011. “On the Political Economy of the Informal Sector and Income Redistribution.” European Journal of Law and Economics 32: 69–87. doihttps://doi.org/10.1007/s10657-010-9179-6.
- International Country Risk Guide (ICRG) Researchers. 2017. ‘International Country Risk Guide (ICRG) Researchers Dataset’. https://doi.org/https://doi.org/10.7910/DVN/4YHTPU, Havard Dataverse, V1.
- International Labour Organization. 2002. Decent Work and the Informal Economy. Geneva: International Labour Office.
- Jalil, Abdul, and Ying Ma. 2008. “Financial Development and Economic Growth: Time Series Evidence from Pakistan and China.” Journal of Economic Cooperation among Islamic Countries 29: 29–68.
- Johnson, Simon, Daniel Kaufmann, and Pablo Zoido-Lobaton. 1998. “Regulatory Discretion and the Unofficial Economy.” American Economic Review 88 (2): 387–392.
- Keho, Yaya. 2017. “The Impact of Trade Openness on Economic Growth: The Case of Cote D’Ivoire.” Cogent Economics & Finance 5(1):1-14. 1332820. doi:https://doi.org/10.1080/23322039.2017.1332820
- Loayza, Norman V. 2016. “Informality in the Process of Development and Growth.” The World Economy 39 (12): 1856–1916. doihttps://doi.org/10.1111/twec.12480.
- Lwanga-Ntale, Charles. 2015. “Inequality in Uganda: Issues for Discussion and Further Research.” Development 57 (3-4): 601–617. doihttps://doi.org/10.1057/dev.2015.44.
- Marques, Luís Miguel, José Alberto Fuinhas, and António Cardoso Marques. 2017. “Augmented Energy-Growth Nexus: Economic, Political and Social Globalization Impacts.” Energy Procedia 136: 97–101.
- Medina, Leandro, and Friedrich Schneider. 2019. “Shedding Light on the Shadow Economy: A Global Database and the Interaction with the Official One.” CESifo Working Paper No. 7981.
- Menegaki, Angeliki N. 2019. “The ARDL Method in the Energy–Growth Nexus Field; Best Implementation Strategies.” Economies 7(4):1-16. doihttps://doi.org/10.3390/economies7040105
- Mugoda, Salmon, Stephen Esaku, Rose K. Nakimu, and Edward Bbaale. 2020. “The Portrait of Uganda’s Informal Sector: What Main Obstacles do the Sector Face?” Cogent Economics & Finance 8(1):1-29. doihttps://doi.org/10.1080/23322039.2020.1843255
- Pesaran, Hashem M., and Yongcheol Shin. 1999. “An Autoregressive Distributed Lag Modelling Approach to Cointegration Analysis.” In Econometrics and Economic Theory in the 20th Century: The Ragnar Frisch Centennial Symposium, edited by Steinar Strom, 371–413. Cambridge: Cambridge University Press.
- Pesaran, Hashem M., Yongcheol Shin, and Richard J. Smith. 2001. “Bounds Testing Approaches to the Analysis of Level Relationships.” Journal of Applied Econometrics 16: 289–326. doihttps://doi.org/10.1002/(ISSN)1099-1255.
- Rosser Jr., J. Barkley, Marina V. Rosser, and Ahmed Ehsan. 2000. “Income Inequality and the Informal Economy in Transition Economies.” Journal of Comparative Economics 28: 156–171. doihttps://doi.org/10.1006/jcec.2000.1645.
- Tang, Tuck C. 2004. “A Reassessment of Aggregate Import Demand Function in the Asean-5: A Cointegration Analysis.” The International Trade Journal 18 (3): 239–268. doihttps://doi.org/10.1080/08853900490478131.
- Teobaldelli, Désirée, and Friedrich Schneider. 2013. “The Influence of Direct Democracy on the Shadow Economy.” Public Choice 157: 543–567. doihttps://doi.org/10.1007/s11127-013-0098-2.
- Solt, Frederick. 2020. “Measuring Income Inequality Across Countries and Over Time: The Standardized World Income Inequality Database.” Social Science Quarterly 101 (3): 1183–1199. SWIID Version 9.0, October 2020.
- Ssewanyana, Sarah, and Ibrahim Kasirye. 2012. . “Poverty and Inequality Dynamics in Uganda: Insights from Uganda National Panel Surveys 2005/06 and 2009/10.” Research Series No. 94. Retrieved from: https://media. africaportal.org /documents /series94.pdf.
- Wolde-Rufael, Yemane. 2010. “Bounds Test Approach to Cointegration and Causality Between Nuclear Energy Consumption and Economic Growth in India.” Energy Policy 38 (1): 52–58.
- World Bank. 2020. World Development Indicators. Retrieved from www.worldbank.org.