
 ?Mathematical formulae have been encoded as MathML and are displayed in this HTML version using MathJax in order to improve their display. Uncheck the box to turn MathJax off. This feature requires Javascript. Click on a formula to zoom.
ABSTRACT
The COVID-19 outbreak in early 2020 had a significant impact on human health and the economy. To effectively manage this pandemic, we must balance economic losses and health benefits. We must use real-time data to accomplish this. The literature currently available for Ethiopia is based on simulations of pre-COVID macroeconomic data and economic indicators. Using a Poisson pseudo maximum likelihood estimator for a machine learning semi-mixed effect model (SMEM) of structural gravity, this study estimated the impact of COVID-19 cases and deaths, vaccinations, and non-pharmaceutical policies on Ethiopian trade. Cases, deaths, and the stringency index all have statistically significant negative effects on bilateral exports and imports. Vaccinations, on the other hand, have a statistically significant positive impact on both bilateral exports and imports. When compared to bilateral imports, Ethiopia's bilateral exports suffer greatly. Import substitution and increased vaccination coverage and rates are the policy implications.
1. Introduction
The pandemic of COVID-19 has multiple effects on the global economy. The pandemic's negative impact is directed through international trade. According to (VOX, CEPR Policy Portal, Citationn.d.), the shock affects the most globalized and industrialized nations, such as the United States, Europe, China, and India, among others, through their manufacturing sectors in three dimensions: one, direct supply shocks caused by response policies and public behavioral change; two, supply chain contagion caused by costly transactions to import manufacturing inputs from more affected nations to less affected nations; and three, demand shocks due to recessions and precautionary behavior of consumers and investors. On the demand side, the most immediate trade impact of the COVID-19 pandemic has been the sudden rise in global demand for COVID-19-induced medical items, which is greater than some countries' GDP levels, resulting in a simultaneous rise in import demand and price for these items. In the case of medical masks (World Bank Group Citation2020), export quotas imposed on these medical items by economies facing a shortage of those items resulted in price increases of up to 20.5 percent.
The most widely used methodologies for measuring the impact of the COVID-19 pandemic on the global economy and trade have been summarized by international trade-related organizations (Impact of the Coronavirus Pandemic on International Trade – International Economics, Citationn.d.). According to his findings, the most commonly used forecasting methods are computable general equilibrium models with varying shocks and lengths. In the worst-case scenario, it was predicted that the pandemic would have a greater impact on economies in 2020 than in 2009, though less globalized regions such as SSA, including Ethiopia, have been mildly affected. The author of the summarized studies identified two major flaws: the analyses did not take into account data from the rest of the world other than China, and the offsetting effects of policy responses taken by governments, despite the fact that (Early Citationn.d.) such responses can mitigate the impacts by 30–40%. This study takes into account policy responses, employs a statistical model (rather than a simulation), leverages directly measured (rather than calibrated) data, and data is available in near real-time (not pre-COVID-19 data as in the above simulations). To empirically identify the impact of COVID-19 on trade (Empirical Analysis into the Impact of COVID-19 on Global Trade Relations | IHS Markit, Citationn.d.), an econometric model in the gravity tradition has been developed to explain the intensity of bilateral trade relations between all monthly reporting states in the Global Trade Atlas Forecasting database. The analysis conducted shows that COVID-19 has a negative impact on global trade relations. According to him, the effect appears to last until the containment efforts and potentially global vaccination are effectively implemented from March 2020. Since December 2020, countries have begun vaccination and detecting new strains (concerned variants) of coronavirus, which will alter the impact of COVID-19 on trade. This is another watershed moment for this paper, which will investigate the impact of COVID-19 on Ethiopian trade patterns. Ethiopia's trade patterns represent the biggest tipping point.
Relying on the gap showed above in the problem statement, the aim/goal/purpose of the study is to measure the impact of COVID-19 pandemic and its policy responses on Ethiopian trade patterns.
The research question is, "What is the extent of the COVID-19 pandemic's impact and its policy responses on Ethiopian trade patterns?" The objective of this paper is to investigate the impact of the COVID-19 Cases, Deaths, Non-pharmaceutical, and pharmaceutical policies on Ethiopian bilateral trade flows.
Controling for policy responses, coronavirus variants and vaccination, if any, in estimating statistically the impact of the COVID-19 pandemic on bilateral trade flows, this study is expected to deliver up-to-date and comprehensive findings to Ethiopia, in particular, and to the developing countries as a whole. Given that Ethiopia like other developing countries, are more dependent in imports to satisfy the consumption and investment demand of the country and high shortage of foreign currency to minimize the high indebtedness, measuring the impact of the pandemic on both import and export is very crucial.
The study's methodological limitation is that it does not include other concepts of proximity or remoteness, such as various forms of international accessibility, in addition to distance in the gravity equation. Other deep-rooted factors of historical, cultural, or linguistic nature could also be considered, but this study does not account for them.
The second section examines the literature, the third section describes the research methodology, the fourth section contains the results and discussion, and the fifth section concludes.
2. Literature review
This section contains an analytical framework and a conceptual framework for the impact of the COVID-19 Pandemic on bilateral trade flows.
2.1. Estimation of the gravity model of trade
The gravity model of commerce has recently sparked considerable interest in the scientific community, both theoretically and empirically. The aforementioned theoretical discoveries on multilateral resistance terms, in particular, necessitated the creation of consistent estimating methodologies to accommodate such advancements. More complex and data-intensive (i.e. nonlinear and panel) estimating efforts were made possible by the considerably improved processing capacity available for econometric analysis.
Several studies, beginning with the well-known publication by Santos Silva and Tenreyro (Citation2006), have pushed the field forward, and a number of scholars are actively seeking further methodological breakthroughs in the subject, particularly with regard to the estimation of the gravity model of trade. Egger and Tarlea (Citation2015) present a multi-way clustering approach for estimating the standard errors of regression coefficients in preferential trade agreements. In an international economic general equilibrium perspective, Egger and Staub (Citation2016) examine the applicability of several estimation methodologies. For the gravity model, Baltagi and Egger (Citation2016) proposed a quantile regression structural estimate method.
Within the aforementioned econometric developments, a new niche is forming around the incorporation of spatial dependence and heterogeneity of network autocorrelation (i.e. the correlation of flow data based on their network's topological characteristics) in gravity models (Patuelli and Arbia Citation2016), with trade being one of the most common applications. While the importance of spatial autocorrelation in trade models was first emphasized by Anderson and van Wincoop (Citation2004), and much earlier in spatial interaction modeling (Curry Citation1972; Curry, Griffith, and Sheppard Citation1975; Sheppard, Griffith, and Curry Citation1976), this topic has only recently received major attention. Behrens, Ertur, and Koch (Citation2012), Fischer and Griffifith (Citation2008), and LeSage and Pace (Citation2008) give the required stepping stones for examining SAC aspects in flow data from many viewpoints (economic theory, spatial econometrics, and spatial statistics).
The extant literature can be loosely divided into three categories: Traditional (linear) spatial econometric approaches are used and adapted to the case of count data in linear spatial econometric models (LeSage and Pace Citation2008; Behrens, Ertur, and Koch Citation2012; Fischer and Griffifith Citation2008; Baltagi, Egger, and Pfaffermayr Citation2007; Koch and LeSage Citation2015). GLMs (Sellner, Fischer, and Koch Citation2013; Lambert, Brown, and Florax Citation2010): these models extend previous approaches by allowing estimation based on Poisson-type models, thus addressing the concerns expressed by Santos Silva and Tenreyro (Citation2006); and Semi-parametric (ESF) models (Fischer and Griffifith Citation2008; Scherngell and Lata Citation2013; Krisztin and Fischer Citation2015; Chun Citation2008; Patuelli et al. Citation2016): these models mix a parametric and a non-parametric approach, by employing ESF within Poisson-type models.
Patuelli et al., (2018) is about the newest class of models, ESF. ESF (Griffith Citation2003) is a spatial statistics technique based on spatial weights matrices decomposition. The studies that have employed this technique show how spatial filters can be used as "interceptors" of (i.e. proxies for) unobserved spatial variability at the intercept level (Patuelli et al. Citation2012). In the case of (Metulini et al., Citation2018), ESF can be used to approximate the fixed effects that would be calculated by sets of nation dummies in a cross-sectional model of bilateral trade. The paper by Patuelli et al. (2018) intends to expand on the usage of ESF in zero-inflated models by allowing for independent spatial filter sets. Mentioning the latest developments in how to estimate the gravity model of trade, this study employed a semi-parametric model.
2.2. Conceptual framework
This section delves into the theoretical underpinnings of how COVID-19 affects cross-national trade. COVID-19, for starters, harms international trade by raising trade prices between countries. COVID-19 cases and deaths, for example, lower the on-site presence of workers in the transportation and shipping industries, such as truck drivers and port workers. Lockdown regulations and port restrictions hinder aviation and maritime travel between countries. In the first week of April 2020, Heiland and Ulltveit-Moe (Citation2020) reported a 29 percent decline in container ship departures compared to 2019. Transportation delays and freight costs increase as a result of these interruptions in the transportation sector. In addition, the spread of infectious diseases has an impact on both the demand and supply sides of the economy. Hereafter, we summarize the possible effects of the COVID-19 damages in exporting and importing countries separately.
We'll start with COVID-19's influence on exporting countries. COVID-19's proliferation resulted in social isolation and lockdown measures. People's mobility in the workplace is harmed as a result of these policies. Some workers are forced to miss work due to school closures in order to care for their children. Death and long-term illness have a direct impact on the workforce. These adjustments decrease the supply of commodities and make them less price elastic, causing the country's supply curve to shift higher and steepen. Damage to COVID-19 and related shutdown orders have also disrupted transportation sectors in exporting countries, affecting the cost of exports by increasing port and terminal handling fees.
In conclusion, it is logical that COVID-19 damage reduces the scale of manufacturing in an exporting country, hence limiting the country's export supply. In terms of the severity of supply shocks, there will be industrial heterogeneity. For example, supply shocks in businesses that provide vital products, such as food and medical products, will be lower than in industries that provide non-essential products, such as automobiles and machines. This is due to the fact that countries are attempting to maintain the supply of critical goods, and lockdown orders like as factory closures are rarely used against the manufacturers of these goods.
However, thanks to the emergence of remote work and operation, the negative impact may diminish over time. Telecommunications and information technology (IT) advancements will make remote work and operations easier, as well as lessen supply shocks in the manufacturing industry. Many countries have attempted to keep their economies afloat by implementing telecommuting programs. These systems aid in reducing the negative effects of COVID-19 on trade. In addition, such systems may boost production or efficiency. Exports grow in this instance. Remote work and operations will also replace on-site production activities, resulting in industrial heterogeneity. Despite the advancement of technology, exports are anticipated to continue to decline in these areas where remote work and operation are less possible. In labor-intensive industries like textiles, footwear, and leather products, for example, such procedures are difficult to carry out. Even in capital-intensive industries like machinery and transportation equipment, if remote work/operation is less practical and in-person presence is more necessary in the manufacturing process, the production scale is substantially reduced. Only 22% of manufacturing work may be completed at home, according to Dingel and Neiman (Citation2020).
The trade effect of COVID-19 harm to an importing country will be mostly due to a fall in aggregate demand in that country, which will be accompanied by an increase in port and terminal handling expenses. A citywide or worldwide lockdown reduces people's incomes from employment, which causes a drop in aggregate demand unless the government offers enough subsidies to compensate for the lost earnings. Even if people's earnings remain stable, their fear of illness reduces their visits to stores and supermarkets, resulting in lower demand.
In terms of supply shocks, the magnitude of negative demand shocks will vary per industry. Negative demand shocks may affect expenditure on durable goods more than non-durable goods, according to Eaton et al. (Citation2016), who researched the trade consequences of the global recession from 2008 to 2009. The rationale for this is that the previous products might be "postponed" (Baldwin and Tomiura Citation2020). As a result, the negative demand shock in industries that produce durable items may be greater. Plastics and rubber, leather products, wood products, textiles, footwear, plastic and glass products, precious and base metals, machinery, and transportation equipment are examples of these industries.
Uncertainty about the future, or "panic buying," on the other hand, may stimulate demand for vital goods like vegetables and food. Furthermore, because to the increased need to avoid infection by COVID-19, import demand for cleanliness products such as face masks and hand sanitizers may grow. As a result, adverse demand shocks for vegetables, food, and chemical items will be reduced, or even positive. Because textile face masks or protective clothing for surgical or medical use are classified as textile items, negative shocks may be lower in that business, despite the textile products' durability.
Supply shocks have a cascading impact, leading in COVID-19 demand shocks in importing countries via their supply chains. If COVID-19 has a negative impact on downstream product manufacturing, it will also have a negative impact on the import demand for upstream products utilized in downstream products. We expect to see this supply-chain effect in businesses with well-developed worldwide production networks, such as machinery and transportation equipment. These supply-induced declines in demand are included in the demand shocks examined in this research.
Online purchasing is important for reducing the negative effects on demand caused by reduced mobility for visiting retail stores. COVID-19 will have a smaller detrimental impact on trade for items purchased through the e-commerce (EC) market. Furthermore, even if COVID-19 infections/deaths decline or cease, and lockdown measures are lifted, the rapid shift from offline to online buying is projected to continue, at least in part. Consumers must make upfront investments to migrate to online purchase, as Watanabe and Omori (Citation2020) indicate. The cost of purchasing personal computers or cellphones, the cost of connecting to the Internet, the cost of purchasing software, and the cost of learning how to use EC platforms are all included in these investments. People are hesitant to return to the status quo after making these investments, thus this new purchasing pattern will endure. To put it another way, the negative impacts are likely to remain in the importation of commodities that are difficult to obtain online. In addition, the increasing growth of online shopping and teleworking boosts import demand for IT-related apparatus such as PCs, smartphones, microphones, and cameras.
3. Materials and methods
3.1. Description of trade in Ethiopia pre- and post-COVID-19
Due to a lack of exportable goods and logistical difficulties, Ethiopia consistently runs trade deficits. Gold, coffee, live animals, and oilseeds are the most important exports. Ethiopia is a net importer of fuel, food, and textile clothing. China (18% of imports and 8% of exports) and Saudi Arabia (13 percent of imports and 7 percent of exports) are the two most important trading partners. According to tradingeconomics, Ethiopia's trade deficit in pre-covid time 2018/19 is 3209.50 USD million, with a high reliance on imported inputs, capital goods, fuel, and food (wheat). Ethiopia had a post-covid trade deficit of 2599.4 million USD in 2020 and 2735.10 million USD in the second quarter of 2021, respectively.
3.2. Data: type, sources, and collection methods
To estimate the impact of the pandemic on trade, we use data from the IMF's trade statistics (IMF, Citation2022) on the intensity of bilateral trade relations between Ethiopia and her trade partners. GDP figures were derived from international financial statistics published by the International Monetary Fund. Furthermore, we use the standard trade gravity variable from the CEPII gravity database (CEPII Citation2021), supplemented with data on daily reported new COVID-19 cases and COVID-19 related deaths aggregated to quarters. The information on COVID-19 and its vaccination was derived from Our WorldinData's Coronavirus Source Data. Furthermore, because the impact on trade is critically dependent on the stringency with which individual governments respond to the escalating pandemic, we consider quarterly averages of the Oxford COVID-19 Government Response Tracker (OxCGRT). The OxCGRT (Hale et al. Citation2021) collects information on 18 different indicators on different common policy responses that governments have taken to respond to the pandemic, such as school closures and travel restrictions. The index value ranges from 0 (no measurements) to 100. (complete lockdown). The standard variables used in the gravity equations approach are the log of real GDP of the exporter, the log of real GDP of the importer, and the log of distance in kilometers between the capital cities of both trade partners. Other traditional variables from the CEPII gravity dataset (Hale et al. Citation2010) will be supplemented with the standard variables, such as the contingency of trade partners or common borders, common official language, a binary variable depicting a former colony status for a given country pair (colony), and the presence of an RTA or regional trade agreement notified to the WTO between a given pair of countries.
To empirically identify the impact of COVID-19 on bilateral trade flows, we chose Ethiopia and 133 of her trade partners from the IMF's quarterly reporting states in the trade statistics database. From among these 133, we selected 90 countries for a bilateral export sample and 80 countries for a bilateral import sample (all countries with at least one trade with Ethiopia during the sample period), each with a balanced panel data to avoid estimation problems caused by missing data in the dependent variable. The time period studied includes quarterly observations from January 2018 to the estimation time. We intentionally take the entire 2018 and 2019 years into account in order to account for the pre-COVID-19 period and detect the pandemic's impact.
3.3. Semi mixed-effects panel model
The standard gravity model assumes that bilateral trade , say import from country j to country i at time t, is determined by the GDPs Yit and Yjt of countries i and j, as well as trade cost factors that may be represented by country-pair-specific information. Instead of including GDP and population separately, GDP per capita is commonly used. Time FEs are commonly included in panel specifications to account for business cycles. We divide the independent variables into the following groups for notational convenience: the GDPs Yit and Yjt; the binary information Dijt; the non-binary but time-invariant information Zij; and the remaining set Xijt. All three types of vectors, Dijt, Zij, and Xijt, contain variables that may vary only over i, j, or both (i, j), i.e. are country-specific (such as the number of patents or landlocked) or specific to the relationship between these countries (like a common border). In the former case, we could divide Zij, for example, into (Zi, Zj). For i j = 1, … , ni, t = 1, … nt, the following gravity model is frequently used:
(1)
(1)
(2)
(2) If the conditional expectation of ln ϵijt is a function of the independent variables and/or ηij, then the OLS estimator of the logarithmic transformation of (1), i.e. (3),
(3)
(3) is inconsistent (regardless of whether ij refers to RE or FE), as was the motivation for (Paper, Citation2013) PPML estimator. For the reasons stated previously, namely that FE models only capture within effects, do not allow for direct estimation of the impact of time-varying variables, and (potentially, depending on the model and estimation method) suffer from incidental parameter problems, we focus on the problem of estimating the gravity model using a semi-mixed effects PPML, including versions with directional and time-varying effects.
José Lombardía and Sperlich (Citation2012) propose a nonparametric filter to remove any potential dependence between random heterogeneity and covariates. They apply the fact that for a set of (time-invariant) variables Wij, there may exist a function ψs() of smoothness s function s() such that for.
(4)
(4) Uij is a RE that is not related to Yit, Yjt, Xijt, Zij, Dijt, or Wij. Why should this be provided by a nonparametric function? A nonparametric function for Wij with arbitrary smoothness s (containing at least one continuous variable) can be anything between interpolation (say s = 0) and a constant (say s = ∞). This implies that (4) provides us with a range of models between the two extremes, namely the FE and RE models. The parameter s is a slider that positions our model between (if 0 < s < ∞) or on one of them (if s = 0 or s = ∞). A poor choice of variables in Wij will almost certainly result in a wiggly function resembling the FE model. (4), for example, becomes, in any case,
(5)
(5) uij is assumed to be independent of ϵijt. When directional effects ηi + ξj are taken into account, decomposition (4) becomes ηi = ψ1s1(Wi) + ui, ξj = ψ2s2(Wj) + vj with ψ1, ψ2 being two different nonparametric functions of smoothness s1, s2, and u, v the remaining REs; similarly, for the time-varying version, ηit = ψ1s1(Wit) + uit, ξjt = ψ2s2(Wjt) + vjt.
In our case, data on newly reported COVID-19 cases and COVID-19-related deaths are grouped into quarters. These variables have been transformed and zero-adjusted to account for zero observations. Furthermore, because the impact on trade is critically dependent on the stringency with which individual governments respond to the escalating pandemic, we consider quarterly averages of the Oxford COVID-19 Government Response Tracker (OxCGRT). The model is estimated using a semi-mixed-effects panel model (José Lombardía and Sperlich Citation2012; Proença, Sperlich, and Savaşcı Citation2015), which is estimated using the PPML, or pseudo-Poisson maximum likelihood method, as suggested by (Silva and Tenreyro Citation2011). Aside from the explained variable, all floating variables to be used in the model are entered into the model in logs. Dummies are used to introduce all binary variables.
The number of new COVID-19 cases in each economy reflects the severity of the pandemic. The data on COVID-19-related deaths provided to us considers the pandemic's burden on a given reporter's health system, and thus considers the efficiency of a given health system, and could be considered an even better approximation of the pandemic. Naturally, the number of cases and deaths in a given economy is proportional to the size of the population.
The standard variables used in the gravity equations approach are the log of real GDP of the exporter, the log of real GDP of the importer, and the log of distance in kilometers between the capital cities of both trade partners. Other traditional variables from the CEPII gravity dataset (Head, Mayer, and Ries Citation2010) have been added to the standard variables, such as the contingency of trade partners or common borders, common official language, a binary variable depicting a former colony status for a given country pair, and the presence of an RTA or regional trade agreement notified to the WTO between a given pair of countries. Furthermore, vaccination policy is introduced as an explanatory variable in this study.
To account for a common business cycle, we introduce time-fixed effects, as suggested by (Silva and Tenreyro Citation2011).
We use the gravity approach in our empirical analysis of the impact of COVID-19 on trade. We first estimate the model for Ethiopia and her trade partners' samples, using separate specifications for our two proxies, new COVID-19 cases and deaths. Second, we account for the impact of the government's strict response (non-pharmaceutical policy) to COVID-19 and vaccination (pharmaceutical policy).
3.4. Variable definition and hypothesis
The intensity of bilateral trade: Tijt, or bilateral trade between countries i and j in period t, is exports or imports from country i to country j in period t (Autoridad Nacional del Servicio Civil Citation2021). In our case, one sample is a bilateral export of Ethiopia to 90 countries (having a balanced panel data with Ethiopia) for 13 quarters (2018 quarter-one–2021 quarter-one), and another sample is a bilateral import of Ethiopia from 80 countries for 12 quarters (2018 quarter-one–2020 quarter-four). These samples come from 133 different countries (all of which had at least one trade with Ethiopia in the sample period).
New COVID-19 cases: represents the pandemic's severity in each economy.
COVID-19 related deaths: It considers the pandemic's impact on a given reporter's health system, and thus considers the efficiency of a given health system, and could be considered an even better approximation of the pandemic. Naturally, the number of cases and deaths is proportional to the size of the population in a given economy.
Policy responses: Includes 17 indicators of government responses ranging from containment and closure policies (such as school closures and movement restrictions) to economic policies and health-care policies (such as testing regimes). (Mendolia, Stavrunova, and Yerokhin Citation2021) contend that self-imposed mobility restrictions imposed in response to the pandemic account for up to 14 percentage points of the total observed reduction in mobility across the countries in their sample. At the same time, they discover that government-mandated measures account for a much larger portion of the reduction in Community mobility (a proxy for economic activity including trade) (up to 50 percentage points).
Economic size: Economic size is an important determinant of bilateral trade, according to empirical gravity models. We follow much of the empirical literature including the log of the product of the GDP levels of the two countries as a size variable in the group of gravity variables. In the empirical trade determinants literature, population inclusion is also common. In many cases, it is incorporated indirectly via the natural logarithm of the product of a country's GDP per capita levels. However, as an additional measure of economic size, we include population directly.
Distance: the distance in kilometers between the capital cities of both trade partners. The greater the distance between two countries, the higher the costs of transporting goods, reducing the gains from trade and reducing trade itself. (Glick and Rose Citation2002) calculate the effect of the log of the distance on trade between two countries.
Vaccination: A vaccination policy is a type of health policy implemented by governments to prevent the spread of infectious diseases through vaccination.
Common border: a variable that indicates whether the trading partners are contiguous—that is, whether they are adjacent to each other.
Common official language: a variable that indicates whether the trading partners speak the same language.
Colony: (Glick and Rose Citation2002) look into the significance of colonial ties in international trade. They offer two measurements of this variable. The first is an indicator variable that is 1 if the country pair includes a colonizer and one of its current or former colonies, and zero otherwise. The second measure is an indicator variable as well, and it is set to 1 for country pairs that had the same colonizer.
Regional trade agreement: There has been a surge of academic and policy interest in the subject in recent years. Many academic papers contain a shaky consensus on the impact of RTAs. There is empirical evidence that RTAs have a significant positive impact on trade (Baier and Bergstrand Citation2007).
Landlocked: A landlocked country is one that does not have land connected to an ocean or whose coastlines are in endorheic basins, which has a significant negative impact on trade.
Patent: It is a proxy for the country's technological size and has a positive relationship with trade.
Area: It is a proxy for the physical size of the country and has a positive relationship with trade .
Table 1. Variable’s measurement and hypothesis.
4. Results and discussion
To assess the impact of a COVID-19 pandemic on bilateral trade flows, we used an econometric model of the gravity equation to model both Ethiopia's bilateral exports and imports reported to the IMF's direction of trade statistics database.
Furthermore, we use the standard trade gravity variable from the CEPII gravity database, supplemented with data on daily reported new cases of COVID-19 and COVID-19 related deaths aggregated to quarters. COVID-19 data was derived from the Coronavirus Source Data provided by Ourworldindata.
Furthermore, because the severity of individual governments' responses to the escalating pandemic has a significant impact on trade, we consider quarterly averages of the Oxford COVID-19 Government Response Tracker (OxCGRT) for both exporters and importers. The OxCGRT (Hale et al. Citation2021) collects data on 18 different indicators, such as school closures and travel restrictions, to assess how governments have responded to the pandemic. The index value ranges from 0 (no measures) to 100 (complete lockdown). In April-May 2020, the global average of response stringency reaches a peak. Finally, because the impact on trade is so heavily dependent on vaccinations administered by states in response to the pandemic, we use quarterly aggregates of vaccinations from the ourworldindata website for both bilateral export and import. shows the descriptive statistics for the model's variables.
Table 2. Descriptive statistics.
The model is estimated using a semi-mixed-effects panel model (José Lombardía and Sperlich Citation2012); (Proença, Sperlich, and Savaşcı Citation2015), using the PPML, or pseudo-Poisson maximum likelihood method, as suggested by (Silva and Tenreyro Citation2011). Except for the explained variable, all floating variables in the model are entered in logs. Dummies are used to introduce all binary variables.
The number of new COVID-19 cases in each economy represents the pandemic's severity. The data on COVID-19-related deaths provided to us takes into account the pandemic's burden on a given reporter's health system, thus taking into account the efficiency of a given health system and could be considered an even better approximation of the pandemic. The number of cases and deaths in a given economy is, of course, proportional to the size of the population.
The standard variables used in the gravity equations approach are the log of the exporter's nominal GDP, the log of the importer's nominal GDP, and the log of the distance in kilometers between the capital cities of both trade partners. The traditional variables have been supplemented with other traditional variables from the CEPII gravity dataset (Head, Mayer, and Ries Citation2010), such as the contingency of trade partners or common borders, common official language, a binary variable depicting a former colony status for a given country pair, and the presence of an RTA or regional trade agreement notified to the WTO between a given pair of countries (rta).
We introduced time-fixed effects to account for a common business cycle, as suggested by (Silva and Tenreyro Citation2011).
The obtained results demonstrate the gravity approach's viability in explaining bilateral trade intensity. The coefficient of determination is high, frequently exceeding 0.7 and 0.8 for bilateral export and import. The factors in the model account for more than 70% and 80% of the variation in the explained variables, namely the value of exports and imports, respectively.
The coefficients on key variables are consistent with economic theory and demonstrate the gravity approach's robustness. The coefficients on exporter and importer GDP are both positive and statistically significant. Distance has a negative and statistically significant impact only on export, which is consistent with theory. The impact of contingency positive, as expected, however only for export. Because Ethiopia's main imports are industrial products from far-developed countries such as the United States, China, Japan, India, and so on (TRADING ECONOMICS, Citationn.d.), geographic factors (distance and contiguity) are expected to have no effect. The other geographic variable, landlocked, has a significant negative impact on Ethiopian exports but not imports, as Ethiopia's trade share with 49 landlocked countries is very low, as evidenced by our data. The impact of language commonality is zero in all specifications of the model (though there are some countries that speak Ethiopia's official language, Amharic, and some official languages of other countries used in Ethiopia, the prevalence of both is very low). These can be interpreted as a zero effect of language on Ethiopia's trade flow. The former colony status is not statistically discernible in the Ethiopian case because Ethiopia has never been colonized by any nation (Conte, Cotterlaz, and Mayer Citation2021); finally, the impact of RTA is significant and positive only for Ethiopia's import sample, as most trade agreements have been signed for imported items (WTO Citation2020).
The following empirical strategy is used in the following empirical analysis of the impact of COVID-19 on trade. We first estimate the model for a global sample of Ethiopian exports and imports, using separate specifications for our two proxies, new COVID-19 cases and deaths. Second, we account for the impact of the government's stringent response to COVID-19 on Ethiopia's trade flows. Finally, we show how vaccination policies affect trade flows from countries to Ethiopia.
First, we estimate the model for the Ethiopian trade flow sample using the above strategy, while simultaneously introducing the COVID-19 specific variables for both export and import. The first specification accounts for new COVID-19 cases, while the second introduces COVID-19-related deaths. As can be seen (see below), the COVID-19 pandemic has had a statistically significant and negative impact on bilateral exports. Both new COVID-19 cases and deaths appear to have a negative impact on bilateral exports; however, the magnitude of the effect appears to be greater for new COVID-19 cases, which accounts, at least partially in our understanding, for the efficiency of a particular national health system to the COVID-19 pandemic (IHS Markit, n.d.).
Table 3. Estimates of coefficients, random effects standard deviations, AIC, and BIC.
The magnitude of the reaction to COVID-19 new cases and COVID-19 related deaths is weaker in import than in export (as evidenced by our data, this reflects Ethiopia's less stringent nature in comparison to her trade partners). We can interpret the coefficients as elasticities thanks to the method we used. Thus, a 100% increase in quarterly COVID-19 cases for both export and import reduces trade between them by 17% and 7%, respectively, ceteris paribus.
The impact of COVID-19 is depicted in the following set of models (please see ) by introducing the average Oxford COVID-19 Government Response Tracker (OxCGRT) for the exporter and importer. The government response stringency index has a negative and statistically significant impact on the value of Ethiopian exports and imports in the Ethiopian trade flow sample, despite the fact that the impact on Ethiopia's exports is more than double that of its imports (100 percent for export and 34 percent for import). As a result, a more stringent response on the part of the importer appears to create significant trade barriers. It could also be attributed to a drop in import demand (VOX, CEPR Policy Portal, Citationn.d.). On the supply side, the export (Ethiopia's import) is less significant. Individual governments, more than Ethiopia's government, try to limit the harm caused by policy responses to their export potential. This is demonstrated by the low stringency recorded for Ethiopia in our data.
An introduction of an interation term that is a product of cases, deaths, policy stringency, and vaccination because we can not identify the direct impacts of any of COVID-19 induced variables, results in a change of magnitude to cases, deaths and stringency policy for both the export and import sample when comparing to a model without such an interaction term. For vaccination model, an introduction of an interaction term results in a change in magnitude, significance and sign when compared to a model without an interaction term. This is due to a collinerity between an interaction term and vaccination variable. Vaccination by itself cannot increase trade, however, because an information about cases and deaths, and containment and social distancing measures can decrease trade, vaccination can increase the already decreaded trade due to the pandemic and its response policies. This is obvious by the change of the vaccination impact from positive significant(with interaction term model) to positive insignificance(without interaction term model) in the export sample and by the change of the vaccination impact from positive significant to negative significant(−44%) in import sample.
To summarize, cases, deaths, and response policies all have a negative impact, whereas vaccination policies have the opposite effect by itself without the inclusion of the interaction term composed of COVID-19 induced variables. The majority of the time dummies for the base category, the COVID-19 peak time, April-June 2020, are significant and negative, particularly for export samples. The vaccination model's base category is January–March 2021 for export and October–December 2020 for import, as import data is more delayed than export data.
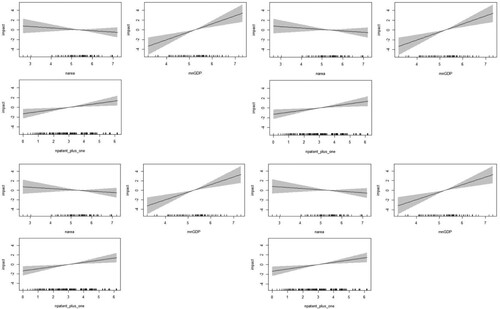
The above interpretation is based on various criteria such as the Akakie information criterion (), the Bayesian information criterion (), and economic theory. Model 3 (controlling for GDP non-linearity and its collinearity(correlation) with population and others) is chosen for the export side, and model 2 (non-parametric estimation) (see below) of size variables (area for physical size and patent for technological size) with mundalk device (means of time-varying variables) is chosen for the import side. The inclusion of size variables, area, and patent is based on Anderson and Wincoop's recommendations (2003) that is the size variables are more correlated with multilateral resistance terms which is vital to estimate structural gravity model. The nonlinearity of GDP with trade is readily apparent in the figures below (e.g. Figure A1 of the annex). The Mundalk device is widely used to regulate the endogeneity of time-varying variables. Both the selected models are semi-parametric machine learning models.
Figure 1. nonparametric estimates of GDP, population, and new cases/deaths/stringency/vaccine for model 1 of export.
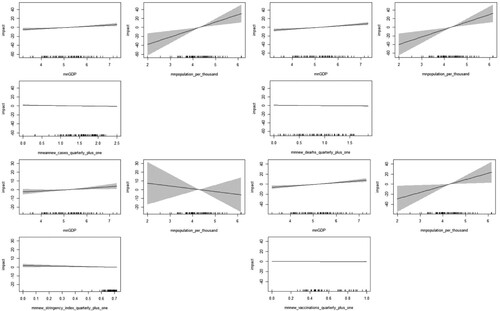
Figure 2. nonparametric estimates of area and patent for model 2 of export by new cases/deaths/stringency/vaccine.
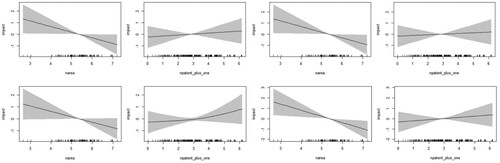
Figure 3. nonparametric estimates of area, GDP, and patent for model 3 of export by new cases/deaths/stringency/vaccine.
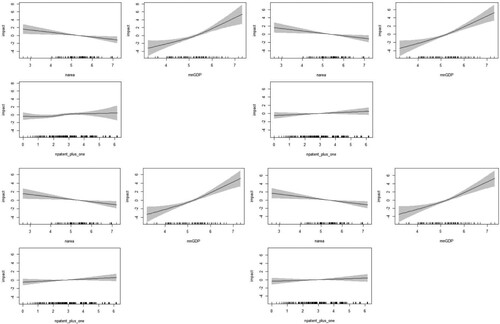
Figure 4. nonparametric estimates of GDP, population, and new cases/deaths/stringency/vaccine for model 1 of import.
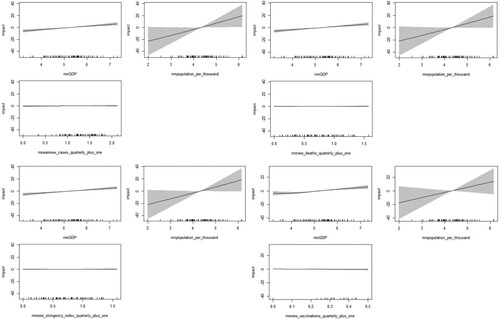
Figure 5. nonparametric estimates of area and patent for model 2 of import by new cases/deaths/stringency/vaccine.
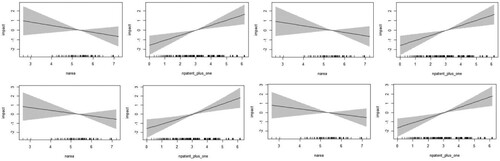
Figure 6. nonparametric estimates of area, GDP, and patent for model 3 of import by new cases/deaths/stringency/vaccine.
The gravity model used is a structural one that is consistent with theory. The six UN and WTO recommendations (Yotov et al., Citation2016) are as follows: first, panel data should be used to estimate structural gravity whenever possible (we use panel data from 90 countries with 13 quarters). Second, panel data with intervals should be used instead of data pooled over consecutive years to allow for trade flow adjustments (as COVID-19 policies are forceful and have a very short-run immediate impact, a quarter is enough to show their adverse adjustments to trade flows). Third, gravity estimates should be performed using data from intra-national and international trade flows (because the data is unilateral, containing only Ethiopia's exports and imports for thirteen quarters, a single data point has no effect). Fourth, directional time-varying (importer and exporter) fixed effects should be included in panel trade data, according to gravity theory (in our analysis, these fixed effects are replaced by smooth functions of size variables (patent and area) because the former is blamed for over-parametrization) (our model is in between fixed and random effects). Fifth, when using panel trade data to estimate gravity, pair-fixed effects should be considered (these random effects are accounted for). Sixth, use the Poisson Pseudo Maximum Likelihood (PPML) estimator to calculate gravity (our method is based on PPML).
Because of the fixed-effect model's over-parametrization and the random-effects model's endogeneity, we choose a semi-mixed effects model. Appropriate variable selection for a non-parametric filter is critical. We chose an area and a patent that are highly correlated with multilateral resistance terms, as recommended by theory (Anderson and WinCoop, Citation2003). To control GDP's collinearity with the population and mean GDP, we capture its nonlinear effects. We take into account the six UNCTAD and WTO recommendations.
5. Conclusion and recommendations
5.1. Conclusions
In this study, we used a Poisson pseudo maximum likelihood estimator for a semi-parametric structural gravity machine learning model to estimate the impact of the COVID-19 pandemic-induced outcomes (cases and deaths), pharmaceutical (vaccinations), and non-pharmaceutical policies on Ethiopian bilateral export and import flows. To accomplish this, we used a data dimension that included 90 countries and 13 quarters beginning in 2018 quarter one and ending in 2021 quarter one for bilateral export and 80 countries and 12 quarters beginning in 2018 quarter one and ending in 2020 quarter four for bilateral import.
A total of 24 regressions were estimated for estimating a set of models consisting of three different specifications for each COVID-19 related independent variable, namely, cases, deaths, stringency index, and vaccination, for both bilateral export and bilateral import of Ethiopia. Eight of these have been chosen based on the criteria of Akaike information criteria, Bayesian information criteria, and economic theory (for four separately regressed independent variables for both export and import).
Based on the model selection criteria outlined above, a model capturing the nonlinearity of GDP to trade (economic theory) and robust for its collinearity with population and others is chosen for bilateral export, and a model with a nonparametric estimation of size variables (Area and Patent) using the Mundalk device is chosen for bilateral import. In both regressions (bilateral export and import), cases, deaths, and the stringency index have a statistically significant negative impact as hypothesized. Vaccinations have a statistically significant positive impact on both bilateral export and import again, as hypothesized when accounting the effects of cases, deaths and non-pharmaceutical policy responses. Ethiopian bilateral export suffers significantly when compared to bilateral import (for example, a 100 percent increase in cases is associated with a 18 percent decrease in bilateral export and a 7 percent decrease in bilateral import). The negative elasticities of cases, deaths, and stringency for bilateral export are 18%, 13%, and 100%, respectively. For bilateral imports, the negative elasticities of cases, deaths, and stringency are 7%, 4%, and 34%, respectively. In the export and import regressions, the positive elasticities for vaccinations are 3% and 5%, respectively in regressions without an interaction term of COVID-19 indeuced variables which is not reported here for brevity and can be obtained from the author based on request. This intriguing result, the more negative effect of cases, deaths, and stringency and less positive effect of vaccinations on bilateral export than on bilateral import of Ethiopia, implies that, in comparison to the global average, Ethiopia's economic agents' behavioral responses to cases, deaths, policy measures, and vaccinations are less for health benefits and more for economic benefits. Ethiopia is a low-income country, so this is to be expected.
When comparing pharmaceutical (vaccination) and non-pharmaceutical policies, non-pharmaceutical policies have a highly significant negative impact on Ethiopian bilateral trade flows: a 100% increase in the stringency of non-pharmaceutical policy responses is associated with an 100 percent decrease in bilateral export and a 34 percent decrease in bilateral import of Ethiopia, whereas a 100% increase in pharmaceutical (vaccination) coverage is associated with a 3 percent increase in bilateral import and a 5 percent increase in bilateral import of Ethiopia, taking the indirect of the vaccination policy.
5.2. Recommendations
The paper's findings suggest that Ethiopia implement import substitution to mitigate the negative effects of COVID-19 pandemic-induced cases, deaths, and policy responses on Ethiopia's bilateral trade flow (i.e. substituting the deviations in imports due to a pandemic locally and creating a local market potential to absorb the products of Ethiopian exporting firms losing their international market due to the pandemic by decreasing imports from abroad). Import substitution is a two-fold recommendation based on the findings. The other finding-based recommendation is to increase the coverage and rate of vaccination campaigns because, in contrast to the other COVID-19-related variables (including non-pharmaceutical policies), vaccination (a pharmaceutical policy) has a statistically significant positive impact on Ethiopia's trade flows, even with only a few quarters of data.
Author contribution statement
Mandefrot Amare: Constructed the dataset and analyzed the data.
Lemma Zemedu: Analyzed and interpreted the data.
Abule Mehare: Interpret the data and wrote the paper.
Ketema Bekele: Wrote and edit the paper.
Acknowledgments
First and foremost, I want to thank God, his mother, Saint Virgin Mary, his Angels, and his Saints. Next, my wife, Mihret Mamo, who sacrifices everything for the completion of this work, must be recognized. In addition, I would like to thank my advisors, Lemma Zemedu, Abule Mehare, and Ketema Bekele, for their free service in providing comments. Then Isabel Proença and Stefan Sperlich pitched in, sharing data and code for replication and identifying estimation issues. Finally, I'd like to express my gratitude to the Ethiopian Roads Authority's training and examination institute, as well as its employees, for their cooperation in accommodating me.
Data availability statement
Data will be made available on request.
Disclosure statement
No potential conflict of interest was reported by the author(s).
Additional information
Funding
References
- Anderson, J. E., & Van Wincoop, E. (2003). Gravity with gravitas: A solution to the border puzzle. American Economic Review, 93(1), 170–192. https://doi.org/10.1257/000282803321455214
- Anderson, James E., and Eric van Wincoop. 2004. “Trade Costs.” Journal of Economic Literature 42: 691–751.
- Autoridad Nacional del Servicio Civil. 2021. “済無No Title No Title No Title.” Angewandte Chemie International Edition 6 (11): 951–952. 2013–2015.
- Baier, S. L., and J. H. Bergstrand. 2007. “Do Free Trade Agreements Actually Increase Members’ International Trade?” Journal of International Economics 71 (1): 72–95. doi:10.1016/j.jinteco.2006.02.005.
- Baldwin, R. E., and E. Tomiura. 2020. “Thinking Ahead About the Trade Impact of COVID-19.” In Economics in the Time of COVID-19, edited by R. E. Baldwin, and B. W. Di Mauro, 59–71. London: CEPR Press.
- Baltagi, Badi H., and Petter Egger. 2016. “Estimation of Structural Gravity Quantile Regression Models.” Empirical Economics 50: 5–15.
- Baltagi, Badi H., Peter Egger, and Michael Pfaffermayr. 2007. “Estimating Models of Complex FDI: Are There Third-Country Effects?” Journal of Econometrics 140: 260–281.
- Behrens, Kristian, Cem Ertur, and Wilfried Koch. 2012. “‘Dual’ Gravity: Using Spatial Econometrics to Control for Multilateral Resistance.” Journal of Applied Econometrics 25: 773–794.
- CEPII 2021- Gravity – Download. Accessed April 4 2021. http://www.cepii.fr/cepii/en/bdd_modele/download.asp?id = 8.
- Chun, Yongwan. 2008. “Modeling Network Autocorrelation Within Migration Flows by Eigenvector Spatial Filtering.” Journal of Geographical Systems 10: 317–344.
- Conte, M., P. Cotterlaz, and T. Mayer. 2021. The CEPII Gravity Database. Cepi, 40. http://www.cepii.fr/DATA_DOWNLOAD/gravity/doc/Gravity_documentation.pdf.
- Curry, L. 1972. “A Spatial Analysis of Gravity Flows.” Regional Studies 6: 131–147.
- Curry, Leslie, Daniel A. Griffith, and Eric S. Sheppard. 1975. “Those Gravity Parameters Again.” Regional Studies 9: 289–296.
- Dingel, J. I., and B. Neiman. 2020. “How Many Jobs Can be Done at Home?” Journal of Public Economics 189: 104235.
- Early, C.-A. n.d. How Effectively is the Asian Development Bank Responding CGD Policy Paper 226 August 2021. August 2021.
- Eaton, J., S. Kortum, B. Neiman, and J. Romalis. 2016. “Trade and the Global Recession.” American Economic Review 106 (11): 3401–3438.
- Economics in the Time of COVID-19 | VOX, CEPR Policy Portal. (n.d.). Accessed January
- Egger, Peter H., and Kevin E. Staub. 2016. “GLM Estimation of Trade Gravity Models with Fixed Effects.” Empirical Economics 50: 137–175.
- Egger, Peter H., and Filip Tarlea. 2015. “Multi-way Clustering Estimation of Standard Errors in Gravity Models.” Economics Letters 134: 144–147.
- Empirical analysis into the impact of COVID-19 on global trade relations | IHS Markit. (n.d.). Retrieved May 4, 2022, from https://ihsmarkit.com/research-analysis/empirical-analysis-into-the-impact-of-covid19-on-global-trade.html
- Fischer, Manfred M., and Daniel A. Griffifith. 2008. “Modeling Spatial Autocorrelation in Spatial Interaction Data: An Application to Patent Citation Data in the European Union.” Journal of Regional Science 48: 969–989.
- Glick, R., and A. K. Rose. 2002. “Does a Currency Union Affect Trade? The Time-Series Evidence.” European Economic Review 46 (6): 1125–1151. doi:10.1016/S0014-2921(01)00202-1.
- Griffith, Daniel A. 2003. Spatial Autocorrelation and Spatial Filtering: Gaining Understanding Through Theory and Scientific Visualization. Berlin, Heidelberg, and New York: Springer-Verlag.
- Hale, T., J. Anania, N. Angrist, T. Boby, E. Cameron-Blake, M. Di Folco, L. Ellen, et al. 2021. Variation in government responses to COVID-19, Version 12.0. In BSG Working Paper Series. https://covidtracker.bsg.ox.ac.uk/stringency-scatter.
- Head, K., T. Mayer, and J. Ries. 2010. “The Erosion of Colonial Trade Linkages After Independence.” Journal of International Economics 81 (1): 1–14. doi:10.1016/j.jinteco.2010.01.002.
- Heiland, I., and K. H. Ulltveit-Moe. 2020. “An Unintended Crisis in sea Transportation due to COVID-19 Restrictions.” In COVID-19 and Trade Policy: Why Turning Inward Won’t Work, edited by R. E. Baldwin, and S. J. Evenett, 151–163. London: CEPR Press.
- IMF Data. (n.d.). Retrieved May 4, 2022, from https://data.imf.org/regular.aspx?key=61013712
- Impact of the coronavirus pandemic on international trade Author : Andras Lakatos Category : COVID-19, Economic Impact, Trade in Goods. n.d. 2020.
- José Lombardía, M., and S. Sperlich. 2012. “A new Class of Semi-Mixed Effects Models and its Application in Small Area Estimation.” Computational Statistics and Data Analysis 56 (10): 2903–2917. doi:10.1016/j.csda.2012.01.015.
- Koch, Wilfried, and James P. LeSage. 2015. “Latent Multilateral Trade Resistance Indices: Theory and Evidence.” Scottish Journal of Political Economy 62: 264–290.
- Krisztin, Tamás, and Manfred M. Fischer. 2015. “The Gravity Model for International Trade: Specification and Estimation Issues.” Spatial Economic Analysis 10: 451–470.
- Lambert, Dayton M., Jason P. Brown, and Raymond J.G.M. Florax. 2010. “A Two-Step Estimator for a Spatial lag Model of Counts: Theory, Small Sample Performance, and an Application.” Regional Science and Urban Economics 40: 241–252.
- LeSage, James P., and R. Kelley Pace. 2008. “Spatial Econometric Modeling of Origin-Destination Flows.” Journal of Regional Science 48: 941–967.
- Mendolia, S., O. Stavrunova, and O. Yerokhin. 2021. “Determinants of the Community Mobility During the COVID-19 Epidemic: The Role of Government Regulations and Information.” Journal of Economic Behavior and Organization 184 (13778): 199–231. doi:10.1016/j.jebo.2021.01.023.
- Metulini, R., Patuelli, R., & Griffith, D. A. (2018). A spatial-filtering zero-inflated approach to the estimation of the gravity model of trade. Econometrics, 6(1): 1–15. https://doi.org/10.3390/econometrics6010009
- Paper, W. (2013). www.econstor.eu.
- Patuelli, Roberto, and Giuseppe Arbia, eds. 2016. Spatial Econometric Interaction Modelling. Cham: Springer. Econometrics 2018, 6, 9 15 of 15.
- Patuelli, Roberto, Gert-Jan M. Linders, Rodolfo Metulini, and Daniel A. Griffith. 2016. “The Space of Gravity: Spatially Filtered Estimation of a Gravity Model for Bilateral Trade.” In Spatial Econometric Interaction Modelling, edited by Roberto Patuelli, and Giuseppe Arbia, 145–169. Cham: Springer International Publishing.
- Patuelli, Roberto, Norbert Schanne, Daniel A. Griffith, and Peter Nijkamp. 2012. “Persistence of Regional Unemployment: Application of a Spatial Filtering Approach to Local Labor Markets in Germany.” Journal of Regional Science 52: 300–323.
- Proença, I., S. Sperlich, and D. Savaşcı. 2015. “Semi-mixed Effects Gravity Models for Bilateral Trade.” In Empirical Economics 48 (1): 361–387. doi:10.1007/s00181-014-0891-x.
- Santos Silva, João M.C., and Silvana Tenreyro. 2006. “The log of Gravity.” Review of Economics and Statistics 88: 641–658.
- Scherngell, Thomas, and Rafael Lata. 2013. “Towards an Integrated European Research Area? Findings from Eigenvector Spatially Filtered Spatial Interaction Models Using European Framework Program Data.” Papers in Regional Science 92: 555–577.
- Sellner, Richard, Manfred Fischer, and Matthias Koch. 2013. “A Spatial Autoregressive Poisson Gravity Model.” Geographical Analysis 45: 180–201.
- Sheppard, Eric S., Daniel A. Griffith, and Leslie Curry. 1976. “A Final Comment on Misspecification and Autocorrelation in Those Gravity Parameters.” Regional Studies 10: 337–339.
- Silva, J. M. C. S., and S. Tenreyro. 2011. “Further Simulation Evidence on the Performance of the Poisson-PML Estimator.” Economics Letters 112 (2): 220–222.
- TRADING ECONOMICS | 20 million INDICATORS FROM 196 COUNTRIES. (n.d.). Accessed January 14 2022. https://tradingeconomics.com/
- Watanabe, T., and Y. Omori (2020). Online Consumption During and After the COVID 19 Pandemic: Evidence from Japan. The Impact of COVID-19 on E-Commerce. https://doi.org/10.51432/978-1-8381524-8-2_4
- World Bank Group. 2020. Global Economic Propects (Issue June). https://www.bancomundial.org/es/news/press-release/2020/06/08/covid-19-to-plunge-global-economy-into-worst-recession-since-world-war-ii.
- WTO. 2020. Methodology for the Wto Trade Forecast of April 8 2020. April.
- Yotov, Y. V., R. Piermartini, J.-A. Monteiro, and M. Larch. (2016). An Advanced Guide to Trade Policy Analysis: The Structural Gravity Model. An Advanced Guide to Trade Policy Analysis: The Structural Gravity Model. https://doi.org/10.30875/abc0167e-en
Appendix
Table A1. number of countries in the export sample and the quarterly average of covid-19 cases beginning from 2018 quarter-one up to 2021 quarter-one.