
 ?Mathematical formulae have been encoded as MathML and are displayed in this HTML version using MathJax in order to improve their display. Uncheck the box to turn MathJax off. This feature requires Javascript. Click on a formula to zoom.
ABSTRACT
Egypt, Sudan and Ethiopia possess diverse natural resources and a substantial labor force that permit forming a successful trade integration. However, the recent dispute over the Grand Ethiopian Renaissance Dam (GERD) project between Ethiopia and downstream countries, Egypt and Sudan, has weakened the bilateral relations and disrupted trade flows among the three countries. This paper investigates the pattern of trilateral trade between Egypt, Sudan and Ethiopia during the period between 1995 and 2018. The study also examines the prospects and challenges for establishing a trilateral trade integration between the three countries. The study adopted the gravity model approach, along with the export diversification and trade complementarity indices, in order to scrutinize the pattern and structure of trade between the countries under study. The analysis indicated that Egypt is the most diversified economy with many crucial comparative advantages, which may grant it a leader position in the integration. Moreover, the paper revealed many challenges that may hinder the implementation of trilateral trade integration including, export concentration, poor infrastructure and disputes over water resources. Finally, the paper recommends that facilitating bilateral trade among the riparian countries of Eastern Nile Basin would mitigate the complex clashes over water rights.
1. Introduction
Free trade between countries has been considered an effective tool to spur economic growth and development (Vamvakidis Citation1998; Fang, Kuo, and CT Citation2020). Indeed, trade enhances productivity and efficiency, hence contributes to poverty reduction through broadening the production base, facilitating export diversification, and encouraging innovations and competitiveness (Dollar and Kray Citation2002; Winters, McCulloch, and McKay Citation2004). Trade also transfers advanced technologies and knowledge between countries and in turn promotes growth and development (Grossman and Helpman Citation1991; Romer Citation1993; Barro, Mankiw, and Sala-i-Martin Citation1992). Moreover, the flow of goods and services between countries improves political relations and enhances peace between nations (Patrick and McDonald Citation2004; Fearon Citation1995; Gartzke Citation1999).
Egypt, Sudan and Ethiopia (ESE hereafter) have maintained mature trade relations, dating back thousands of years. The three countries share an overlapping cultural, historical and religious heritage, and share the largest source of water in Africa (i.e. The Nile River). ESE also possesses considerable and diversified natural and human resources as well as hydropower, rendering them a potential economic power in the region. Furthermore, the three countries host around 260 million inhabitants, representing about one-fifth of the African population (World Bank Citation2020). These advantages would make trade and economic integration between ESE a successful policy option to enhance economic growth and development in the Eastern Nile Basin.
Following the establishment of the Common Market for East and Southern Africa (COMESA) in 1993, the trade between Egypt, Sudan and Ethiopia has expanded significantly. However, the actual bilateral trade between these countries has declined in recent years, particularly after the advent of current dispute over the Grand Ethiopian Renaissance Dam (GERD) project.Footnote1 Therefore, this paper aims to identify the factors influencing trade between ESE and assess the potential benefits and drawbacks of establishing free trade arrangements among them.
Compared to the existing literature, the novelties of this paper are three-fold. First, to the best of the author’s knowledge, it is the first attempt to examine the trilateral trade between Ethiopia, Sudan and Egypt, countries that experience hot dispute over the Grand Ethiopian dam. Therefore, understanding the prospects and challenges for trade arrangements between the three countries would uncover the factors that facilitate trilateral free trade between them. Second, the study contributes to the existing literature on trade between bordering countries, which has received limited research attention in developing regions, particularly in Africa. Third, this study is timely and relevant in light of the ongoing dispute between ESE over the GERD. Thus, understanding the challenges and prospects for trade integration may mitigate the water dispute and promotes beyond the river cooperation in the Eastern Nile basin.
The remainder of this paper is organized as follows. Section two outlines some stylized facts about the ESE economies, while section three discusses the trend of trilateral trade between ESE and their contribution to COMESA integration. Section four identifies the factors that influence bilateral trade using the gravity model, and assesses the potential trade integration through the export diversification and trade complementarity indices. Section five analyzes the prospects and challenges for trilateral trade integration between ESE. Finally, section six concludes with some policy recommendations.
2. Some basic economic indicators for Egypt, Sudan and Ethiopia
2.1 Egyptian economy
Egypt has maintained positive and stable economic growth rates during the past three decades, making it one of the top five economies in Africa (World Bank Citation2020). With a population exceeding 100 million in 2020, Egypt is the third most populous country in Africa, following Nigeria and Ethiopia. Egypt is classified as an upper-middle-income country, with a real GDP per capita of more than USD 3,000 in 2019, surpassing the GDP per capita of the other two countries under study, namely Sudan and Ethiopia.
Regarding the structure of the Egyptian economy, shows that, unlike other African countries, the agriculture sector has the lowest contribution to Egypt's GDP, with an average not exceeding 20% during the last forty years. However, services are the leading sector, contributing to the total GDP with about 50% during such period. Moreover, the industrial sector is the second-largest source of GDP, accounting for about 34%. As indicated in , the share of agriculture in GDP has decreased from 19.6% during (1980–1985) to 11.8% over the period (2011–2018); the share of services in GDP increased from 47.94% in (1980–1985) to about 52% during (2011–2018); and the share of industry in GDP increased from 32.46% in (1980–1985) to 36.61% during (2011–2018). These statistics imply that the Egyptian economy has experienced structural transformations from agriculture to industry and services. This situation also indicates that Egypt is more diversified compared to other African economies, supporting its stable growth rates over the past four decades.
Table 1. Selected economic indicators – Egypt (Average period).
Concerning trade performance, shows that Egypt's exports and imports have increased remarkably during the last two decades. The volume of exports increased about sevenfold between 1980 and 2018. However, the gap between imports and exports is quite large over such period, implying that Egypt suffers from a prolonged trade deficit. Additionally, the Table reveals that the trade-GDP ratio is very high, accounting on average for about 52% between 1980 and 2018.
2.2 Sudanese economy
Sudan is the third-largest country in Africa (after Algeria and the Democratic Republic of the Congo), covering an area of 1,886,068 square kilometers. The country is one of the most geographically diverse states on the continent, endowed with a wide variety of natural resources. Specifically, Sudan has a considerable amount of arable land, livestock and water resources. Despite its largest area, Sudan has a smaller population (estimated at around 43 million in 2020) compared to Ethiopia and Egypt.
In recent decades, Sudan's economy has undergone dramatic transformations. Prior to the exploitation of oil in 1999, agriculture was the backbone of the economy since its independence in 1956. Subsequently, after the commercial exportation of oil, the country became heavily dependent on oil revenues, which contributed an average of 20% and 95% to total GDP and exports earnings, respectively, between 2000 and 2011. However, following the secession of South Sudan in 2011 and the loss of 76% of the country's proven oil revenues, Sudan has encountered numerous economic problems including negative economic growth, high inflation, budget deficit and exchange rate instability (Mustafa, Elshakh, and Ebaidalla Citation2019; Abbass Citation2022).
In terms of its economic structure, Sudan's economy was primarily reliant on agriculture, which accounted for around 40% of total GDP and employed approximately 70% of the population. The share of the industrial sector, particularly manufacturing, was quite small, while the services sector's contribution to GDP was significant and increased over time, averaging around 45% between 2000 and 2018. Notably, the structure of Sudan's economy has undergone significant changes in recent decades, first due to oil exploitation and then the secession of South Sudan, as well as political instability in recent years. also shows that the share of agriculture in GDP declined from 44.86% during (1996–2000) to 30.9% over the period (2011–2018). The share of services in GDP increased from (38.86)% throughout (1996–2000) to about 46.15% during (2011–2018), while the share of industry in GDP increased from 16.38% during (1996–2000) to 22.9% throughout (2011–2018). The decline in the share of agriculture is primarily attributed to the country's dependence on oil and gold exports during the last two decades.
Table 2. Selected economic indicators – Sudan (Average period).
Regarding the trade performance, reveals that the values of Sudanese exports and imports increased significantly during the period from 1980 to 2010. As shown in , while the value of exports and imports increased more than ten times between 1980 and 2010, both exports and imports have declined after the secession of South Sudan in 2011. Notably, the gap between exports and imports decreased during the oil exportation era (1999–2011), indicating a positive effect of oil on the trade balance. However, the trade-GDP ratio fluctuated remarkably during the last two decades owing to the structural transformations following the oil exploitation and the secession of South Sudan.
2.3 Ethiopian economy
Ethiopia is the second most populous country in Africa after Nigeria, with a population of approximately 112 million inhabitants in 2020 (World Bank Citation2020). A large portion of the Ethiopian population lives in poverty with a low per capita income of less than US$ 800 per annum on average over the last decade (World Bank Citation2020). Like other Sub-Saharan African (SSA) countries, Ethiopia heavily relies on agriculture, which contributes around 50% to the total GDP ().
Table 3. Selected economic indicators – Ethiopia (Average period).
As shown in , the GDP growth rate has increased sharply during the last twenty years, reaching an average of more than 10% during the period 2006–2010, which is double the average growth rate of Sub-Saharan Africa (World Bank Citation2020). Additionally, per capita GDP has also increased significantly from USD 215 during 1980–1985 to about USD 573 on average during 2011–2018. However, despite the high growth rates in the last two decades, per capita GDP in Ethiopia remains relatively low, reflecting the prevalence of poverty and unfavorable economic conditions.
Regarding the contribution of economic sectors to the total GDP, shows that agriculture is the largest sector, contributing on average about 45%. However, the share of agriculture in Ethiopia's GDP has decreased in recent years compared to the 1990s. Like other African countries, the share of the industry in the Ethiopian economy is relatively small, with an increasing trend over the last ten years. The services sector is the second-largest contributor to GDP, with an upward trend in the last few decades. also indicates that the share of agriculture in GDP has decreased from 57.7% during (1980–1985) to 37.63% throughout 2011–2018; the share of services in GDP increased from 33.4% during (1980–1985) to about 45.12% throughout (2011–2018), and the share of the industry in GDP increased from 9.8% during (1980–1985) to 16.57% during (2011–2018).
Regarding trade performance, Ethiopia has reported a continuous increase in its exports and imports. However, the trade deficit remains high reflecting the big gap between exports and imports. Moreover, the trade-GDP ratio increased remarkably during the last decades from 19.28% in (1980–1985) to 39.08% during (2011–2018), reflecting the expansion of the external sector.
3. Trend of trade between Egypt, Sudan and Ethiopia
Before analyzing the prospects and challenges for trilateral trade integration between Egypt, Sudan and Ethiopia, it is useful to highlight the trend of actual bilateral trade between each pair of the countries under study.
3.1 Bilateral trade between Ethiopia and Sudan
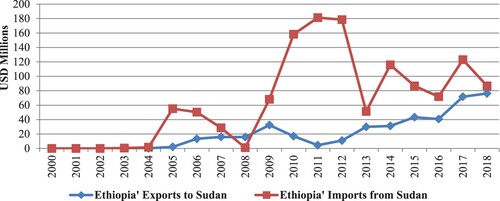
Ethiopia shares long borders with Sudan, which facilitates the movement of goods and services between the two countries through both formal and informal channels. The history of bilateral trade between Sudan and Ethiopia dates back several centuries, and the trade between the two countries has witnessed significant progress, particularly after the establishment of the COMESA integration, as the two countries are main members of the treaty. Moreover, Ethiopia and Sudan signed a bilateral trade agreement in 2002 to foster free trade by eliminating trade barriers and promoting free competition. Since then, trade between the two countries has increased considerably. Additionally, the advent of Sudanese oil in 1999 raised the bilateral trade between Ethiopia and Sudan, as this period experienced substantial trade flows between the two countries. It is worth mentioning that the recent military conflict in the Tigray region and the border dispute between Sudan and Ethiopia during 2020 and 2021 resulted in suspension of trade flows between the two countries.Footnote2
illustrates that the bilateral trade between Ethiopia and Sudan has increased dramatically over the last two decades. The value of Ethiopian exports to Sudan rose from about one million USD in 2000 to around USD 74 million in 2009, and then dropped to about USD 9 million in 2012. Similarly, Ethiopian imports from Sudan increased from less than one million in 2000 to about USD 207 million in 2012. Furthermore, indicates that trade between Sudan and Ethiopia declined after 2011, which can be attributed to the loss of 76% of Sudanese oil after the secession of South Sudan (Abbass Citation2022). It is worth mentioning that oil products were the primary Ethiopian imports from Sudan during this period.
Figure 1. Bilateral trade between Ethiopia and Sudan (USD Millions). Source: Author’ compilation from International Monetary Fund, Direction of Trade Statistics (DOTS).
3.2 Bilateral trade between Ethiopia and Egypt
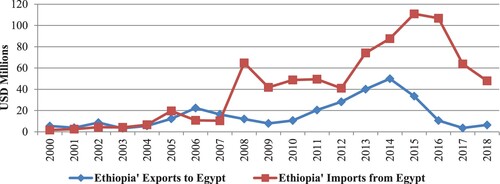
The bilateral trade between Ethiopia and Egypt has experienced remarkable progress in the recent decade, but it is less than that between Ethiopia and Sudan. The unfavorable performance of bilateral trade between the two countries can be explained by the remote distance and difference in culture and language, as well as the lack of common borders. However, during the first decade of the twenty-first century, the bilateral trade between Egypt and Ethiopia has increased remarkably, as the two countries benefited from the preferential arrangement under the COMESA treaty. shows that the Ethiopian exports to Egypt increased from about USD 6 million in 2000 to about USD 26 million in 2012, while Ethiopian imports from Egypt increased from about USD 15 million to USD 115 million in 2016. Nevertheless, after 2015 the volume of trade between Egypt and Ethiopia decreased, which can be explained by the ongoing dispute between the two countries over the Grand Ethiopian Renaissance Dam (GERD) project.
Figure 2. Bilateral trade between Ethiopia and Egypt (USD Millions). Source: Author’ compilation from International Monetary Fund, Direction of Trade Statistics (DOTS).
3.3. Bilateral trade between Sudan and Egypt
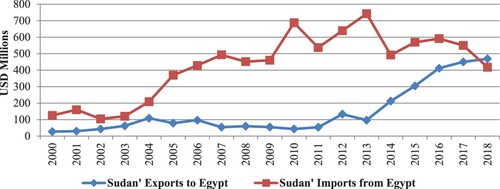
Sudan and Egypt share common borders, languages and cultures as well as historical linkages. Accordingly, the bilateral trade between the two countries reported higher rates compared to the bilateral trade between Sudan and Ethiopia, and between Egypt and Ethiopia. Following the establishment of COMESA's free trade area (FTA) in 2002, trade between Egypt and Sudan has witnessed considerable expansion.
shows that the bilateral trade between Sudan and Egypt has grown rapidly during the past twenty years. The Sudanese imports from Egypt increased from USD 125 million in 2000 to about USD 743 million in 2013. Conversely, after 2013, the Sudanese imports decreased remarkably due to an overall reduction in Sudan's trade, following the secession of South Sudan and loss of the oil revenues in 2011. The figure also shows that Sudanese exports to Egypt increased from USD 27 million in 2000 to about USD 469 million in 2018. These statistics indicate that the bilateral trade between Sudan and Egypt is more stable than that between Sudan and Ethiopia, and between Egypt and Ethiopia. However, the volume of Egypt's exports to Sudan is higher than the Sudan's exports, which can be justified by the larger size of Egypt's economy compared to Sudan's.
Figure 3. Bilateral Trade between Sudan and Egypt (USD Millions). Source: Author’ compilation from International Monetary Fund, Direction of Trade Statistics (DOTS).
3.4 The share of Egypt, Sudan and Ethiopia in COMESA’s total exports
Egypt, Sudan and Ethiopia are the main founders of COMESA integration and participate in all trade arrangements since its establishment in 1993. To understand the role of ESE in COMESA trade performance, presents the share of ESE in COMESA's total exports. As shown in the table, Egypt is the largest contributor to COMESA's exports, with a share of 6.7%, 25.9% and 22.8% in 2000, 2010 and 2018, respectively. The table also indicates that Egypt's exports represent about one-quarter of intra-COMESA exports. This could be explained by the fact that Egypt is the most developed and diversified country compared to other members of COMESA. While the share of Ethiopia's exports decreased between 2000 and 2018, the share of Sudanese exports declined during (2000–2011), and then increased in 2018. In 2018, the contribution of Ethiopia and Sudan to intra-COMESA exports was about 2.5% and 6.8%, respectively.
Table 4. The Share of Egypt, Sudan and Ethiopia in Intra-COMESA Total Exports (USD Millions).
4. Empirical analysis
To examine the actual and potential performance of trilateral trade between Ethiopia, Sudan and Egypt, the study uses three approaches namely, the gravity model, the diversification index and the trade complementarity index. The gravity model is used to understand the factors influencing bilateral trade between the countries under study, while the diversification and complementarity indices are used to assess the potential prospects for trade integration between ESE.
4.1 Factors influencing trade between Egypt, Sudan and Ethiopia: A gravity model analysis
To examine the factors underlying trade between ESE, the study used the conventional gravity model with some modifications. The gravity model was introduced by Tinbergen (Citation1962) and Linnemann (Citation1966) and later developed by (Anderson Citation1979) to investigate the factors that influence bilateral trade flow between countries. In recent decades, numerous studies have adopted the gravity model to examine regional integration and factors that affect bilateral trade between countries (e.g. Foroutan and Pritchett Citation1993; Elbadawi Citation1997; Lyakurwa et al. Citation1997; Longo and Sekkat Citation2004; Guan and Sheong Citation2020; Emikönel Citation2022).
Regarding Africa, many empirical studies have used the gravity model to investigate the performance of trade between counties. For example, Chauvin and Gaulier (Citation2002) adopted gravity model to investigate the potential of intra-SADC trade, while Simwaka (Citation2011) assessed the success of SADC free trade area over the period 1998–2007. Additionally, Ebaidalla and Yahia (Citation2014) assessed the performance of intra-COMESA trade integration employing the gravity model, and Ngepah and Udeagha (Citation2018) investigated regional trade agreements in Africa and assessed trade creation and diversion effects through gravity model.
Based on the previous literature on the bilateral trade (e.g. Foroutan and Pritchett Citation1993; Longo and Sekkat Citation2004; Guan and Sheong Citation2020; Kamal et al. Citation2021; Ebaidalla and Ali Citation2023), the gravity model to be estimated is specified as follows:
(1)
(1) where i indicates the exporter, j is the trading partner (i.e. importer) and t is the time of period under consideration (i.e. 1995–2018). EXPijt is the exports between country i and country j, which are gathered from the International Monetary Fund’ (IMF) Direction of Trade and COMESA website. POPi and POPj are the population number of country i and j in million, respectively, sourced from the World Bank’ Development Indicator (WDI). GDPi and GDPj are the gross domestic product of country i and j; INFRi and INFRj are infrastructure level in country i and j measured by the telephone lines per 100 people, sourced from WDI.Footnote3 The variable DISij is the geographical distance in kilometers between the capital city of country i and country j, gathered from the following website: http://www.distancefromto.net/countries.php. CL is a dummy variable to captures common language, taking the value of 1 if the two countries speak same language, and zero otherwise. Finally,
is the error term. All variables are expressed in the natural logarithms except dummy variables.
The expected sign for the coefficient of GDP per capita is positive, as an increase in national income stimulates more imports demand and exports supply between trading partners. The impact of population size on bilateral trade (POP) is ambiguous as suggested by previous empirical studies (e.g. Markheim Citation1994). The impact of infrastructure is expected to be positive, as an improvement in infrastructure would increase bilateral trade between the trading partners (Chinn and Fairlie Citation2006; Lawless Citation2010). The coefficient of distance is expected to be negative, as the far distance between two countries’ economic centers, the higher the cost of transporting goods between them. Finally, the dummy variable of common language is expected to be positive, as speaking the same language indicates the same cultures, and hence more trade between trading partners.
The gravity model in equation (1) is estimated through the panel data methods namely, the fixed effects (FE) and the random effects (RE) models. When estimating the trade between randomly selected countries from a group of countries, random effects model is more suitable, while the fixed effects model is better when analyzing the flow of trade between an ex-ante predetermined countries (Egger Citation2000; Ebaidalla and Yahia Citation2014). Since our study aims to identify the determinants of bilateral trade between three predetermined countries (i.e. Egypt, Sudan and Ethiopia), the fixed effects would be more appropriate than the random effects model. To further confirm whether the fixed effects model is more suitable than the random effects, we adopt the Hausman test. If the null hypothesis of no correlation between the individual effects and regressors is rejected, then the fixed effects model is more appropriate compared to the random effects model.
The estimation results of the gravity model using the fixed effects and random effects models are presented in . The results in the second column of are those of the fixed effects models, which consider the heterogeneity by estimating country-specific effects. To check the efficiency of fixed effects, the F-test was applied to ensure the poolability of the data. The result of the F-test shows that the null hypothesis of equality of the individual effects is rejected, suggesting that a model with individual effects must be adopted (i.e. fixed or random effects). However, the results in column three show those of the random effects model. The Hausman test statistics accepts the null hypothesis that the coefficients of the FE models and the RE models are equal, suggesting that RE estimates are more appropriate and efficient. Thus, we rely on the results of RE model of column 3, which takes into account all variables specified in our gravity model. The Likelihood Ratio Chi-square of 264.84 with a p-value of (0.000) indicates that the selected explanatory variables of the random effect model together have a significant impact on bilateral trade flow between the countries under consideration.
Table 5. Estimation results of the Gravity model (1995–2018).
The results in show that most of the estimated coefficients carry their expected signs and are consistent with the theory. The coefficients of GDP per capita of both the exporting and importing countries are positive and significant as expected, implying that economic development plays a significant role in enhancing bilateral trade among ESE. This result is in line with the findings of previous empirical studies (e.g. Pastore, Ferragina, and Giovannetti Citation2009; Kamal et al. Citation2021; Ebaidalla and Ali Citation2023). As expected the coefficient of infrastructure of the exporting country is positive and significant, indicating that an improvement in the infrastructure in the exporting country boosts trade flow between the trading partners. Specifically, an increase in the infrastructure of the exporting country by 1% increases its exports to importing country by about 0.108%.
The results also indicate that the impact of geographical distance is negative and significant, as expected, which suggests that a remote distance between trading partners increases transportation costs and reduces trade flow between the partners. This finding validates the results of many previous empirical studies (e.g. Pastore, Ferragina, and Giovannetti Citation2009; Osabuohien et al. Citation2019; Kox and Rojas-Romagosa Citation2020). Overall, most of the findings of this study are consistent with those of many previous studies (e.g. Simwaka Citation2011; Pastore, Ferragina, and Giovannetti Citation2009; Ebaidalla and Yahia Citation2014; Osabuohien et al. Citation2019)
4.2 Exports diversification and trade complementarity
To analyze the potential gains from trilateral trade integration between ESE, we use two approaches, namely, the exports diversification and the complementarity index. These indices are widely adopted in literature to examine the potential trade between trading partners (e.g. Yeats Citation1998; Feenstra et al. Citation1999; Al-Marhubi Citation2000).
4.2.1 Exports diversification index
It is well recognized that countries with more diversified exports are more likely to form successful regional trade arrangements (Yeats Citation1998; Chauvin and Gaulier Citation2002). This is because countries with more diversified production structures have a higher likelihood of producing a wide range of products that can be exchanged with their trading partners. In addition, a diversified country might become less vulnerable to export instability, which could reduce its commitment to regional arrangements. Therefore, export diversification is a fundamental factor for an effective trade arrangement between trading partners (Yeats Citation1998).
The export diversification index measures whether the export structure of a certain country differs from that of the world (Feenstra et al. Citation1999; Al-Marhubi Citation2000). Several indicators have been adopted in the empirical literature to measure export diversification, including the Hirschman concentration index, the Theil index, and the modified measure of similarity in trade developed by Finger and Kreinin (Citation1979). However, this study adopts the Finger and Kreinin index (FKI), which has been used in many previous studies (e.g. Al-Marhubi Citation2000; Samen Citation2010; Hodey, Oduro, and Senadza Citation2015). The FKI is calculated as the absolute deviation of the export structure of a country from the world's export structure, which can be computed using the following formula:
(2)
(2) where
is the export diversification index of country j,
denotes the share of commodity i in total exports of country j and
represents the share of commodity i in the world exports. The value of this index ranges between 0 and 1; where 0 indicates total diversification and 1 implies total concentration. An increase in the index values suggests that a country's export structure is similar to the global export structure, while a decrease indicates a difference between a country's export structure and the global export structure. presents the trend of export diversification indices for the three countries under study over the period (1995–2018).
Figure 4. Export diversification index by country (1995–2018). Source: Author’s Calculation based on UN-COMTRADE website (https://comtrade.un.org/Data/), using SITC 2 digit.
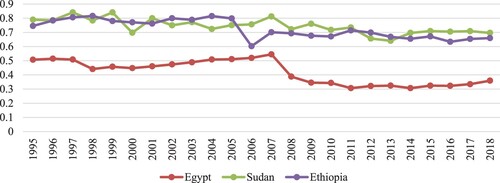
indicates that the trend of export diversification for Egypt is lower than that of Sudan and Ethiopia. This suggests that Egypt is the more diversified compared to Sudan and Ethiopia. Sudan and Ethiopia experienced high export diversification with a quasi-identical trend throughout (1995–2018). The high diversification index over the period between 1999 and 2011 can be explained by the commercial exploitation of oil, as during such period, oil products dominated the Sudanese exports. The Figure also shows that the export diversification indices of the three countries reported a decreasing trend over time. However, the diversification indices are relatively high for all countries under study, reflecting the typical features of developing countries. These results are in line with the study of Yeats (Citation1998), which documented that African exports concentrate on very few commodities – the matter that reduces the possibilities of African countries to form an efficient trade integration.
4.2.2 Product complementarity index
Another method to assess the potential trade between ESE is the product complementarity index. The trade complementarity index measures whether the export pattern of one country matches the import pattern of the trading partner. It also examines the prospects for regional trade integration between countries, showing how well the structures of a country's imports and exports match. Following Michaely (Citation1996), Yeats (Citation1998) and Chauvin and Gaulier (Citation2002), the bilateral complementarity index between two countries j and k (Cjk) can be defined as follows:
(3)
(3) where Xij is the share of good i in the total exports of country j and Mik, represents the share of good i in the total imports of country k. This index measures the similarities between the exports basket of one country and the imports basket of another country (Michaely Citation1994; Chauvin and Gaulier Citation2002). The value of the complementarity index ranges between zero (represents no complementarity between exports and imports of two countries) and one hundred (implies a perfect export-import match). The higher index between the two countries indicates higher product complementarity between them, implying promising prospects for successful trade integration. The bilateral product complementarity indices for Egypt, Sudan and Ethiopia are calculated using the data collected from the UN-COMTRADE website. Due to the lack of recent trade data for the countries under study, we calculated the diversification indices for the period from 2012 to 2018.Footnote4 We computed both exports and imports complementarity indices, and the results of the average period for each country pair are presented in .
Figure 5. Bilateral complementarity indices between Ethiopia, Sudan and Egypt (2012–2018). Source: Author’s Calculation based on the UN-COMTRADE website (https://comtrade.un.org/Data/), using SITC 2 digit.
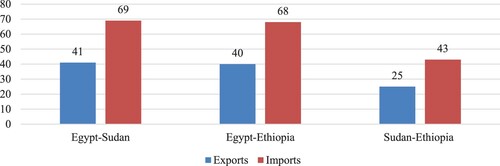
The Figure shows that the complementarity indices for both exports and imports between Egypt and Sudan has the highest value (41 and 69), implying that there is high scope for Egypt to export and import from Sudan and vice versa. In addition, the complementarity indices between Egypt and Ethiopia ranks second (40 and 68), confirming the high rate of actual trade between the two countries over the last two decades. This also indicates a promising trade arrangement between Egypt and Ethiopia. However, the Figure shows that the complementarity indices for trade between Sudan and Ethiopia are far lower, which can be explained by the similarity of products produced by the two countries. Overall, the trade complementarity indices confirm that Egypt is the most diversified country among the ESE, and has comparative advantages in many products, particularly manufacturing, indicating its potential to lead trade between Sudan and Ethiopia.
5. Prospects and challenges for forming free trade area (FTA) between ESE countries
5.1 Prospects for forming FTA between ESE
Based on the results of the gravity model as well as diversification and complementarity indices, we can assess the prospects for establishing a free trade area between Egypt, Sudan and Ethiopia (ESE, FTA). According to the literature, preferential trade arrangements like custom union and FTA normally results in two gains for its members: the static and dynamic gains (Baldwin Citation1992; Zhang Citation2017). The static gains capture the net effect of trade creation versus trade diversion, while the dynamic benefits include increasing competition, economies of scale, stimulating investment and better utilization of economic resources. Having the three countries endowed with abundant and diversified resources, a successful FTA can be launched to facilitate free trade area among ESE. Examples of the abundant resources in the ESE include Egypt's considerable amount of highly skilled human resources and sizable savings, Sudan's large amount of natural resources such as agriculture and minerals, and Ethiopia's substantial labor force, livestock, and hydropower. These diversified resources provide a potential base for comparative advantages in these countries, which can facilitate trilateral trade between them. Furthermore, the product complementarity between the three countries offers a potential option for expanding intra-regional trade. Therefore, the potential benefits of forming an FTA could be outlined as follows:
FTA can increase the market share of local production, as the ESE region has a considerable population. Specifically, the three countries together host approximately 260 million inhabitants, which accounts for about 20% of the African population in 2020. Therefore, the significant population size is an important factor for expanding trade among the countries under study.
FTA may create economies of scale in domestic production, as the three countries form a huge market and possess abundant natural and human resources. This will foster economic growth and development.
Establishing a FTA between ESE would increase competition among the member countries, leading to improved efficiency, higher product quality, and lower prices.
Trade arrangements can increase intra-regional trade and the flow of foreign capital (mainly from Egypt), which can boost industrial development in the other two partner countries (i.e. Sudan and Ethiopia).
FTA between the ESE countries has the potential to increase investment and diversification of exports, which would lead to enhanced economic growth and development for all three nations.
Trade agreements between these countries offer numerous opportunities, including trade reforms, increased credibility for liberalization policies, and the development of trade-related governance and institutions.
Given that all three countries are already part of the COMESA integration, the existing trade arrangements under the COMESA agreement could pave the way for the formation of a Free Trade Agreement (FTA) and foster bilateral trade between ESE.
FTA between ESE can ease the long-decade dispute over the water resources (i.e. the Nile river) and foster cooperation between the partners. Therefore, the three countries can benefit from the hydropower to be generated from the GERD.
5.2 The potential challenges facing trade integration between ESE
Although establishing a free trade area or any trade arrangements between ESE can bring fruitful benefits for the three countries, many challenges may hinder the implementation of such trade arrangements. These challenges include.
Poor infrastructure in ESE may impede the flow of exports and imports between the members, as these countries suffer from weak infrastructural networks in both physical and soft dimensions. However, Egypt has relatively advanced infrastructure compared to Ethiopia and Sudan. While some efforts have been exerted to enhance road connectivity between the three countries, the existing roads have little impact on trade flows. Recent statistics show that the ratio of paved roads out of total roads is estimated at 92.2%, 42%, and 14% in Egypt, Sudan, and Ethiopia, respectively (World Bank Citation2020). Notably, the weakness of the road system stimulates informal trade between ESE. Moreover, in terms of soft infrastructure like information and communication technologies (ICTs), Egypt and Sudan have more advanced communication networks compared to Ethiopia. This is evident by the wider internet coverage in Egypt and Sudan compared to Ethiopia (World Bank Citation2020).
The three countries heavily rely on trade taxes as a main source of revenue; thus, removing tariffs as a result of trade arrangements may deprive partners of a significant source of budget financing. Some studies have documented that the proportion of trade taxes out of total revenues and GDP in African countries is very high (Khandelwal Citation2004). Moreover, the FTA may lead to changes in the sectoral and business structure of individual economies that are likely to affect the overall level of tax revenues.
In addition, removing tariffs through the FTA can results in output and employment losses, since the elimination of tariffs may result in harmful effects on economic sectors and businesses in each country.
Commodity concentration is considered a significant obstacle for FTA between ESE. This is because Egypt, Sudan and Ethiopia are not well diversified economies and their exports concentrate on few commodities like agricultural products. This is what we have indicated from the high indices of export diversification.
Furthermore, the dispute over the Grand Ethiopian Renaissance Dam may impede any attempts for trade integration or any forms of beyond the River cooperation between the partners, at least in the short-run.
6. Conclusion and policy recommendations
This paper examines the pattern of bilateral trade between Egypt, Sudan and Ethiopia. It also investigates the prospects and challenges for establishing a regional trade arrangement between such countries. The paper used the gravity model of bilateral trade as well as the export diversification and trade complementarity indices, employing annual data from 1995 to 2018.
The results of the gravity model indicated that the bilateral trade between Egypt, Sudan and Ethiopia is positively influenced by GDP per capita and the level of infrastructure. The impact of geographical distance on bilateral trade is negative and significant as expected. Moreover, the results of diversification index show that Egypt is the most diversified country, while Sudan and Ethiopia are less diversified. The trade complementarity indices show that the Egyptian exports have higher demand in the other two countries, implying that Egypt has a potential opportunity to lead trade between Sudan and Ethiopia.
The results of the gravity model suggest that GDP per capita and infrastructure have a positive effect on bilateral trade between Egypt, Sudan and Ethiopia. As expected, geographical distance has a negative and significant impact on trade. Moreover, the diversification index indicates that Egypt is the most diversified country while Sudan and Ethiopia are less diversified. The trade complementarity indices reveal that Egypt's exports have a higher demand in the other two countries, indicating a potential opportunity for Egypt to lead trade between Sudan and Ethiopia.
Taking into account the expected trade challenges, the study revealed that Egypt, Sudan, and Ethiopia are capable of implementing trade arrangements such as free trade areas. The countries possess diversified natural and human resources, providing a convenient base for product complementarity and comparative advantages among economic sectors. Moreover, ESE constitute a significant segment of the African market, hosting about 20% of the African population. Therefore, establishing a trade arrangement would stimulate the flow of goods and services, promote growth, and reduce poverty in the Eastern Nile region. Despite the potential benefits of the suggested trade arrangement, several challenges may hinder its implementation, including poor infrastructure, dependence on trade taxes, and disputes over water resources.
Based on the above findings, the study proposes several recommendations to maximize the prospects for establishing a free trade area, and reduce trade challenges that hinder trilateral trade among ESE. First, export diversification should be prioritized on the policy agenda of ESE governments. Therefore, member countries need to focus on industrialization to enhance trade integration, as it is a crucial factor behind successful trade integrations. Second, to enhance trade complementarity between potential members, a specialization scheme should be adopted to break commodity concentration. Third, policymakers in ESE need to promote transportation and communication infrastructures between the members to increase trilateral trade. Fourth, extra efforts should be made to attract foreign direct investment and private capital to boost the trade sector in ESE. Fifth, policymakers in ESE should adopt effective economic policy measures to facilitate trilateral trade, including tax regime reform, transaction cost reduction and human capital development. Finally, facilitating bilateral trade between Egypt, Sudan, and Ethiopia could help in resolving the dispute over Nile waters.
Acknowledgements
Open Access funding provided by the Qatar National Library.
Disclosure statement
No potential conflict of interest was reported by the author(s).
Notes
1 In April 2011, Ethiopia launched its largest hydropower project on the Blue Nile – the Grand Ethiopian Renaissance Dam (GERD). Since its declaration, the project has created tensions between Egypt (considers it a threat to its water security), and Ethiopia (views that the dam would cause no significant harm to downstream countries: Egypt and Sudan) (Salman Citation2016; Tawfik Citation2019).
2 In November 2020, long-standing tensions between the federal government of Ethiopia and the local government of the northern Tigray region, the Tigray People’s Liberation Front (TPLF), erupted into military conflict and continued throughout 2021. The conflict has resulted in the deaths of thousands and the destruction of infrastructure (Gavin Citation2021).
3 Following the existing literature on bilateral trade (e.g. Anderson and van Wincoop Citation2004; Chinn and Fairlie, Citation2006; Lawless Citation2010), we measured infrastructure by the telephone lines per 100 people. The literature has documented the importance of infrastructure in business activities and bilateral trade (Anderson and van Wincoop Citation2004; Wang and Firestone Citation2010).
4 The trade data for Sudan are only available for the period after 2012.
References
- Abbass, A. 2022. “Post-secession Sudan and South Sudan: A Comparative Study of Economic Performance, Export Diversification, and Institutions.” Journal of Asian and African Studies, doi:10.1177/00219096221076106.
- Al-Marhubi, F. 2000. “Export Diversification and Growth: An Empirical Investigation.” Applied Economics Letters 7 (9): 559–562. doi:10.1080/13504850050059005.
- Anderson, J. E. 1979. “A Theoretical Foundation of the Gravity Equation.” American Economic Review 69 (1): 106–116. https://www.jstor.org/stable/1802501.
- Anderson, J. E., and E. Van Wincoop. 2004. “Trade Costs.” Journal of Economic Literature 42 (3): 691–751. doi:10.1257/0022051042177649.
- Baldwin, R. E. 1992. “Measurable Dynamic Gains from Trade.” Journal of Political Economy 100 (1): 162–174. doi:10.1086/261811.
- Barro, R. J., N. G. Mankiw, and X. Sala-i-Martin. 1992. “Capital Mobility in Neoclassical Models of Growth.” National Bureau of Economic Research (NBER), Working Paper 4206.
- Chauvin, S., and G. Gaulier. 2002. “Regional Trade Integration in Southern Africa.” CEPPI, Working paper 12.
- Chinn, M. D., and R. W. Fairlie. 2006. “The Determinants of the Global Digital Divide: A Cross-Country Analysis of Computer and Internet Penetration.” Oxford Economic Papers 59 (1): 16–44. doi:10.1093/oep/gpl024.
- Dollar, D., and A. Kray. 2002. “Growth is Good for the Poor.” Journal of Economic Growth 7 (3): 195–225. doi:10.1023/A:1020139631000.
- Ebaidalla, E. M., and M. E. M. Ali. 2023. “Assessing Intra-Arab Trade Integration and Potential: Evidence from the Stochastic Frontier Gravity Model.” The International Trade Journal 37 (2): 221–239. doi:10.1080/08853908.2022.2029725.
- Ebaidalla, E., and A. Yahia. 2014. “Performance of Intra-COMESA Trade Integration: A Comparative Study with ASEAN’s Trade Integration.” African Development Review 26 (S1): 77–95. doi:10.1111/1467-8268.12094.
- Egger, P. 2000. “A Note on the Proper Econometric Specification of the Gravity Equation.” Economics Letters 66 (1): 25–31. doi:10.1016/S0165-1765(99)00183-4.
- Elbadawi, I. 1997. “The Impact of Regional Trade and Monetary Schemes on Intra-sub Saharan Africa Trade.” In Regional Integration and Trade Liberalization in sub-Saharan Africa, edited by O. Ademola, I. Elbadawi, and P. Collier, 210–225. London: Macmillan.
- Emikönel, M. 2022. “The Impact of International Organizations on Chinese Trade as the Determiner of Trade: The Gravity Model Approach.” The Chinese Economy 55 (1): 26–40. doi:10.1080/10971475.2021.1892920.
- Fang, C., K. H. Kuo, and Lee CT. 2020. “Free Trade and Economic Growth: The Role of Talent Diversity.” Bulletin of Economic Research 72 (1): 1–13. doi:10.1111/boer.12201.
- Fearon, J. D. 1995. “Rationalist Explanations for War.” International Organization 49 (3): 379–414. doi:10.1017/S0020818300033324.
- Feenstra, R., D. Madani, T. Yang, and C. Liang. 1999. “Testing Endogenous Growth in South Korea and Taiwan.” Journal of Development Economics 60 (2): 317–341. doi:10.1016/S0304-3878(99)00054-1.
- Finger, J. M., and M. E. Kreinin. 1979. “A Measure of Export Similarity and its Possible Uses.” The Economic Journal 89 (356): 905–912. doi:10.2307/2231506.
- Foroutan, F., and L. Pritchett. 1993. Intra-sub-Saharan African Trade: Is it Too Little? World Bank Policy Research Working Paper 1225. Washington, DC: World Bank.
- Gartzke, E. 1999. “War is in the Error Term.” International Organization 53 (3): 567–587. doi:10.1162/002081899550995.
- Gavin, M. 2021. “The Conflict in Ethiopia’s Tigray Region: What to Know.” Council on Foreign Relations. February 10th. https://www.jstor.org/stable/resrep31163?seq = 1.
- Grossman, G., and E. Helpman. 1991. “Quality Ladders in the Theory of Economic Growth.” The Review of Economic Studies 58 (1): 43–61. doi:10.2307/2298044.
- Guan, Z., and J. Sheong. 2020. “Determinants of Bilateral Trade Between China and Africa: A Gravity Model Approach.” Journal of Economic Studies 47 (5): 1015–1038. doi:10.1108/JES-12-2018-0461.
- Hodey, L. S., A. D. Oduro, and B. Senadza. 2015. “Export Diversification and Economic Growth in sub-Saharan Africa.” Journal of African Development 17 (2): 67–81. doi:10.5325/jafrideve.17.2.0067.
- Kamal, M., U. Qayyum, S. Khan, and B. Adeleye. 2021. “Who is Trading Well with China? A Gravity and Constant Market Share Analysis of Exports of Pakistan and ASEAN in the Chinese Market.” Journal of Asian and African Studies, doi:10.1177/00219096211045098.
- Khandelwal, P. 2004. “COMESA and SADC: Prospects and Challenges for Regional Trade Integration”, IMF Working Paper, No. 227. International Monetary Fund, Washington, DC.
- Kox, H. L., and H. Rojas-Romagosa. 2020. “How Trade and Investment Agreements Affect Bilateral Foreign Direct Investment: Results from a Structural Gravity Model.” The World Economy 43(12): 3203–3242. doi:10.1111/twec.13002
- Lawless, M. 2010. “Deconstructing Gravity: Trade Costs and Extensive and Intensive Margins.” Canadian Journal of Economics/Revue Canadienne D'économique 43 (4): 1149–1172. doi:10.1111/j.1540-5982.2010.01609.x.
- Linnemann, H. 1966. An Econometric Study of International Trade Flows (No. 42). Amsterdam: North-Holland.
- Longo, R., and K. Sekkat. 2004. “Economic Obstacles to Expanding Intra-African Trade.” World Development 32 (8): 1309–1321. doi:10.1016/j.worlddev.2004.02.006.
- Lyakurwa, W., A. McKay, N. Ng’eno, and W. Kennes. 1997. “Regional Integration in Sub Saharan Africa: A Review of Experiences and Issues.” In Regional Integration and Trade Liberalization in Sub-Saharan Africa, Volume I: Framework, Issues and Methodological Perspectives, edited by A. Oyejide, I. Elbadawi, and P. Collier, 159–209. London: Macmillan.
- Markheim, D. 1994. “A Note on Predicting the Trade Effects of Economic Integration and Other Preferential Trade Agreements: An Assessment.” JCMS: Journal of Common Market Studies 32 (1): 103–110. doi:10.1111/j.1468-5965.1994.tb00487.x.
- Michaely, M. 1996. Trade Preferential Agreements in Latin America: An ex-Ante Assessment (No. 1583). Washington, D.C.: World Bank Publications.
- Mustafa, M. E., M. M. Elshakh, and E. M. Ebaidalla. 2019. “Does Foreign Aid Promote Economic Growth in Sudan? Evidence from ARDL Bounds Testing Analysis.” Journal of Economic Cooperation & Development 40 (3): 115–140. https://jecd.sesric.org/pdf.php?file=ART18091803-2.pdf.
- Ngepah, N., and M. Udeagha. 2018. “African Regional Trade Agreements and Intra-African Trade.” Journal of Economic Integration 33 (1): 1176–1199. doi:10.11130/jei.2018.33.1.1176.
- Osabuohien, E. S., U. R. Efobi, J. T. Odebiyi, O. O. Fayomi, and A. O. Salami. 2019. “Bilateral Trade Performance in West Africa: A Gravity Model Estimation.” African Development Review 31 (1): 1–14. doi:10.1111/1467-8268.12359.
- Pastore, F., A. Ferragina, and G. Giovannetti. 2009. “A Tale of Parallel Integration Processes: A Gravity Analysis of EU Trade with Mediterranean and Central and Eastern European Countries.” Review of Middle East Economics and Finance 5 (2): 21–44. doi:10.2202/1475-3693.1228.
- Patrick, J., and P. McDonald. 2004. “Peace Through Trade or Free Trade?” Journal of Conflict Resolution 48 (4): 547–572. doi:10.1177/0022002704266117.
- Romer, D. 1993. “Openness and Inflation: Theory and Evidence.” The Quarterly Journal of Economics 108 (4): 869–903. doi:10.2307/2118453.
- Salman, S. M. 2016. “The Grand Ethiopian Renaissance Dam: The Road to the Declaration of Principles and the Khartoum Document.” Water International 41 (4): 512–527. doi:10.1080/02508060.2016.1170374.
- Samen, S. 2010. A Primer on Export Diversification: Key Concepts, Theoretical Underpinnings and Empirical Evidence. Washington, D.C: Growth and Crisis Unit World Bank Institute, World Bank.
- Simwaka, K. 2011. “An Empirical Evaluation of Trade Potential in Southern African.” AERC Research Paper, No. 235. African Economic Research Consortium, Nairobi.
- Tawfik, R. 2019. “Beyond the River: Elite Perceptions and Regional Cooperation in the Eastern Nile Basin.” Water Alternatives 12 (2): 655–675. https://www.water-alternatives.org/index.php/alldoc/articles/vol12/v12issue2/497-a12-2-4/file.
- Tinbergen, J. 1962. Shaping the World Economy-Suggestions for an International Economic Policy. New York: The Twentieth Century Fund.
- Vamvakidis, A. 1998. “Regional Integration and Economic Growth.” The World Bank Economic Review 12 (2): 251–270. doi:10.1093/wber/12.2.251.
- Wang, H., and J. Firestone. 2010. “The Analysis of Country-to-Country CDM Permit Trading Using the Gravity Model in International Trade.” Energy for Sustainable Development 14 (1): 6–13. doi:10.1016/j.esd.2009.12.003.
- Winters, L. A., N. McCulloch, and A. McKay. 2004. “Trade Liberalization and Poverty: The Evidence so far.” Journal of Economic Literature 42 (1): 72–115. doi:10.1257/002205104773558056.
- World Bank. 2020. World Development Indicators (Accessed December 16, 2020).
- Yeats, A. 1998. “What Can be Expected from African Trade Arrangements?” International Trade Division, The World Bank. Available on the web at http://www.worldbank.org/html/dec/Publications/Workpapers/wps2000series/wps2004/wps2004-abstract.html.
- Zhang, H. 2017. “Static and Dynamic Gains from Costly Importing of Intermediate Inputs: Evidence from Colombia.” European Economic Review 91: 118–145. doi:10.1016/j.euroecorev.2016.09.013.