?Mathematical formulae have been encoded as MathML and are displayed in this HTML version using MathJax in order to improve their display. Uncheck the box to turn MathJax off. This feature requires Javascript. Click on a formula to zoom.
ABSTRACT
This study explores the link between informality and institutional quality in 48 emerging economies from 2013 to 2018, using partial least squares – structural equation modeling (PLS-SEM). It delves into the role of informality and the poorly understood drivers in these economies. This study models property rights, public fund diversion, and government transparency. This study explores systemic conditions and finds a complex link between weaker institutions and increased informality. The analysis found an association between lower institutional quality and higher levels of informality, aligning with the theory that more robust institutions are linked to fewer informal activities. However, the analysis also indicated that systemic factors have a significant relationship with the degree of informality. Mediation analysis indicated an association between systemic issues, reduced institutional quality, and increased informality. State legitimacy, inequality, and factionalism have been highlighted as potential areas to address in an effort to decrease informality. Enhancing systemic conditions and public fund oversight may be important considerations. A dual approach to institutional and systemic reforms has been suggested. Regional differences indicate a need for further research on context-specific drivers. This exploratory PLS-SEM study offers detailed evidence to aid formalization policies in emerging economies.
1. Introduction
The livelihoods of the impoverished in emerging markets and frontier economies (EMFEs) are frequently highly dependent on informal activity. Statistics show that the informal economy comprises a significant portion of the overall economic activity in emerging and developing countries, often accounting for 25–75% of employment, GDP, and firms (International Labor Organization Citation2021). Beyond employment, informal output is estimated to account for about 35% of GDP in EMFEs compared to 15% in advanced economies (The World Bank Citation2019). Informality is linked to various adverse economic outcomes, including low productivity, limited fiscal resources, increased poverty, and income inequality, despite the benefits of flexible employment in certain situations (Berdiev and Saunoris Citation2019; Docquier, Müller, and Naval Citation2017; Elgin and Birinci Citation2016; Loayza Citation2016; Ohnsorge, Okawa, and Yu Citation2022). Therefore, informality is a crucial factor to consider when developing cyclical and structural policies. However, despite the challenges of measuring the informal sector, the factors that drive it and its consequences still need to be better understood in EMFEs despite their policy relevance.
A complex relationship exists between informality and institutional quality. On the one hand, informality can result from weak institutions and poor governance, as businesses may turn to informality to avoid burdensome regulations and taxes (Dabla-Norris, Gradstein, and Inchauste Citation2008; Loayza, Serven, and Sugawara Citation2009; Schneider and Enste Citation2013). On the other hand, informality can also undermine institutional quality, as it can lead to a lack of protection for workers and consumers, reduce the tax base, and create barriers to economic growth and development (Elgin and Oztunali Citation2014; Schneider and Enste Citation2000). Therefore, addressing informality and improving institutional quality are key challenges for many EMFEs seeking to promote economic development and good governance.
This study examines informality drivers in emerging and frontier economies (EMFEs). The analysis investigates institutional effects on informality across country groupings. The key findings are threefold. First, decreasing systemic conditions raises informality directly and indirectly via institutional quality, totaling 13.25% of the effect. Second, the results confirm the negative relationship between institutional quality and informality. Finally, the importance-performance analysis identifies systemic components as top policy priorities for reducing informality. Addressing systemic deficiencies is critical for formalization policies in EMFEs.
In contrast to prior research, this study offers nuanced evidence of deep-rooted informality’s institutional and systemic drivers by expanding the evidence based on the relationship between informality and institutional factors. PLS-SEM modeling was applied to provide a nuanced understanding of the factors influencing informality. Examining the conditional and indirect effects of systemic factors using mediation analysis and identifying policy priorities via importance-performance analysis.
This paper is organized into several sections. Section 2 introduces and discusses the prevailing literature on informality and approaches to institutional quality, thus providing a theoretical backdrop for the study. Section 3 describes the methodology and data employed in our analysis. Section 4 presents an assessment of the various factors that influence informality and evaluates their impact across the selected sample of economies. Section 5 describes our final thoughts, offering insights and reflections on the subject under investigation. Finally, Section 6 elucidates the contributions and limitations of this study and critically examines the value and potential shortcomings of our research.
2. Literature review and proposals development
North (Citation1986) emphasized the importance of modern economic institutions for economic growth and prosperity. These include a legal system, judicial system to protect property rights and settle disputes, and trading system to reduce firms’ transaction costs. However, many institutions in emerging and developing countries are weak, leading to macroeconomic volatility and negative effects on economic growth and prosperity (Acemoglu Citation2003; Acemoglu and Robinson Citation2012; Hnatkovska and Loayza Citation2005).
The quality of institutions determines the institutional framework, which can be either inclusive or extractive. Inclusive institutions foster inclusive markets, whereas extractive institutions are designed to transfer wealth and income from one group to another (Acemoglu and Robinson Citation2012).
According to Graham and Naim (Citation1998), there are three types of institutional functions. The first is creating rules and laws by institutions such as legislative bodies, government departments, and local councils. The second function is enforcing and implementing these rules, which are performed by institutions such as courts, administrative boards, and regulatory agencies. The third function is the provision of public services, which is the responsibility of institutions to ensure the availability of various types of public goods and services.
Several explanations for institutional quality can be broadly categorized into three groups for analysis (Graham and Naim Citation1998): resource conditions, quantity, quality, and allocation of available resources. Political conditions: related to co-optation, corruption, and politicization in resource allocation. Systemic conditions: related to clarity in setting long-term goals, the concentration of power in economic agents, and external state intervention.
The relationship between informality and institutional factors has been extensively studied. In general, it has been identified that weak institutions are related to higher levels of informality (Dabla-Norris, Gradstein, and Inchauste Citation2008; Torgler and Schneider Citation2009). In addition, institutional quality interacts with factors such as inequality because individuals with limited access to resources may be produced in the informal sector with lower levels of productivity but higher returns (Chong and Gradstein Citation2004; Dell’Anno and Solomon Citation2014). This is consistent with previous studies showing the relationship between informality and tax burden and labor regulations documented by Johnson, Kaufmann, and Zoido (Citation1998) and Schneider and Enste (Citation2000) and the stronger relationship between private contracting institutions and informality reported by Dabla-Norris, Gradstein, and Inchauste (Citation2008). By contrast, Friedman et al. (Citation2000) argue that it is not taxes, as market functioning conditions affect informality, but factors such as corruption are directly linked to institutional quality.
Exploring informality in emerging and frontier economies remains an important research area that reflects the multifaceted impact of informality. Recent studies have revealed the detrimental role of the informal sector in sustainable development in developing countries. Additionally, the inverted-U relationship between informal sector size and GDP growth highlights complex informality-economy interactions. Such findings reinforce the study of informality’s ongoing significance and intricacies, requiring nuanced understanding (Elgin and Birinci Citation2016; Loayza Citation2016; Sultana, Rahman, and Khanam Citation2022).
The impact of informality extends beyond growth and sustainability, and affects management practices, regional variations, and poverty. New frameworks examine informal sector management styles and formal-informal firm links. Regional studies map informality patterns, citing drivers like regulations, human capital, and social protection. Research also finds a complex, bidirectional informality-poverty relationship, with heterogeneous pathways across economies (Bolarinwa and Simatele Citation2023; Ohnsorge, Okawa, and Yu Citation2022; Özgür, Elgin, and Elveren Citation2021; Vorisek et al. Citation2022).
Therefore, we aim to investigate how institutional quality dimensions affect informality. Formality can provide benefits such as contract enforcement and market access. However, burdensome regulations and fees incentivize informality when legal frameworks are onerous and state monitoring is limited (Almenar, Sánchez, and Sapena Citation2020; Dabla-Norris, Gradstein, and Inchauste Citation2008; Loayza, Serven, and Sugawara Citation2009; Schneider and Enste Citation2013; Simonović and Bošković Citation2016). High informality can result from weak institutions, as firms avoid burden and enforcement. This leads to the proposal that greater institutional quality reduces informality by lowering burden and improving state effectiveness. Institutional context shapes firms’ formal–informal tradeoffs. Policies to enhance property rights, contract enforcement, and monitoring could incentivize formalization. The above arguments led to our first proposal.
P1. A higher degree of institutional quality reduces informality.
Individual property rights and property-based capitalism are essential entrepreneurship components. However, when private property is less prevalent or concentrated in a small elite, it becomes more extractive and hinders overall economic growth (Acemoglu and Johnson Citation2003; Acemoglu, Johnson, and Robinson Citation2001). Moreover, the lack of political constraints results in a pattern of captured democracy in which the rules of the game are skewed in favor of the elite (Acemoglu and Robinson Citation2008).
A country’s legal infrastructure, with its ability to resolve disputes and enforce contracts, encourages firms to rely on it (Li Citation2009). According to Kramer (Citation1999), rules are based on the ability to predict institutional actions. ‘At the country level, trust in a country’s laws is reflected in confidence in their country’s legal system’ (Lin and Wang Citation2008; Muethel and Bond Citation2013). Depending on the specific context, rule-based trust is expected to decrease transaction costs, shape strategic organizational decisions, and promote formalization (Araujo and de Souza Citation2010; J. Li et al. Citation2008; Meyer Citation2001; Prado Citation2011; Ulyssea Citation2010). We thus, propose that:
P2. The lack of structural systemic conditions increases informality.
Figure 1. Proposed Model Institutional Quality and Informality. Source: Authors’ elaboration.
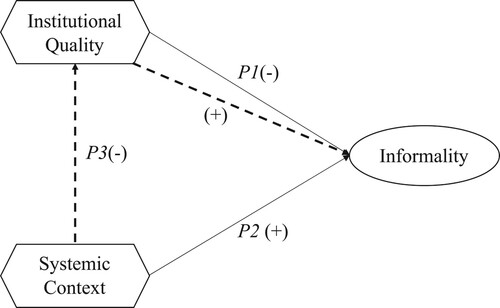
As previously mentioned, the institutional framework is shaped by the quality of the institutions, which can be inclusive or extractive. Extractive economic institutions (i.e. systemic conditions) erode institutional quality, leading to increased informality (Elgin and Oztunali Citation2014; Williamson Citation2009). The dotted line shows the third proposition:
P3. Lack of structural systemic conditions reduces institutional quality and increases informality.
γ represents the path coefficient between the constructs.
ζ is the error term for the structural model.
3. Data and methodology
3.1. Countries
Frontier economies, often considered a subset within the broader category of developing nations, are characterized by smaller, less accessible, and less developed capital markets than are emerging economies. Emerging economies are more stable, accessible, and integrated into the global financial system; frontier economies offer higher growth potential, but come with greater investment risks and market limitations. This distinction is crucial, as emerging economies are more mature and engage in high-value activities, whereas frontier economies are in earlier developmental stages with higher volatility.
This research used a cross-validation of four categorization sources to analyze data from 48 EMFEs, between 2013 and 2018 (see ). These economies have undergone institutional revolutions that have introduced transparent rules for the game that apply equally to all market participants (Buitrago, Torralba Barreto, and Reyes Citation2022).
Table 1. Countries included in this study.
3.2. Data sources
Indicators for institutional quality were extracted from the Global Competitiveness Index (Sala-I-Martin et al. Citation2007). Three key aspects were considered: property rights, public fund diversion, and government transparency.
For the systemic context, the Fragile States Index is used, which measures the pressures a country faces and its capacity to control exogenous pressures (The Fund for Peace Citation2020). State legitimacy, economic inequality, and factionalized elites are the selected indicators.
Informality was measured using an indicator computed using the multiple indicator multiple causes (MIMIC) method. This well-established tool quantifies the size of informal economic activities, including employment levels and productivity within the informal sector (Medina and Schneider Citation2018; Schneider, Buehn, and Montenegro Citation2010).
These varied data sources provide a thorough framework for examining the connections between institutional quality, systemic context, and informality, each chosen for its relevance and reliability in capturing key indicators.
3.3. Indicators and constructs
The three constructs of our proposed model are composite variables measured using multiple indicators. Constructs can be viewed as artifacts or theoretically justifiable human-made creations (Buitrago, Caraballo, and Roldán Citation2019; Henseler Citation2017). The construct’s nature links the indicators to theory. Design constructs are treated as composites, whereas behavioral constructs are typically modeled as common factors. By modeling design constructs as composites, we acknowledge that all artifacts and abstractions consist of more fundamental elements (Henseler Citation2017).
However, according to Sarstedt, Ringle, and Hair (Citation2022), artifacts are especially prevalent when analyzing secondary and archival data, as they lack a comprehensive measurement theory-based justification. Thus, these constructs have been modeled as composites that are linear combinations of their respective manifest variables (Henseler, Hubona, and Ray Citation2016; Kock Citation2019; Sarstedt et al. Citation2020).
As this is an exploratory model, epistemic relationships between concepts, dimensions, and indicators must be specified (Edwards and Bagozzi Citation2000; Hulland Citation1999; Jarvis, Mackenzie, and Podsakoff Citation2003). The nature and direction of the links require conceptual justification prior to the empirical evidence.
Based on the literature review, we assigned the indicators we found relevant and supported by the theory to each construct. shows the constructs, their respective indicators, and the information sources.
Table 2. Constructs, indicators, and sources.
3.4. Method
This study chose structural equation modeling (SEM) because of its ability to simultaneously model all possible paths. For the following reasons, we prefer partial least squares (PLS-SEM) over covariance-based SEM (CB-SEM): (a) it identifies which element can cause the type of effect within the variables under study; (b) it tolerates small samples; (c) it does not require validation of the most robust statistical assumptions, such as normality, homoscedasticity, and non-linearity; (d) statistically, it enables the measurement of correlations; and (e) it uses secondary or archival data (Chung and Liang Citation2020; Hair et al. Citation2017; Citation2019; Kock Citation2019; Palos-Sanchez, Saura, and Ayestaran Citation2021; Rigdon Citation2013; Sarstedt et al. Citation2016). We used Smart-PLS (version 4.0; Ringle, Wende, and Becker Citation2022) for all calculations.
Thus, PLS will allow us to meet various research purposes: (a) explanatory and descriptive, in order to understand relationships between variables and their importance and performance; and (b) exploratory, using secondary data to identify potential links between constructs in different contexts (Hair et al. Citation2021; Henseler Citation2018).
This study employs mediation analysis and Importance-Performance Map Analysis (IPMA) to deepen our understanding of informality determinants. Mediation analysis explores how systemic context indirectly impacts informality via institutional quality. The IPMA guides policy focus by highlighting high-importance, low-performance areas. These techniques collectively unravel the intricate links among systemic issues, institutions, and informality, offering enriched policy insights for emerging economies.
3.5. Model specification
Our model consists of seven indicators (DPF, PR, TGP, EI, FE, SL, and MIMIC) and three latent variables: one exogenous SYS (γ2), and two endogenous INST, INFO (γ1, γ3). Latent variables γ1, γ2 influence γ3, and additionally, γ2 influences γ1, the measurement model is specified as follows:
For Institutional Quality (INST):
For Systemic Conditions (SYS):
For Informality (INFO):
The structural model, which defines the relationships among the latent variables, can be expressed as follows:
Where:
λ represents the factor loading of each indicator on the respective constructs.
γ represents the path coefficient between the constructs.
∈ and ζ are the error terms for the measurement model and the structural model, respectively.
4. Results
The PLS-SEM evaluation was conducted in two steps: measurement model evaluation and structural model evaluation. Using the holdout samples, we assessed the prediction accuracy of the model. In addition, we conducted a mediation analysis of institutional quality. Finally, importance-performance map analysis (IPMA) was conducted to prioritize policy-making actions. All calculations were performed in SmartPLS4 (Ringle, Wende, and Becker Citation2022)
4.1. Measurement model
As suggested by Henseler et al. (Citation2014), we evaluated the model using confirmatory composite analysis to test the composites’ nomological validity (Henseler Citation2017). We used the widely accepted standardized root mean square residual (SRMR) index to validate the model fit criterion. As a result, the proposed model achieves an SRMR value of 0.079, which is less than the 0.08 cutoff value generally accepted (Hu and Bentler Citation1999). With this result, the composite model appears to be supported, and composites appear to act within a nomological net rather than as individual indicators (Buitrago, Caraballo, and Roldán Citation2019; Henseler Citation2017).
We conducted traditional measurements of internal consistency, reliability, and validity (Henseler, Ringle, and Sarstedt Citation2015). The model evaluated the reliability, validity, and accuracy of the results. These metrics are all strongly associated with the structures they are supposed to measure (). The construct indicators scored higher than the cut-off of 0.708, indicating that they all reflected the construct (Busu and Busu Citation2021; Chung and Liang Citation2020; Palos-Sanchez, Saura, and Ayestaran Citation2021). The PLS-SEM analysis results are presented in .
Table 3. Indicators and constructs loadings.
To assess internal consistency, Cronbach’s alpha and Heterotrait-Monotrait Ratio (HTMT) composite reliability were used (Henseler, Ringle, and Sarstedt Citation2015). Cronbach’s Alpha coefficients were greater than the minimum score of 0.7; Rho A also exceeded that value. The composite reliability was over 0.7, and it passed the minimum level of adequacy. This shows consistency within the data. The results of Average Variance Extracted (AVEs) were greater than the suggested minimum of 0.5; see (Busu and Busu Citation2021; Chung and Liang Citation2020; Hair et al. Citation2019; Kock Citation2019; Palos-Sanchez, Saura, and Ayestaran Citation2021).
Table 4. Construct validity and reliability.
Finally, each variable achieved discriminant validity. This is accomplished by employing the Fornell and Larcker (Citation1981) criterion as well as the strictest Heterotrait-Monotrait Ratio (HTMT) of 0.85 (Henseler, Ringle, and Sarstedt Citation2015), as shown in . This means that each variable is distinct from the other variables (; ).
Figure 2. Model’s results. Source: Authors’ elaboration based on the results from SmartPLS4 – See .
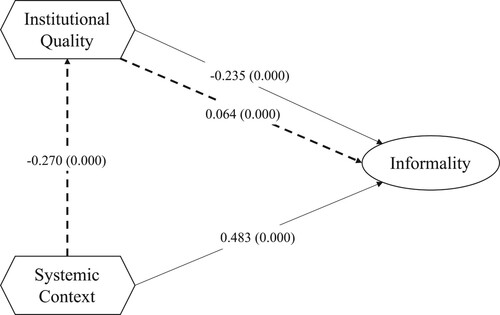
Table 5. Discriminant validity – HTMT – Fornell and Larcker.
Table 6. Path coefficients.
displays the model testing, examining the direct and indirect effects between systemic conditions (SYS), institutional quality (INST) and informality (INFO). As expected, the negative coefficient for the INST -> INFO path (−0.235) indicates that higher institutional quality is associated with lower informality. SYS has a positive total effect on INFO (0.483) but a negative direct effect when controlling for INST as the mediator (−0.270). This change in direction of the SYS → INFO path is consistent with competitive mediation, meaning that SYS ultimately increases INFO, but this effect is masked by mediation through INST.
Table 7. Model testing (Total direct and indirect effects).
Critically, the indirect effect of SYS on INFO through INST is significant (0.064), confirming INST’s mediating role. The indirect effect accounted for 13.25% of the total effect of SYS on INFO. All paths were significant at the p < 0.001 level. The confidence intervals also demonstrated a precise estimation of these effects.
The structural VIF coefficients should not exceed 4.0 in a well-fitting model and less than 5.0 in a more moderate criterion (Garson Citation2016); as shown in , the inner model is well-fitted.
Table 8. Structural VIF coefficients.
4.2. Predictive assessment
Before initiating the PLSpredict procedure, we confirmed that all constructs’ measurement models met the relevant quality standards, as shown in the previous section. Regarding predictive accuracy, the coefficient of determination (R2) and the exogenous constructs (INST, SYS) explain 28% of the endogenous construct INFO, which is considered a low effect (Chin, Citation1998; Henseler and Sarstedt Citation2013). Q2 statistics are used to measure the PLS path model’s quality; this criterion recommends that the conceptual model predict the endogenous constructs. In our model, the value for INFO is 0.227 and for INST is 0.067; values greater than zero for a particular endogenous latent construct are considered relevant (Hair et al. Citation2017). Assessing the effect sizes (f2) showed that the effect size on INFO of INST (0.072) was small and SYS (0.228) was moderate. The effect of SYS on INST (0.079) is small, as shown in (Chin and Dibbern Citation2010; Hair et al. Citation2017).
Table 9. f2 effect sizes.
To understand the PLSpredict results, we first analyzed the endogenous constructs. Once we identified that the Q2predict statistic outperformed the most naïve benchmark (Evermann and Tate Citation2016), we identified the prediction error distribution, which in our model is highly non-symmetric (see ), as stated by (Shmueli et al. Citation2016; Citation2019), the MAE is the more appropriate prediction in this case.
Figure 3. Prediction error distribution. Source: Results from SmartPLS4.
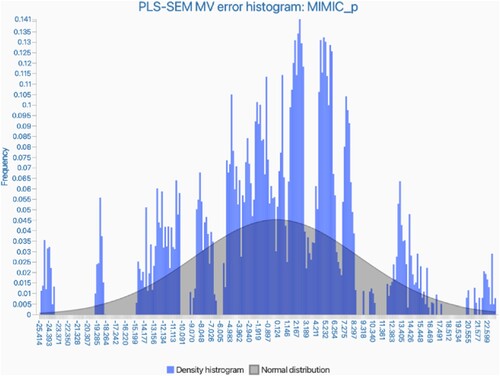
Continuing with the prediction analysis, we compared the indicators and found that most of them were PLS-SEM < LM MAE, which indicates a medium predictive power, as shown in bold in .
Table 10. PLSpredict results.
4.3. Control variables
In a more stable economy, businesses are more inclined to hire legally. The availability of full-time jobs is greater when the economy is expanding than when contracting. When it comes to extracting a larger proportion of resources, the poor are at a disadvantage because of their limited endowments. As a result, they often find it advantageous to shift to the informal sector, where they can keep all of the profits from their work, although they are less productive. There is a positive correlation between inequality and the extent of the informal sector, which is aggravated when institutional quality is inadequate and there is high inequality (Chong and Gradstein Citation2007; Loayza, Serven, and Sugawara Citation2009). Consequently, we decided to control GDP growth (GDPgr) and GDP per capita in the Purchase Power Parity (GDPpc_ppp). presents the results for the controlled model.
Table 11. Model 2 testing (Total direct and indirect effects).
4.4. Mediation analysis
Mediation analysis was performed to assess the mediating role of INST on the linkage between SYS and INFO, as shown in (P3). The results (see ) revealed that the total effect of SYS on INFO was significant (P2: p = 0.000), with a magnitude of −0.270. With the inclusion of the mediating variable (INST), the impact of SYS on INFO remained significant (p = 0.006), but it changed direction. This phenomenon is known as competitive mediation, as explained by Zhao, Lynch, and Chen (Citation2010). The findings on competitive mediation align with the hypothesized model, in which there is an association between poorer systemic conditions, reduced institutional quality, and higher levels of informality.
4.5. Importance-performance map analysis (IPMA)
PLS-SEM’s IPMA compares the mean latent variable scores to total effects, which measures the importance of precursor constructs in shaping a target construct. The goal is to identify precursors that are low-performing but highly important for the target construct, that is, a high total effect (Ringle and Sarstedt Citation2016).
We followed the five steps suggested by Ringle and Sarstedt (Citation2016) to conduct the IPMA analysis: (1) requirement check, (2) computation of the performance values, (3) computation of the importance values, (4) importance–performance map creation, and (5) extension of the IPMA on the indicator level.
In the first step, we rescaled the SYS indicators so that the lowest value represented the worst outcome and the highest value represented the best outcome. We also ensured that all outer weight estimations were positive (see ), and that all indicators in the PLS path model were measured on a metric scale with a consistent orientation. The remaining steps were performed using SmartPLS 4. The results for the complete sample are shown in and and .
Figure 4. IPMA results complete sample. Source: Results from SmartPLS4.
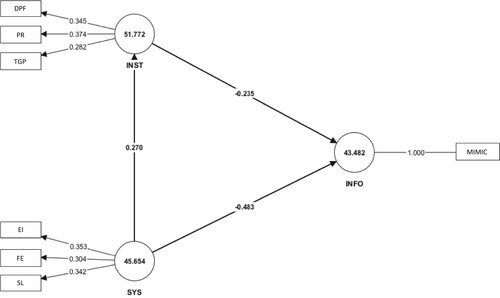
Table 12. Constructs and indicators – Total effects – Complete sample.
Table 13. Constructs and indicators Importance-Performance.
The IPMA method evaluates not only the performance of an item, but also its importance. This analysis aims to determine the (non-standardized) total effect of predecessor construct importance (e.g. INST, SYS) in anticipating a specific target endogenous construct (e.g. INFO).
The total effect reveals the importance of perceptible variables, whereas the mean score (ranging from 0 – lowest to 100 – highest) reflects their performance (Höck, Ringle, and Sarstedt Citation2010). According to the IPMA, a 1-unit increase in the performance of the predecessor (e.g. INST, SYS) increases the performance of the target construct (INFO) by the size of the predecessor’s unstandardized total effect (Ringle and Sarstedt Citation2016). The objective was to determine the significance of each predecessor construct in terms of its total effect (importance) on each target’s endogenous construct (performance).
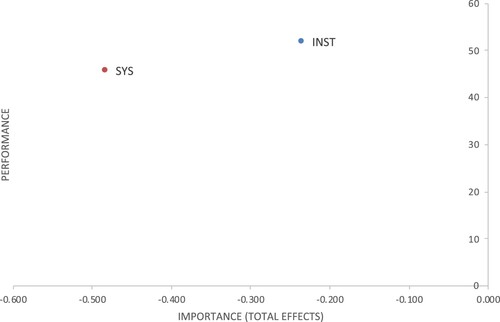
When examining the final target construct INFO, the path coefficient for INST was −0.235, whereas that for SYS was −0.483. The path coefficient, represented by arrows, indicates the relative importance, while the performance values, represented by circles, are the average values of the latent variable scores on a scale from 1 to 100. The closer the score is to 100, the higher the performance of the latent variable.
Because the proposal is better institutional (INST) and systemic (SYS) conditions reduce informality, in is easier to identify that SYS is more important than INST but has lower performance.
Figure 5. Importance-Performance Map. Source: Authors’ elaboration based on the results from SmartPLS4.
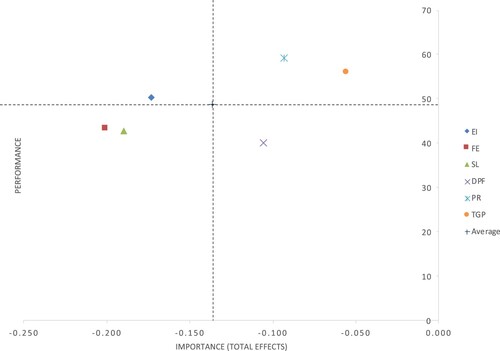
Finally, the IPMA identifies areas requiring improvement at the indicator level. Using outer weights, we gauged the contribution of each indicator to the composite variable. maps the indicators’ importance and performance, divided into four quadrants by mean values. This highlights priority areas needing performance gains to effectively address informality.
Figure 6. Indicators’ Importance-Performance Map. Source: Authors’ elaboration based on the results from SmartPLS4.
Although these are the results for the complete sample, we found diverse behaviors by region (see Appendices 1 and 2). Regional analysis or comparison is not within the scope of this exploratory analysis; these regional differences will be discussed in depth in future studies.
5. Discussion
To understand the connection between informality and institutional quality, it is essential to distinguish between correlation and causation. This study uses PLS-SEM to uncover correlations between these constructs. PLS-SEM is a powerful tool for uncovering intricate interrelations and patterns in data, enabling the modeling of latent constructs and their connections. The current methodology does not prove causality; therefore, the findings are only suggestive of associations and potential causal pathways. This analysis emphasizes the importance of institutional quality in informality and encourages further causal studies.
The estimated coefficients were consistent with the model’s propositions. The path coefficient from institutional quality to informality is −0.235, which is statistically significant (p < 0.001). This negative coefficient aligns with our first proposition (P1) that higher levels of institutional quality, as measured by property rights protection, a lack of public fund diversion, and government transparency, reduce the size of a country’s informal sector. This finding corroborates previous studies showing that strong institutions discourage informal economic activities (Dabla-Norris, Gradstein, and Inchauste Citation2008; Loayza, Serven, and Sugawara Citation2009).
Comparatively, the path from the systemic context to informality has a larger coefficient of 0.419 (p < 0.001), indicating that systemic conditions may play an even greater role than institutional factors in driving informality. This supports our second hypothesis (P2) regarding the impact of state legitimacy, inequality, and factionalized elites.
The analysis found a stronger association between systemic factors and informality levels than between institutional quality and informality. For example, a 1 unit increase in systemic context was associated with a 0.419 unit increase in informality, while a 1 unit increase in institutional quality was associated with a −0.235 unit change in informality. This suggests that systemic conditions such as state legitimacy, inequality, and factionalism may have a greater relationship with the size of the informal sector.
The competitive mediation result is consistent with our proposal (P3) that systemic conditions have an association with informality levels through their relationship with institutional quality. The analysis found associations between poorer institutional quality and higher rates of informal activities. The latter is consistent with Elgin and Oztunali (Citation2014), showing that institutional quality shapes the impact of other factors on informality. Notably, all the estimated parameters are statistically significant. This indirect effect of systemic context on informality corresponds to 13.25% of the total effect.
Our analysis offers insights into informalities in emerging economies. Systemic conditions like state legitimacy and inequality are key drivers, so improving them could reduce informality. Although public fund diversion signals weak institutions, it has the lowest performance, which merits attention. Tackling these systemic and institutional factors may help to reduce entrenched informality.
Regional variations were not the focus but were notable, with differences in how indicators impact informality. Limited and unequal country representation may explain this finding. Further studies on geography-specific drivers are needed. The Appendix illustrates the preliminary regional findings.
6. Contributions and limitations of this study
This study makes several key contributions to the literature on informality. First, it applies quantitative techniques, such as PLS-SEM, mediation analysis, and IPMA, which have been underutilized in this domain. This methodological innovation provides a foundation and benchmark for future modeling-based research on informality. Second, the findings reveal nuanced differences between the impacts of institutional and systemic factors on informality levels. This granularity significantly advances the understanding of the multidimensional drivers of informality.
Third, the analysis highlights institutions’ specific mechanisms for fostering equitable property rights, accountability, and fairness to combat informality. The results elucidate the concrete institutional channels that policies could target for greater formalization. Fourth, the focus on Emerging Markets and Frontier Economies, where informality is most entrenched, provides context-specific insights where they are most needed. Finally, the initial disaggregation of the results by region reveals geographical variations in informality dynamics that warrant future location-specific studies.
However, a longitudinal analysis cannot support definitive causal claims, which would require other methods. The sample covers only 48 countries and is skewed towards certain regions, restricting the generalizability of the findings. Reliance on secondary data risk measurement inconsistencies compared to purpose-built primary indicators. Quantitative relationships should be complemented by qualitative analyses to add nuances and context. The statistical significance testing further validated the IPMA results. Incorporating additional institutional and systemic factors beyond those modeled may reveal supplementary dynamics. Nonetheless, this exploratory analysis provides a starting point for guiding future research and policy.
Disclosure statement
No potential conflict of interest was reported by the author(s).
Additional information
Funding
References
- Acemoglu, D. 2003. “Root Causes.” Finance and Development 40 (2): 26–30.
- Acemoglu, D., and S. Johnson. 2003. “Institutions, Corporate Governance.” Corporate Governance and Capital Flows in a Global Economy 1: 327.
- Acemoglu, D., S. Johnson, and J. A. Robinson. 2001. “The Colonial Origins of Comparative Development: An Empirical Investigation.” The American Economic Review 91 (5): S0022050701228113. https://doi.org/10.1017/S0022050701228113.
- Acemoglu, D., and J. A. Robinson. 2008. “Persistence of Power, Elites, and Institutions.” American Economic Review 98 (1): 267–293.
- Acemoglu, D., and J. A. Robinson. 2012. Why Nations Fail: The Origins of Power, Prosperity and Poverty. New York: Crown Publishers.
- Almenar, V., J. L. Sánchez, and J. Sapena. 2020. “Measuring the Shadow Economy and its Drivers: The Case of Peripheral EMU Countries.” Economic Research-Ekonomska Istrazivanja 33 (1): 2904–2918. https://doi.org/10.1080/1331677X.2019.1706601.
- Araujo, R. A., and N. A. de Souza. 2010. “An Evolutionary Game Theory Approach to the Dynamics of the Labour Market: A Formal and Informal Perspective.” Structural Change and Economic Dynamics 21 (2): 101–110. https://doi.org/10.1016/J.STRUECO.2009.11.002.
- Berdiev, A. N., and J. W. Saunoris. 2019. “On the Relationship between Income Inequality and the Shadow Economy.” Eastern Economic Journal 45 (2): 224–249. https://doi.org/10.1057/S41302-018-0120-Y/TABLES/3.
- Bolarinwa, S. T., and M. Simatele. 2023. “Informality and Poverty in Africa: Which Comes First?” Sustainable Development 31 (3): 1581–1592. https://doi.org/10.1002/SD.2468.
- Buitrago, E. M., M.Á. Caraballo, and J. L. Roldán. 2019. “Do Tolerant Societies Demand Better Institutions?” Social Indicators Research 143 (3): 1161–1184. https://doi.org/10.1007/s11205-018-2002-4.
- Buitrago, R. E., D. R. Torralba Barreto, and G. E. Reyes. 2023. “Are Competitiveness Rankings and Institutional Measures Helping Emerging Economies to Improve?” Competitiveness Review: An International Business Journal 33 (5): 861–888. https://doi.org/10.1108/CR-04-2021-0064.
- Busu, C., and M. Busu. 2021. “Research on the Factors of Competition in the Green Procurement Processes: A Case Study for the Conditions of Romania Using PLS-SEM Methodology.” Mathematics 9 (1): 1–16. https://doi.org/10.3390/math9010016.
- Callais, J. T., I. Jahan, and J. B. Pavlik. 2021. “Institutional Quality and Development: On the Role of Informality.” The Journal of Developing Areas 55 (3): 343–363.
- Chin, W. W. 1998. “The Partial Least Squares Approach to Structural Equation Modeling.” In Modern Methods for Business Research, edited by G. A. Marcoulides, 295–336. New York: Lawrence Erlbaum Associates.
- Chin, W. W., and J. Dibbern. 2010. “An Introduction to a Permutation Based Procedure for Multi-Group PLS Analysis: Results of Tests of Differences on Simulated Data and a Cross Cultural Analysis of the Sourcing of Information System Services Between Germany and the USA.” In Handbook of Partial Least Squares, 171–193. Springer Berlin Heidelberg. https://doi.org/10.1007/978-3-540-32827-8_8
- Chong, A., and M. Gradstein. 2004. Inequality, Institutions, and Informality (Issue Working Paper, No. 516).
- Chong, A., and M. Gradstein. 2007. “Inequality and Informality.” Journal of Public Economics 91 (1–2): 159–179. https://doi.org/10.1016/j.jpubeco.2006.08.001.
- Chung, K. C., and S. W. J. Liang. 2020. “Understanding Factors Affecting Innovation Resistance of Mobile Payments in Taiwan: An Integrative Perspective.” Mathematics 8 (10): 1–18. https://doi.org/10.3390/math8101841.
- Dabla-Norris, E., M. Gradstein, and G. Inchauste. 2008. “What Causes Firms to Hide Output? The Determinants of Informality.” Journal of Development Economics 85 (1–2): 1–27. https://doi.org/10.1016/j.jdeveco.2006.05.007.
- Dell’Anno, R., and H. O. Solomon. 2014. “Informality, Inequality, and ICT in Transition Economies.” Eastern European Economics 52 (5): 3–31.
- Docquier, F., T. Müller, and J. Naval. 2017. “Informality and Long-Run Growth.” Scandinavian Journal of Economics 119 (4): 1040–1085. https://doi.org/10.1111/SJOE.12185.
- Edwards, J. R., and R. P. Bagozzi. 2000. “On the Nature and Direction of Relationships Between Constructs and Measures.” Psychological Methods 5: 155–174.
- Elgin, C., and S. Birinci. 2016. “Growth and Informality: A Comprehensive Panel Data Analysis.” Journal of Applied Economics 19 (2): 271–292. https://doi.org/10.1016/S1514-0326(16)30011-3.
- Elgin, C., M. A. Kose, F. Ohnsorge, and S. Yu. 2021. Understanding Informality (No. 76; CAMA Working Paper).
- Elgin, C., and O. Oztunali. 2014. “Institutions, Informal Economy, and Economic Development.” Emerging Markets Finance and Trade 50 (4): 145–162.
- Evermann, J., and M. Tate. 2016. “Assessing the Predictive Performance of Structural Equation Model Estimators.” Journal of Business Research 69 (10): 4565–4582. https://doi.org/10.1016/J.JBUSRES.2016.03.050.
- Fornell, C., and D. F. Larcker. 1981. “Evaluating Structural Equation Models with Unobservable Variables and Measurement Error.” Journal of Marketing Research 18 (1): 39. https://doi.org/10.2307/3151312.
- Friedman, E., S. Johnson, D. Kaufmann, and P. Zoido-Lobaton. 2000. “Dodging the Grabbing Hand: The Determinants of Unofficial Activity in 69 Countries.” Journal of Public Economics 76 (3): 459–493. https://doi.org/10.1016/S0047-2727(99)00093-6.
- The Fund for Peace. 2020. Fragile States Index. Fragile States Index. https://fragilestatesindex.org/
- Garson, G. D. 2016. Partial Least Squares: Regression & Structural Equation Models.
- Graham, C., and M. Naim. 1998. “The Political Economy of Institutional Reform in Latin America.” In Beyon Tradeoffs - Market Reforms and Equitable Growth in Latin America, edited by N. Birdsall, C. Graham, and R. H. Sabot, 321–362. Washington: Inter-American Development Bank; Brookings institution Press.
- Hair, J. F., C. B. Astrachan, O. I. Moisescu, L. Radomir, M. Sarstedt, S. Vaithilingam, and C. M. Ringle. 2021. “Executing and Interpreting Applications of PLS-SEM: Updates for Family Business Researchers.” Journal of Family Business Strategy 12 (3): 100392. https://doi.org/10.1016/j.jfbs.2020.100392.
- Hair, J. F., G. T. Hult, C. Ringle, and M. Sarstedt. 2017. A Primer on Partial Least Squares Structural Equation Modeling (PLS-SEM). Los Angeles, CA: Sage Publications, Inc.
- Hair, J. F., J. J. Risher, M. Sarstedt, and C. M. Ringle. 2019. “When to Use and How to Report the Results of PLS-SEM.” European Business Review 31 (1): 2–24. https://doi.org/10.1108/EBR-11-2018-0203.
- Henseler, J. 2017. “Bridging Design and Behavioral Research with Variance-Based Structural Equation Modeling.” Journal of Advertising 46 (1): 178–192. https://doi.org/10.1080/00913367.2017.1281780.
- Henseler, J. 2018. “Partial Least Squares Path Modeling: Quo Vadis?” Quality and Quantity 52 (1): 1–8. https://doi.org/10.1007/s11135-018-0689-6.
- Henseler, J., T. K. Dijkstra, M. Sarstedt, C. M. Ringle, A. Diamantopoulos, D. W. Straub, D. J. Ketchen, J. F. Hair, G. T. M. Hult, and R. J. Calantone. 2014. “Common Beliefs and Reality About PLS: Comments on Rönkkö and Evermann (2013).” Organizational Research Methods 17 (2): 182–209. https://doi.org/10.1177/1094428114526928.
- Henseler, J., G. Hubona, and P. A. Ray. 2016. “Using PLS Path Modeling in New Technology Research: Updated Guidelines.” Industrial Management and Data Systems 116 (1): 2–20. https://doi.org/10.1108/IMDS-09-2015-0382.
- Henseler, J., C. M. Ringle, and M. Sarstedt. 2015. “A New Criterion for Assessing Discriminant Validity in Variance-Based Structural Equation Modeling.” Journal of the Academy of Marketing Science 43 (1): 115–135. https://doi.org/10.1007/s11747-014-0403-8.
- Henseler, J., and M. Sarstedt. 2013. “Goodness-of-Fit Indices for Partial Least Squares Path Modeling.” Computational Statistics 28 (2): 565–580. https://doi.org/10.1007/s00180-012-0317-1.
- Hnatkovska, V., and N. Loayza. 2005. “Volatility and Growth.” In Managing Economic Volatility and Crises: A Practitioner’s Guide, edited by J. Aizenman and B. Pinto, 65–100. New York: Cambridge University Press. https://doi.org/10.1017/CBO9780511510755.005
- Höck, C., C. M. Ringle, and M. Sarstedt. 2010. “Management of Multi-Purpose Stadiums: Importance and Performance Measurement of Service Interfaces.” International Journal of Services, Technology and Management 14 (2–3): 188–207. https://doi.org/10.1504/IJSTM.2010.034327.
- Hu, L., and P. M. Bentler. 1999. “Cutoff Criteria for Fit Indexes in Covariance Structure Analysis: Conventional Criteria Versus New Alternatives.” Structural Equation Modeling: A Multidisciplinary Journal 6 (1): 1–55. https://doi.org/10.1080/10705519909540118.
- Hulland, J. 1999. “Use of PLS in Strategic Management Research: A Review of Four Recent Studies.” Strategic Management Journal 20: 195–203.
- International Labor Organization. 2021. World Employment and Social Outlook - Trends 2021. Geneva: International Labour Organization.
- International Monetary Fund. 2020. Emerging Market and Developing Economies. Fiscal Monitor - Country Groupings. https://data.imf.org/?sk=56B58DF4-F431-424C-93EC-77D2AD5BC55E&sId=1415831394526.
- Jarvis, C. B., S. B. Mackenzie, and P. M. Podsakoff. 2003. “A Critical Review of Construct Indicators and Measurement Model Misspecification in Marketing and Consumer Research.” Journal of Consumer Research 30: 199–218.
- Johnson, S., D. Kaufmann, and P. Zoido. 1998. “Regulatory Discretion and the Unofficial Economy.” The American Economic Review 88 (2): 387–392.
- Kock, N. 2019. “Factor-Based Structural Equation Modeling with WarpPLS.” Australasian Marketing Journal (AMJ) 27 (1): 57–63. https://doi.org/10.1016/j.ausmj.2018.12.002.
- Kramer, R. M. 1999. “Trust and Distrust in Organizations: Emerging Perspectives, Enduring Questions.” Annual Review of Psychology, https://doi.org/10.1146/annurev.psych.50.1.569.
- Li, S. 2009. “Managing International Business in Relation-Based Versus Rule-Based Countries.” In Managing International Business in Relation-Based Versus Rule-Based Countries. https://doi.org/10.4128/9781606490853
- Li, J., J. Moy, K. Lam, and W. L. Chris Chu. 2008. “Institutional Pillars and Corruption at the Societal Level.” Journal of Business Ethics. https://doi.org/10.1007/s10551-007-9622-y.
- Lin, X., and C. L. Wang. 2008. “Enforcement and Performance: The Role of Ownership, Legalism and Trust in International Joint Ventures.” Journal of World Business, https://doi.org/10.1016/j.jwb.2007.11.005.
- Loayza, N. V. 2016. “Informality in the Process of Development and Growth.” The World Economy 39 (12): 1856–1916. https://doi.org/10.1111/TWEC.12480.
- Loayza, N. V., L. Serven, and N. Sugawara. 2009. “Informality In Latin America And The Caribbean.” In Policy Research Working Papers (No. 4888). The World Bank. https://doi.org/10.1596/1813-9450-4888
- Medina, L., and F. Schneider. 2018. “Shadow Economies Around the World: What Did We Learn Over the Last 20 Years?” In IMF Working Papers. https://doi.org/10.1109/MCOM.2008.4473089.
- Meyer, K. E. 2001. “Institutions, Transaction Costs, and Entry Mode Choice in Eastern Europe.” Journal of International Business Studies 32 (2): 357–367.
- Morgan Stanley Capital International. 2020. The MSCI Market Classification. https://www.msci.com/market-classification.
- Muethel, M., and M. H. Bond. 2013. “National Context and Individual Employees’ Trust of the Out-Group: The Role of Societal Trust.” Journal of International Business Studies, https://doi.org/10.1057/jibs.2013.9.
- North, D. C. 1986. “The New Institutional Economics.” Journal of Institutional and Theoretical Economics (JITE) 142 (1): 230–237.
- Ohnsorge, F., Y. Okawa, and S. Yu. 2022. “Lagging Behind: Informality and Development.” In The Long Shadow of Informality: Challenges and Policies, 123–204. The World Bank. https://doi.org/10.1596/978-1-4648-1753-3_CH4
- Özgür, G., C. Elgin, and A. Y. Elveren. 2021. “Is Informality a Barrier to Sustainable Development?” Sustainable Development 29 (1): 45–65. https://doi.org/10.1002/SD.2130.
- Palos-Sanchez, P., J. R. Saura, and R. Ayestaran. 2021. “An Exploratory Approach to the Adoption Process of Bitcoin by Business Executives.” Mathematics 9 (4): 355. https://doi.org/10.3390/math9040355.
- Prado, M. 2011. “Government Policy in the Formal and Informal Sectors.” European Economic Review 55 (8): 1120–1136. https://doi.org/10.1016/J.EUROECOREV.2011.04.010.
- Rigdon, E. E. 2013. “Partial Least Squares Path Modeling.” In Structural Equation Modeling: A Second Course, edited by G. R. Hancock, and R. O. Mueller, 2nd ed., 81–116. Charlotte, NC: Information Age Publishing.
- Ringle, C. M., and M. Sarstedt. 2016. “Gain More Insight from Your PLS-SEM Results the Importance-Performance map Analysis.” Industrial Management and Data Systems 116 (9): 1865–1886. https://doi.org/10.1108/IMDS-10-2015-0449.
- Ringle, C. M., S. Wende, and J.-M. Becker. 2022. SmartPLS 4.
- Sala-I-Martin, X., J. Blanke, M. Drzeniek, H. Thierry Geiger, I. Mia, and F. Paua. 2007. “The Global Competitiveness Index: Measuring the Productive Potential of Nations.” In The Global Competitiveness Report 2007–2008, edited by M. E. Porter, K. Schwab, and X. Sala-i-Martın, 3–40. World Economic Forum.
- Sarstedt, M., J. F. Hair, C. Nitzl, C. M. Ringle, and M. C. Howard. 2020. “Beyond a Tandem Analysis of SEM and PROCESS: Use of PLS-SEM for Mediation Analyses!.” International Journal of Market Research 62 (3): 288–299. https://doi.org/10.1177/1470785320915686.
- Sarstedt, M., J. F. Hair, C. M. Ringle, K. O. Thiele, and S. P. Gudergan. 2016. “Estimation Issues with PLS and CBSEM: Where the Bias Lies!.” Journal of Business Research 69 (10): 3998–4010. https://doi.org/10.1016/J.JBUSRES.2016.06.007.
- Sarstedt, M., C. M. Ringle, and J. F. Hair. 2022. “Partial Least Squares Structural Equation Modeling.” In Handbook of Market Research, edited by C. Homburg, M. Klarmann, and A. Vomberg, 588–632. Cham: Springer Nature.
- Schneider, F., A. Buehn, and C. E. Montenegro. 2010. Shadow Economies All over the World :New Estimates for 162 Countries from 1999 to 2007 (WPS 5356).
- Schneider, F., and D. H. Enste. 2000. “Shadow Economies: Size, Causes, and Consequences.” Journal of Economic Literature 38 (1): 77–114.
- Schneider, F., and D. H. Enste. 2013. The Shadow Economy - An International Survey. 2nd ed. New York: Cambridge University Press.
- Shmueli, G., S. Ray, J. M. Velasquez Estrada, and S. B. Chatla. 2016. “The Elephant in the Room: Predictive Performance of PLS Models.” Journal of Business Research 69 (10): 4552–4564. https://doi.org/10.1016/J.JBUSRES.2016.03.049.
- Shmueli, G., M. Sarstedt, J. F. Hair, J. H. Cheah, H. Ting, S. Vaithilingam, and C. M. Ringle. 2019. “Predictive Model Assessment in PLS-SEM: Guidelines for Using PLSpredict.” European Journal of Marketing 53 (11): 2322–2347. https://doi.org/10.1108/EJM-02-2019-0189.
- Simonović, B., and G. Bošković. 2016. “Symbiosis of Politics, the Shadow Economy, Corruption, and Organized Crime in the Territory of the Western Balkans: The Case of the Republic of Serbia.” In Corruption, Fraud, Organized Crime, and the Shadow Economy, edited by M. Edelbacher, P. C. Kratcoski, and B. Dobovšek, 111–124. Boca Raton, FL: CRC Press.
- Standard & Poors. 2020. Emerging Markets Focus Series. https://www.spglobal.com/ratings/en/research-insights/topics/emerging-markets-focus.
- Sultana, N., M. M. Rahman, and R. Khanam. 2022. “The Effect of the Informal Sector on Sustainable Development: Evidence from Developing Countries.” Business Strategy and Development 5 (4): 437–451. https://doi.org/10.1002/BSD2.217.
- Torgler, B., and F. Schneider. 2009. “The Impact of Tax Morale and Institutional Quality on the Shadow Economy.” Journal of Economic Psychology 30 (2): 228–245. https://doi.org/10.1016/J.JOEP.2008.08.004.
- Ulyssea, G. 2010. “Regulation of Entry, Labor Market Institutions and the Informal Sector.” Journal of Development Economics 91 (1): 87–99. https://doi.org/10.1016/J.JDEVECO.2009.07.001.
- Vorisek, D., G. Kindberg-Hanlon, W. C. Koh, Y. Okawa, T. Taskin, E. Vashakmadze, and L. S. Ye. 2022. “Informality in Emerging Market and Developing Economies: Regional Dimensions.” In The Long Shadow of Informality: Challenges and Policies, edited by F. Ohnsorge and S. Yu, 205–254. The World Bank. https://doi.org/10.1596/978-1-4648-1753-3_ch5
- Williamson, C. R. 2009. “Informal Institutions Rule: Institutional Arrangements and Economic Performance.” Public Choice 139 (3–4): 371–387. https://doi.org/10.1007/s11127-009-9399-x.
- The World Bank. 2019. “Global Economic Prospects, January 2019.” In Global Economic Prospects, January 2019: Darkening Skies. Washington, DC: World Bank. https://doi.org/10.1596/978-1-4648-1343-6
- Zhao, X., J. G. Lynch, and Q. Chen. 2010. “Reconsidering Baron and Kenny: Myths and Truths About Mediation Analysis.” Journal of Consumer Research 37 (2): 197–206. https://doi.org/10.1086/651257.
Appendices
Appendix 1: IPMA by region – Constructs
Appendix 2: IPMA by región – Indicators