
 ?Mathematical formulae have been encoded as MathML and are displayed in this HTML version using MathJax in order to improve their display. Uncheck the box to turn MathJax off. This feature requires Javascript. Click on a formula to zoom.
Abstract
Social sciences are facing a crisis of replicability, and concerns about the confidence in quantitative findings have resulted in an increasing interest in open science practices across many fields. In this article we introduce scholars of (digital) journalism studies and communication science to multiverse analysis while addressing the possible reasons of heterogeneity in the findings of research on engagement with news on social media. Using the question of which news article characteristics predict news engagement on social media, this illustration of the multiverse approach shows how different measurement, data processing, and modelling choices lead to divergent conclusions. In particular, we show how the selection of widely used automated text analysis tools and preprocessing steps influence the conclusions drawn from the analysis. We also use this illustration to guide interested scholars through the different steps of doing a multiverse analysis. More broadly, we demonstrate how multiverse analysis can be an open and transparent research approach in a field that is increasingly faced with a wide range of analytical choices.
Introduction
In recent years, computational tools have become commonly applied in (digital) journalism studies and communication research. With the increasing availability of digital data sources and accessibility of computational tools, the creative use and substantive application of computational approaches has spread vastly (Boumans and Trilling Citation2016; van Atteveldt and Peng Citation2018). In particular, recent scholarship in the area of digital journalism and social media research saw a substantial increase in the use of such approaches (e.g. Chorley and Mottershead Citation2016; Trilling, Tolochko, and Burscher Citation2017; Guo Citation2019; Choi, Shin, and Kang Citation2021). While this development has brought about many new and innovative opportunities for addressing the field’s longstanding questions while generating new empirical insights (for an overview see e.g. Boumans and Trilling Citation2016; van Atteveldt et al. Citation2019), some scholars have started to warn about the blind or unreflective use of computational tools and the options these open up (Boukes et al. Citation2020; van Atteveldt, van der Velden, and Boukes Citation2021). The ready-made nature of many toolkits and ever-increasing availability of options and tools arguably may lead to a blind and uncritical application, and the nature of the outcomes of computational routines often shadow the questions of the validity of tools and approaches (e.g. Song et al. Citation2020; Chan et al. Citation2021). This ultimately raises questions regarding the credibility and robustness of evidence produced in research activities.
Lately, open science practices like preregistration and pre-analysis plans became increasingly popular in the social sciences to address this credibility crisis, also in the field of communication (see, for instance, Bowman and Keene 2018; Dienlin et al. Citation2021). A recent popularization of such open science practices was originally sparked as a methodological reform motivated by a surprisingly low level of reproducibility of many foundational studies (Open Science Collaboration Citation2015) and prevalence of questionable research practices across various social science domains (e.g. John, Loewenstein, and Prelec Citation2012; Matthes et al. Citation2015; Bakker et al. Citation2021). As a result, this now-recommended practice of preregistering hypotheses, methods, and analytic plans generally aims to increase research transparency (and therefore to increase credibility) by limiting a researcher’s degree of freedom and arbitrary choices during data collection, data preprocessing, and analytic procedures (Markowitz, Song, and Taylor Citation2021).
While these practices have mainly been used for experimental studies (for instance, see Matthes et al. Citation2015), they can also be used to register methodological approaches and hypotheses beforehand when working with observational data. However, even with best intentions, a researcher is left with many, often arbitrary yet plausible analytical choices along the data processing path once raw data have been collected. This is arguably even more the case when it comes to dealing with computational approaches to textual data, which many of the (digital) journalism and communication scholars use to classify themes or sentiments, code and measure genres and styles, or extract and analyze frames in news and speeches. Typically, in this process every step from research design via data collection, preprocessing, analysis to reporting of results requires taking nontrivial (yet often equally plausible and justifiable) decisions among a multitude of options – hence, a great range of researcher degrees of freedom (Simmons, Nelson, and Simonsohn Citation2011). While researchers typically understand the possible multiplicity of their data preprocessing and analytical choices in a theoretical sense, there is little acknowledgment of these possibilities in actual research practice, especially in a sense that statistical conclusions one can draw from the data are largely a direct function of the particular methodological choices and modeling assumptions made on data (Gelman and Loken Citation2014; Silberzahn et al. Citation2018). Yet the reporting of only a small subset of models out of all possible, equally plausible sets of processing steps and analytical procedures – called a “multiverse” of reasonable datasets and analytical decisions – increases the chance of false positive findings even without researchers’ malintention to “fish” statistical significance from their data to support their theoretical statements.
Against this backdrop, there is a growing appreciation that explicitly considering all possible alternative combinations of data sampling, preprocessing, and modeling choices – called a “multiverse approach” – would improve the credibility and robustness of statistical evidence we, as social scientists, collectively produce (Steegen et al. Citation2016). The multiverse approach specifies all analytical choices upfront and makes them explicit, and then runs analyses on all combinations of data processing and modelling paths. It therefore quantifies the degree to which variations in data selection, preprocessing and cleaning, and/or coding choices as well as the selection of statistical models influence the statistical results. To date, only a few studies using observational data are conducting multiverse analyses (e.g. Burton, Cruz, and Hahn Citation2021; Saraceno, Hansen, and Treul Citation2021; Pipal et al. 2022). In this article, we aim to encourage more researchers to consider and adopt a multiverse approach to address analytical (as well as evidential) ambiguities when applying text analysis in the social sciences. Equally important, adopting multiverse approaches in text analysis may help shed more conclusive light on areas of research that have tended to produce inconsistent, and sometimes contradictory findings regarding identical research questions and hypotheses.
One such area for which we here introduce and illustrate the multiverse approach regards the issue of “shareworthiness” of online news on social media (Trilling, Tolochko, and Burscher Citation2017). Recently, social media have become a dominant force in the distribution of news. News organizations adapt to social media-based distribution logics (Tandoc and Vos Citation2016; Welbers and Opgenhaffen Citation2019), while news users frequently encounter (Gil de Zúñiga, Weeks, and Ardèvol-Abreu Citation2017), react to (Salgado and Bobba Citation2019) and share (Kümpel, Karnowski, and Keyling Citation2015) news on social media. The past decade saw an explosion in studies investigating the relationships between news and social media, looking at the characteristics of news producers, users, news items, or of networks that lead to user engagement (Kümpel, Karnowski, and Keyling Citation2015). However, in relation to the question how news content characteristics explain social media user engagement in the form of reactions and sharing practices, research so far has produced largely inconsistent results. Some highlights and confirms the role of traditional news values (e.g. Trilling, Tolochko, and Burscher Citation2017; García-Perdomo et al. Citation2018) while others, for instance, find only a neglectable role of news values (e.g. Salgado and Bobba Citation2019; Kilgo, Lough, and Riedl Citation2020). We believe and will show that such inconsistency may rest on key methodological differences in data processing and analysis. We show that a multiverse approach is capable of providing a clearer assessment of the role of researcher’s degrees of freedom, addressing the possible reasons of heterogeneity in the findings of research on engagement with news on social media.
The explicit goal of our contribution is to introduce the multiverse approach to journalism and communication studies, and illustrating its usefulness by critically reassessing the main contributions and empirical insights from extant literature on online news and social media engagement. In other words, we investigate whether and to what degree findings and dominant empirical perspectives are supported through a multiverse approach or whether a critical reassessment of the mechanisms is in place. In doing so, we focus on three main categories of analytical choices a researcher faces that have been considered in previous multiverse applications: (1) variables (selection, operationalisation), (2) case selection and exclusion, and (3) modelling (functional form, choice of controls). In addition, we include (4) text preprocessing and the selection of computational text analysis tools as an additional challenge for the robustness of results in text-as-data projects. Our multiverse application to the issue of online news engagement on social media highlights that these analytical choices can indeed lead to diverging conclusions, providing a more principled assessment of the underlying factors predicting news engagement.
Multiverse Analyses
Researchers face a series of analytical choices when constructing their final dataset from raw data. Typically, researchers must decide what variables they want to include in their statistical model, which observations to include, or what variables to control for. They often also need to decide how a measure is turned into a variable. For instance, when measuring and quantifying the extent of users’ social media news engagements, various operational strategies exist – such as coding and classifying urls and sources that one visited (e.g. Guess, Nyhan, and Reifler Citation2020), looking at exposure frequencies or durations (e.g. Diehl, Weeks, and Gil De Zúñiga Citation2016), or simply taking “engagement metrics” provided by the platform (such as likes, reactions, shares: e.g. Stroud and Muddiman (Citation2019)), to only name a few. Often this process of constructing datasets from measurements and of building statistical models from the theoretical model is guided by theory or available measurements – yet, arguably, it is also often the case that any of these choices are arbitrary. By “arbitrary” we do not mean that these choices are wrong, but that they are all equally valid and defensible options. Given the often large number of equally valid final datasets, it is to be expected that at least some of them would lead towards a statistically significant finding. Ideally, a researcher would make sure that the analytical path(s) reported in their published study are representative of the entire set of equally plausible and valid analyses. Unfortunately, often this is not the case, and results reported in a published study are silent about alternative specifications (Lenz and Sahn Citation2021). We want to make clear that this issue is different from questionable research practices like HARKing or p-hacking, as these choices are necessarily made during the research process. But they can, ultimately, reflect the various biases of a researcher (Simmons, Nelson, and Simonsohn Citation2011; Simonsohn, Simmons, and Nelson Citation2020).
How can this problem be mitigated? Increasingly common open science practices like preregistration or the provision of full datasets and replication code are unlikely to fully solve this issue. Even if a preregistration recorded all details of the analysis, the published study would not tell anything about how well reported findings are representative of all possible ways the data could have been handled. Instead of hiding them in the researcher’s file drawer, however, all reasonable options of how the data could be processed and modelled can be laid out. This is called the multiverse of datasets (Steegen et al. Citation2016), which makes all these choices explicit. That is, instead of running just one or a handful of analyses, a researcher runs all analyses using each instance of the multiverse. By reporting the distribution of results across all multiverse specifications, the researcher and the readers of the published study get a sense of how much these usually unreported choices add noise to the findings. Furthermore, reporting all possible results allows a researcher to reflect on their choices. Do the conclusions drawn from the results nontrivially change depending on which options were chosen? Do some analytical paths systematically lead to significant results, while others do not? And – possibly even more worrying – do some effects change direction when one takes a different route? What separates a multiverse analysis from a more traditional approach that includes the reporting of – ultimately selective – robustness checks is the underlying goal: robustness checks are performed post hoc in order to show that conclusions drawn from the analysis hold amid alternative specifications, while a multiverse analysis is explicitly open about the uncertainty introduced by equally reasonable analytical choices. In the remainder of this article, we illustrate how the multiverse approach can be used in an empirical study. Our illustration is centered around the following four larger questions quantitative researchers often face in their daily research practice:
How are raw data transformed into variables? In many cases, the measures included in a dataset do not directly reflect a researcher’s quantity of interest. For instance, a researcher might be interested in constructing a scale from several measurements to capture the effect of a latent construct. In other cases, it is necessary to choose a cutoff point to classify cases based on a continuous measure such as age, time, or exposure to a treatment. Often such cut-off points are arbitrary. The multiverse approach makes the influence of these measurement choices visible.
What cases or subgroups are analyzed? Hypotheses often concern only a subgroup of cases in a dataset. For instance, research on theories on the role of media in various media systems requires us to decide whether a country follows (for instance) a corporatist model or not, and we typically use several criteria if a case should be included or not. However, often there is not a single gold standard for making these decisions. The same is true for the exclusion of outliers. Practices of excluding unusual observations differ between research traditions and fields, leaving us with arbitrary choices to make. The multiverse approach is transparent about these case selection and exclusion choices.
How are our data modelled? Depending on the type of data used, researchers have to decide how to model the relationships between their variables of interest and their outcome variable(s). These decisions concern the model family and the choice of controls. For instance, when dealing with a binary outcome variable, researchers can opt to use linear probability models, probit models, or logit models. Often researchers choose the models they are most familiar with, and differences between what models are considered appropriate for a given dataset also vary between research fields and communities. Regarding model specification, the inclusion of control variables can be very consequential for the conclusions drawn from the analysis. In their analysis of articles published in a major political science journal, Lenz and Sahn (Citation2021) find that about 40% of reported significant results only became significant after adding control variables. However, none of the authors offered a theoretical justification why a certain control was added to a model. We, therefore, distinguish between control variables with and without theoretical expectations. Theoretically necessary control variables should always be included in the multiverse of models. Other control variables should be included and excluded in different specifications of the multiverse. This way, the multiverse approach shows how modelling choices affect the outcome of the analysis.
What additional challenges arise when working with text data? This article is, to our knowledge, the first to highlight the additional benefits of multiverse analyses in text as data projects. This is of particular relevance for researchers working in the fields of journalism studies and communication.
Many of the theoretical assumptions and the empirical tests thereof in journalism studies and communication rest on knowledge about the contents of and dynamic interrelations between texts of various kinds. Typically, these textual elements found in news and speeches serve as a bearer of some latent, abstract constructs – yet due to their abstract and latent nature, there exists no straightforward and unambiguous way of operationalizing and quantifying them (Kantner and Overbeck Citation2020). This puts the issue of measurement validity and reliability of such latent constructs in textual elements a rather serious concern in many journalism and communication studies (Baden et al. Citation2021). Yet without suitable theoretical guidance to start with, the often-standard reaction of individual researchers employing a text-as-data approach is to try and cross-reference various operational strategies – naturally creating the problem of “multitude of choices” (Kirtley et al. Citation2021, p. 2) or a “garden of forking paths” (Gelman and Loken Citation2014, p. 10). This was not really a noticeable issue for manual content-analytic applications due to their laboriousness and time/cost-efficiency concerns in creating various alternative measurement strategies and empirical specifications. However, the range of computational tools offered to social scientists that has grown extensively over the past decade brought a new concern for this possibility. That is, using these tools with usually unstructured textual data comes with an additional amount of analytical flexibility regarding data processing, data cleaning, and the measurement of latent constructs. While researcher degrees of freedom also exist at every step of the research process in, for instance, traditional survey research, textual data introduces a multitude of analytical paths early on. For instance, many of the off-the-shelf tools for text-as-data applications are easy to use and can be readily applied to measure various variables of interest in text and speeches. Sometimes these tools are used with little to no thought about their validity for a given dataset. For instance, many widely used tools for sentiment analysis have been developed by psychologists to measure emotions in free-form writing (such as in product reviews and micro blogs) in the form of pre-defined lexicons (e.g. Tausczik and Pennebaker Citation2010), yet they are often conveniently used to measure complex latent constructs in highly structured news articles and speeches despite the content-dependent nature of the tools (Puschmann and Powell Citation2018; Pipal, Schoonvelde, and Schumacher 2022). Different tools embody different methodological assumptions and particular contexts within which they are initially developed from, leading to diverging consequences across different tools. The multiverse approach makes explicit how results change depending on the chosen tool.
In addition, raw texts have to be processed to be analyzed by social scientists, and researchers have to decide how the text data should be handled: Should they base their analysis on single words or bi-grams? Should they remove very frequent words from their texts? Should they reduce words to their grammatical word stems? These are just some of the most common options when processing text data (Grimmer and Stewart Citation2013). Some of these choices can have considerable consequences for the measurement of the variables of interest. Especially when working with unsupervised methods such as topic models or latent scale models, these text processing decisions can lead to diverging results (Denny and Spirling Citation2018). When we do not have a theoretical reason to choose a particular set of processing options, the multiverse approach allows us to determine how much our results depend on them.
Having outlined four major components of the multiverse approach, we now move to an empirical application, where we show how the choice of data processing and analysis steps indeed greatly influences study outcomes and their interpretation.
Application: Understanding News Engagement on Social Media
To introduce the multiverse approach as sketched above and to illustrate its use and potential, we address a research question that has received much attention in the study of digital news and social media over the last decade and that has produced inconsistent – and at times contradictory – findings: Which content characteristics of news articles determine social media engagement with the respective article? Or put differently, what news are shared and reacted to on social media? In what follows, we briefly contextualize this research question and review relevant literature substantiating our hypothesis. As aforementioned, literature in this area has vastly increased over the past years and has yielded an impressive number of, yet often contradictory, insights (e.g. Kümpel, Karnowski, and Keyling Citation2015; Trilling, Tolochko, and Burscher Citation2017; Kim Citation2021; Kim, Jones-Jang, and Kenski Citation2021). We, however, emphasize that our goal is not to provide a most comprehensive empirical account of the mechanisms at play. Instead, for the purpose of this article, we deem it sufficient to review and reassess the contribution of what could be coined the dominant perspectives and empirical evidence in the literature by means of a multiverse approach.
The shareworthiness of news stories on social media is argued to stem from particular features of the actual contents of the news (e.g. Trilling, Tolochko, and Burscher Citation2017). A number of studies found that general news values such as geographical or psychological proximity, negativity (in terms of controversy or conflict), or human interest to some degree explain news sharing (Trilling, Tolochko, and Burscher Citation2017; García-Perdomo et al. Citation2018). Contrary, Kilgo, Lough, and Riedl (Citation2020) find that news values are negligible when predicting user engagement, and similar conclusions are reached by Salgado and Bobba (Citation2019) where negativity, emotions, and personalization had yet a positive but only limited influence on user engagement. Sometimes, studies even disagree about the specific direction of the influence regarding aforementioned factors. For instance, while some find that news sharing is positively influenced when the contents are negatively valenced (Valenzuela, Piña, and Ramírez Citation2017), others found that positive valence had a stronger impact (Bakshy et al. Citation2011; Berger and Milkman Citation2012; Trilling, Tolochko, and Burscher Citation2017). Similarly, positive messages of politicians elicited more “love” reactions on Facebook while negative messages received more “angry” reactions (Eberl et al. Citation2020). Emotional or arousing news content is arguably shared more often (Berger Citation2011), while a more recent study found an influence of emotional or arousing news content only on reactions (Salgado and Bobba Citation2019). Finally, high informational value in the news like relevance, unexpectedness (Rudat, Buder, and Hesse Citation2014), or oddity (García-Perdomo et al. Citation2018) were found to contribute to user engagement. This is somewhat in contrast to findings by Kalsnes and Larsson (Citation2018), who show that soft news elicits more shares than hard news. In sum, we see a rather mixed picture in which results at times quite drastically diverge between different empirical studies. Attempting to focus our multiverse approach on one of the main factors that prior literature considered, and given the contrasting findings regarding sentiment (as an indicator for news values), we pose two contrasting hypotheses:
H1a: More positive news articles receive more engagement on social media.
H1b: More negative news articles receive more engagement on social media.
While the diversity of findings may be in parts attributable to different platforms under investigation (e.g. Twitter vs. Facebook), different country selections (see also García-Perdomo et al. Citation2018) or different user engagement metrics, divergent findings may also be the result of different measurement instruments or modelling specifications. In our contribution, we tackle the latter by applying a multiverse approach.
The specification of the dependent variable, user engagement (or virality) on social media, allows for different operationalizations and can be assessed by means of three dimensions described as reach (such as sharing or forwarding), evaluation (such as likes or emojis), and deliberation (commenting) (Alhabash and McAlister Citation2015). According to Salgado and Bobba (Citation2019) evaluations would represent the lowest degree of user commitment. News sharing is described as a medium level of user engagement, yet arguably the most important type of behavior. Deliberation in the form of commenting would involve the greatest user commitment. Data from the Digital News Report confirm that evaluation actions are most likely and deliberation least likely actions when social media users engage with news contents (Newman et al. Citation2020). In our study, we consider all types of engagement yet differentiate within the evaluation category between likes and the use of emojis and refer to them in sum as user engagement.
To illustrate the multiverse approach and test aforementioned hypotheses, we analyze the engagement with news articles originating from 45 news sites in seven countries across four languages using the useNews dataset (Puschmann and Haim Citation2021). We chose these countries based on the language capacities in our research team. Our sample includes a diverse collection of quality newspapers (e.g. The Guardian, Washington Post), online news media (e.g. okdiario.com), news channels (e.g. SkyNews), and tabloid newspapers (e.g. The Daily Mail, oe24.at). We preregistered the hypotheses and analytical strategy before measuring our variables or analyzing the data1. Our deviations from this plan are summarized in Table B1 in the Supporting Information. We provide a description of the dataset in section A1 in the Supporting Information. In total, 1,847,414 news articles come from the seven countries included in this study. We are interested in the user engagement with news articles on social media once they are shared by the respective news site. This means that for each news article in our data, we looked if it had been shared by the news site’s Facebook page and matched it with the relevant engagement metrics. Some news sites operate several Facebook pages, with one main page and different topical or regional subpages. For this study we only included news articles that have been shared by their main Facebook page, leaving us with 163,646 cases for inclusion in the statistical models. gives an overview of the news sites included in this study, as well as the number of articles posted on the news sites’ Facebook pages that we were able to match with the corresponding media content and engagement data.2
Table 1. Sample description (N = 163,646).
To conduct a multiverse analysis, researchers have to follow three steps: (1) identify the main analytical options and construct the multiverse of analytical choices, (2) implement the analysis using their programming language of choice, and (3) present the results of the multiverse analysis. The next sections cover these steps in turn.
Constructing the Multiverse of Analytical Decisions
The first step of a multiverse analysis is to list the full set of reasonable analytical choices that can be made when turning raw data into a dataset ready for statistical analysis. In our example, this concerns the different ways of turning sentiment dictionary matches into a continuous sentiment score, the choice of sentiment dictionary, alternative ways to measure textual complexity, and different sets of text preprocessing steps that are relevant for the topic measure. We also have to think about the set of control variables to include, exclusion criteria, and modelling decisions. provides an overview of the variables we include and the analytical choices we considered. In total, our decisions give rise to 1728 models from each combination of analytical decisions. While this number might seem high, consider that the number of models rises exponentially with each additional option. If the resulting number of models is unfeasibly large, one can draw a random sample of models. In our example, we can estimate the full set of models. The remainder of this section describes the analytical options we considered in more detail.
Table 2. Multiverse of analysis paths.
Dependent Variables and Choice of Models
We are interested in three dimensions of user engagement with news articles on social media, namely reach (sharing of a Facebook post), deliberation (commenting on a Facebook post), and evaluation (liking a Facebook post or sending an emoji reaction). The measurement of our dependent variables is straightforward: Shares is the total number of times a post has been shared, and comments is the total number of comments under the post. To measure emoji reactions, we summed the total number of the different emoji reactions a post received (love, wow, haha, sad, angry, thankful). Finally, likes is the total number of times a post has been liked.
Exploration of the data revealed that all our dependent variables are positively skewed and follow a count data distribution (see Table A4 in the Supporting Information for descriptive statistics of the variables in the dataset). Considering that the standard deviations of all variables are much higher than their mean, negative binomial regression models are most appropriate (Gardner, Mulvey, and Shaw Citation1995). Another approach to model these data employed in previous studies (e.g. García-Perdomo et al. Citation2018) is to log transform the dependent variable and use OLS regression models. We include both modelling options in our multiverse analysis.
Independent Variable: Sentiment
To measure the sentiment of news articles, that is how positive or negative a news article is, we use sentiment dictionaries. These dictionaries contain lists of positively and negatively valenced words and tell us for each article how many words have been identified to belong to either category. There are several ready-to-use sentiment dictionaries available. Because sentiment dictionaries often do not agree with each other (Boukes et al. Citation2020; van Atteveldt, van der Velden, and Boukes Citation2021), we refrain from just using a single one. Instead, we base our measure on three sentiment dictionaries that have been widely used in the social sciences: The LIWC Linguistic Inquiry and Word Count dictionary (Tausczik and Pennebaker Citation2010), the LSD Lexicoder sentiment dictionary (Young and Soroka Citation2012; Proksch et al. Citation2019), and the NRC emotion dictionary (Mohammad and Turney Citation2013). We consider two ways of transforming these word counts into a continuous measure of sentiment. The first option is to subtract the share of negative words from the share of positive words: The second option, as suggested by Proksch et al. (Citation2019), is to use the logged ratio of positive and negative word shares:
Control Variables
The arousal of news articles, that is how emotional a news article is, is also measured using sentiment dictionaries, and we arrive at a continuous arousal score by summing the shares of positive and negative words identified by the dictionaries:
We measure complexity, that is how complex the ideas in a news article are expressed, by using different indices of lexical diversity. Lexical diversity is a term used to indicate the range of the vocabulary that is present in a text. Because of the nature of our text data (bag-of-words), our choice of complexity measures is limited to those that do not require information on sentence structure. We use three different indices of lexical diversity that have been brought forward in the literature. In the following formulas, N refers to the total number of words, and V to the number of unique words in a text: Type-Token Ratio: Carroll’s corrected Type-Token Ratio:
and Dugast’s Uber Index:
In our data, the distribution of the last measure is heavily skewed. We thus log transform the complexity variables before entering them into our statistical models.
Different topics covered by a news article typically receive a different number of shares and other forms of engagement (Berger and Milkman Citation2012; García-Perdomo et al. Citation2018). They also systematically differ in their average sentiment (Young and Soroka Citation2012). To ensure our results are not driven by topical differences between articles with high and low engagement scores, we include the main topic of an article as a control variable. To determine it, we use Latent Dirichlet Allocation (LDA) topic modelling (Blei, Ng, and Jordan Citation2003) and follow García-Perdomo et al. (Citation2018) when grouping topics into topic categories: International affairs, government/politics/national defense, crime/law & order, entertainment/culture, economy/banking/finance, sports, life/society, and science/technology. All articles not falling into one of these eight broad categories are coded as “other topic.” We describe this procedure in detail in section A2 in the Supporting Information.
We face several choices when preparing the data for topic modelling. The media content data in the useNews dataset have already been preprocessed – stopwords, numbers, and punctuation have been removed. This leaves us with two additional questions: First, should we stem the words in the news articles? Second, should we trim the document-term matrix? We don’t have any theoretical advice concerning these questions for our specific study, and we, therefore, consider all four resulting options equally valid. This means we repeat the process of finding the optimal number of topics, estimating the topic model, and aggregating topics into several topic categories four times for each country. In sum, our measurement of the main topic of an article is, for each country, based on four different topic models based on four different document-term matrices. Since there is no objectively optimal number of topics, it would be beneficial to include multiple models drawing from a reasonable range of numbers. Because the human interpretation of topic models is resource intensive, we refrain from doing so for the sake of this multiverse demonstration. While there is potential to automate this process (e.g. Béchara et al. Citation2021), this already highlights one of the limitations when using a multiverse approach in text-as-data projects: when human input is required, not all reasonable analytical choices might be feasible.
Furthermore, we account for the differences in popularity between news sites and possible language effects by including dummy variables for each news site. Finally, we include the length of the article, measured as the log transformed number of words, and several variables controlling for the year, month, day of the week, and time of the day a news article has been posted on a news site’s Facebook page. We estimate several models including different combinations of control variables. Because we have a theoretical reason to control for the arousal and complexity of a news article, its main topic, and the news site posting it, we include these controls in all models. We decided to include the remaining control variables hierarchically – adding one finer grained temporal control at a time – resulting in six different combinations of controls. In cases where every combination of control variables is reasonable, researchers should include all of them. Because this can quickly result in millions of models, drawing a random sample of models is advised.
Implementing the Multiverse
Once the set of analytical decisions is defined, the second step is to run all the analyses. This means that for each combination of choices one has to: (1) construct a dataset, (2) specify a model, (3) estimate the model and extract the quantities of interest (e.g. coefficients and standard errors). While the first implementations of the multiverse approach simply looped over different sets of variables,3 this quickly becomes tedious as the set of analytical options gets more complex. In our example, for instance, we do not want to include every combination of operationalizing sentiment and arousal. Instead, we only want to include combinations that use the same dictionary, e.g. in all models where the LSD dictionary is used to measure sentiment, we also want arousal to be measured with the LSD dictionary. One can easily see how the inclusion of such control flows makes a loop-based implementation cumbersome and prone to error.
In our implementation of this multiverse analysis, we use the R-package multiverse (Sarma et al. Citation2021) to estimate the models and extract results. The package comes with a dplyr-like embedded domain-specific language to setup analytical paths and an API to interact with and extract results from a multiverse analysis, which can then be wrapped within a larger analysis in R. It provides a good middle ground between ease of use and customizability in setting up the multiverse: while not as flexible as coding a multiverse analysis procedure from scratch, it offers more options (e.g. different operationalizations of control variables, conditional control flows, parallelization) compared to the very easy to use specr package (Masur and Scharkow Citation2020). It is worth noting that development of both packages is ongoing, and researchers interested in doing a multiverse analysis should consider both options.
All files necessary to replicate our analysis can be found on OSF.4 In the accompanying online tutorial5 we show how to implement the analysis from this study step by step. We start with inspecting the data setup, show how to define analytical choices, and demonstrate the implementation of the multiverse in three different ways: using custom code, the multiverse package, and the very easy to use implementation provided by specr. We also demonstrate how to create the visualizations presented in this article.
Communicating the Multiverse Results
After deciding on the set of analytical choices and estimating all models, the third step in a multiverse analysis is to display and interpret model results. In our example, we were interested in the relationship between news article sentiment and news engagement on social media. displays the estimated effects of sentiment (solid color) with 95% confidence intervals (shaded color) across four dependent variables (shares, comments, emoji reactions, likes). We ordered them by magnitude, a graphical display of multiverse results also called a specification curve (Simonsohn, Simmons, and Nelson Citation2020). Because of the large number of cases in our sample, the confidence intervals are very narrow for all analyses. We also used different colors to highlight the choice of dictionaries used for the measurement of sentiment.
Figure 1. Results from the multiverse of OLS and negative binomial regression models explaining different forms of news engagement on social media. Each dot represents the estimated effect of news article sentiment based on a single model with 95% confidence intervals. The dashed line indicates an effect of 0. All independent variables have been standardized. Colors indicate the used sentiment dictionary. A total of 1728 models were estimated for each dependent variable; to facilitate visual display, the figure depicts a random subset of 200 model specifications.
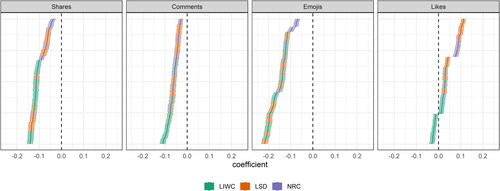
For instance, the left panel (labelled Shares) shows the distribution of effects that news article sentiment has on the number of times an article gets shared. While the effects vary in size, we end up with negative effects across all specifications of the multiverse. In contrast, the right panel (the effect of sentiment on the number of likes an article receives, labelled Likes) shows that across different specifications of the multiverse we arrive at different conclusions, indicated by the specification curve crossing the zero line. This means that some specifications of the multiverse (at the bottom of the panel) point towards a negative effect of sentiment on the numbers of likes. We would thus conclude that more negative news articles receive more likes. At the same time, other specifications (at the upper end of the panel) direct us towards identifying a positive relationship, that is that more positive news articles receive more likes.
We had two competing hypotheses concerning the sentiment of news articles: H1a predicted a higher amount of engagement for more positive news articles, while H1b predicted that engagement is higher for more negative articles. Overall, it appears that our multiverse results more strongly support H1b, in that most specifications suggest an effect of negative sentiment on user engagement. It is only for likes that our analyses are indecisive. Therefore, we conclude that H1b is partially supported while we find no support for H1a.
Because we know which combination of analytical choices is connected to each result, we can investigate how these choices influence the estimate. In , we already color coded the sentiment dictionary used for each model, showing that the estimates are not equally distributed across dictionaries. We can extend this investigation and display a descriptive specification curve that identifies which analytical decisions are the most consequential. shows the specification curves for two of the dependent variables. The top panels depict the estimated effects, the bottom panels of the figure tell us which analytical choices produce different estimates. If an analytical decision does not have a systematic effect, we would expect that dots appear across the entire range of models for the respective variables. In our example, decisions about which complexity measure to use when controlling for news article complexity, the inclusion of different control variables, or decisions about the aggregation of dictionary scores, seem to not influence the estimates.
Figure 2. Influence of analytical choices on the estimated effect of sentiment on news sharing and liking. Each dot in the top panels (grey area) depicts the estimated effect of news article sentiment based on a single model with 95% confidence intervals; the dots in the bottom panels (white area) indicate the analytical decisions behind the estimates. A total of 1728 models were estimated for each dependent variable; to facilitate visual display, the figure depicts a random subset of 200 model specifications.
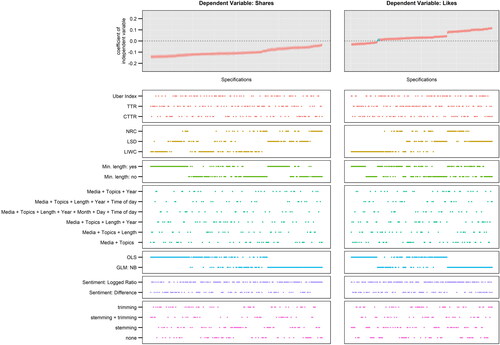
This pattern is different when looking at the different options for choosing a sentiment dictionary, and for the models using shares as the dependent variable (left panels), the question of excluding short news articles. For the estimated effects of sentiment on news sharing, we see that models relying on the LIWC dictionary produce the largest negative effects, while using the NRC dictionary would drive us towards much smaller effects (estimates from the LSD dictionary are in between). We can also see that excluding short articles leads to larger negative effects of article sentiment on sharing. However, no matter what decision we take during the multiverse analysis, we would conclude that positive sentiment is negatively related to news sharing. Yet the picture is different for likes – depending on the analytical choices our conclusions could go anywhere. We could end up with a small negative effect if using the LIWC dictionary, excluding short articles, and relying on an OLS model. If, on the contrary, we decided to opt for the LSD dictionary and negative binomial regression models, we would arrive at a sizable positive effect of sentiment on the number of likes.
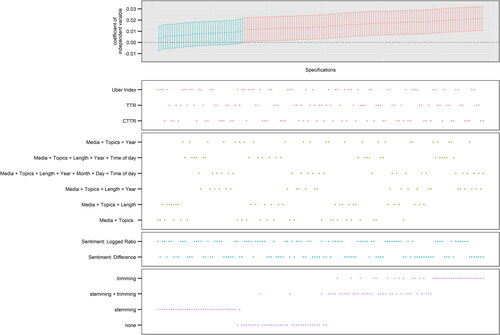
Besides these arguably worrying systematic effects of dictionary choice on the conclusions drawn from the analysis, we also see that estimated effects are influenced by both chance and text preprocessing. To demonstrate this for the influence of sentiment on likes, we remove the systematic effects of dictionary selection, exclusion of short articles, modelling strategy from the visual display, and only use models relying on the LIWC dictionary, negative binomial models, and articles with a minimum of 100 words (N = 144 models). As demonstrates, one could arrive at both significant and non-significant effects. The differences in effect sizes between models are small (min. = 0.004, max = 0.021), but large enough to decide if we’re drawn towards seeing support for a statistically significant relationship. While text preprocessing choices also seem to be systematically related to model estimates, we could still arrive at both significant and nonsignificant effects when applying no additional preprocessing.
Figure 3. Significant vs. nonsignificant effects of sentiment on liking using LIWC. Each dot in the top panels (grey area) depicts the estimated effect of news article sentiment based on a single model with 95% confidence intervals; the dots in the bottom panels (white area) indicate the analytical decisions behind the estimates. N = 144, only using models relying on the LIWC dictionary, negative binomial models, and articles with more than 100 words.
Discussion and Conclusion
The primary goal of this article is to introduce a multiverse analysis approach to the fields of (digital) journalism studies and communication. We have illustrated how the concept of the multiverse can benefit a systematic assessment of the robustness of findings in quantitative research using observational data in general, and text-as-data projects in particular. This is especially important given that text-as-data approaches have become very common, and researchers often rely on off-the-shelf tools to conduct analyses. Starting from the idea that a researcher faces several equally valid and plausible analytical paths on her journey from raw data to a statistical model, we have shown how these decisions influence the conclusions drawn from the analyses. We have done so by replicating the exemplary empirical research on news article content effects on social media user engagement, an area which hitherto produced inconclusive findings which may be attributable to researchers taking different processing and analytical decisions. Overall, we find supportive evidence for our expectations that social media users engage more with negative news.
While these substantial findings may be interesting in their own right and add to the literature in the area by at least partially confirming or challenging prior insights (Trilling, Tolochko, and Burscher Citation2017; García-Perdomo et al. Citation2018; Salgado and Bobba Citation2019), the main point of interest is on the added value of using a multiverse approach, or the question of whether we would have arrived at the same conclusions if we had used a more traditional analytical approach? Based on our findings, the answer should be “maybe.” If our interest would have been in the effects of sentiment on user engagement, with some likelihood we would have ended up with a conclusion that negativity leads to stronger overall user engagement. Would we have focussed only on the effects of sentiment on the number of likes, results could have gone anywhere, however. This highlights the usefulness of the multiverse approach, in that it informs about how our particular choices as researchers, as reasonable as they may appear, may strongly drive the actual conclusions we draw regarding our substantial research questions. If results are robust across the multiverse, as with regards to sentiment and, e.g. shares or comments, then we can with much more confidence draw substantial conclusions. But our results also show that this is not the case for the association between sentiment and likes, suggesting that some of the heterogeneity in research findings on the question if negative news drives online news engagement stems from the analytical flexibility when working with large (text) datasets. Our results highlight in particular a questionable influence of dictionary choice on empirical results relying on automated content analysis. While recent studies have thoroughly engaged with the problematic nature of sentiment dictionaries (van Atteveldt, van der Velden, and Boukes Citation2021) our approach adds another perspective on this debate. We, therefore, believe that our approach has great value for a field that is increasingly faced with a range of analytical choices.
We believe the possible implications from our study for journalism and communication scholars are large. In particular approaches drawing on computational methods and/or employing and linking different data sources (e.g. De Vreese et al. Citation2017; Song, Cho, and Benefield Citation2020; Guess, Nyhan, and Reifler Citation2020) often face a plethora of plausible alternatives in terms of coding, exclusion rules, constructing behavioral indicators from trace data, and specifically, how to “link” other sources of data with individual-level observational data. The multiverse approach is the tool to assess the robustness of findings against making specific choices and should be applied more commonly in such instances in which the motivation for certain choices is not more than plausible. Beyond academia, our findings are also important. Data journalists for instance increasingly apply ready-made text-as-data tools to infer information about, e.g. social media sentiments during election campaigns. Our results show that more caution needs to be exercised regarding, e.g. the choices of preprocessing and dictionaries. How credible are such publicized debates then?
Given the goal of our contribution to introduce multiverse analysis we here provide some best practice recommendations. (1) Researchers need to be very explicit and transparent about every step taken in the construction of the multiverse. (2) If possible and available it is recommended to use prior meta-analytic syntheses of previous research to make reasonable justification of analytical choices. (3) Properly communicate the results of the multiverse analysis and be sure to adhere to reporting standards. Despite its advantages it needs to be emphasized that multiverse analysis is no magic tool that prevents fishing or selective reporting of research results per se. What one (group of) researcher(s) deems a reasonable option in multiverse analysis does not have to be deemed reasonable at all by others. Many of the analytical decisions are on the hand of the researcher when constructing the analytic universe. The multiverse analysis in and of itself does not solve the problem of model selection and multiple comparison problems (relative to all possible universes of models), although it does produce evidence regarding the robustness (or fragility) of the obtained results, and what methodological factors most influence such patterns. Developing a standard towards conducting multiverse analysis allows us to be more confident of our own findings. We also want to highlight that it is often not possible to include every reasonable model specification. As soon as human input is required (e.g. manual interpretation of topic models), adding additional analytical paths quickly becomes costly.
Nonetheless we believe in the value of the multiverse approach and our contribution. As Gelman and Loken (Citation2014) put it, “In (largely) observational fields such as political science, economics, and sociology, replication is more difficult. We cannot easily gather data on additional wars, or additional financial crises, or additional countries. In such settings our only recommendation can be to more fully analyze existing data.” This commentary suggests that observational studies – and in particular text analysis – can profoundly benefit from multiverse analysis, yet not much attention was paid to and effort was made for the notion of multiverse analysis in this area. We believe our study is an important step into this direction for the fields of (digital) journalism studies and communication science.
Supplemental Material
Download PDF (108.3 KB)Disclosure Statement
No potential conflict of interest was reported by the author(s).
Additional information
Funding
Notes
1 Preregistration material and replication code available on the OSF project site at https://osf.io/68cje/
2 The number of articles included in the study varies between countries. In some countries (e.g. Germany, Australia), a large amount of news articles is shared exclusively by news sites’ regional or thematic subpages which we did not include. We provide a breakdown of the sample sizes per news site Facebook page in section A3 in the Supporting Information.
3 For an example see the replication code of the foundational multiverse paper by Steegen et al. (Citation2016), available at: https://osf.io/zj68b/
References
- Alhabash, S., and A. R. McAlister. 2015. “Redefining Virality in Less Broad Strokes: Predicting Viral Behavioral Intentions from Motivations and Uses of Facebook and Twitter.” New Media & Society 17 (8): 1317–1339.
- Baden, C., C. Pipal, M. Schoonvelde, and M. A. C. G. van der Velden. 2021. “Three Gaps in Computational Text Analysis Methods for Social Sciences: A Research Agenda.” Communication Methods and Measures 0 (0): 1–18.
- Bakker, B. N., K. Jaidka, T. Dörr, N. Fasching, and Y. Lelkes. 2021. “Questionable and Open Research Practices: Attitudes and Perceptions among Quantitative Communication Researchers.” Journal of Communication 71 (5): 715–738.
- Bakshy, E., J. M. Hofman, W. A. Mason, and D. J. Watts. 2011. “Everyone’s an Influencer: Quantifying Influence on Twitter.” Hong Kong: Proceedings of the Fourth ACM International Conference on Web Search and Data Mining - WSDM 11, 65.
- Béchara, H., A. Herzog, S. Jankin, and P. John. 2021. “Transfer Learning for Topic Labeling: Analysis of the UK House of Commons Speeches 1935–2014.” Research & Politics 8 (2): 205316802110222.
- Berger, J. 2011. “Arousal Increases Social Transmission of Information.” Psychological Science 22 (7): 891–893.
- Berger, J., and K. L. Milkman. 2012. “What Makes Online Content Viral?” Journal of Marketing Research 49 (2): 192–205.
- Blei, D. M., A. Y. Ng, and M. I. Jordan. 2003. “Latent Dirichlet Allocation.” Journal of Machine Learning Research 3 (4–5): 993–1022.
- Boukes, M., B. van de Velde, T. Araujo, and R. Vliegenthart. 2020. “What’s the Tone? Easy Doesn’t Do It: Analyzing Performance and Agreement between off-the-Shelf Sentiment Analysis Tools.” Communication Methods and Measures 14 (2): 83–104.
- Boumans, J. W., and D. Trilling. 2016. “Taking Stock of the Toolkit: An Overview of Relevant Automated Content Analysis Approaches and Techniques for Digital Journalism Scholars.” Digital Journalism 4 (1): 8–23.
- Bowman, N. D., and J. R. Keene. 2018. “A Layered Framework for considering Open Science Practices.” Communication Research Reports 35 (4): 363–372.
- Burton, J. W., N. Cruz, and U. Hahn. 2021. “Reconsidering Evidence of Moral Contagion in Online Social Networks.” Nature Human Behaviour 5 (12): 1629–1635.
- Chan, C.-H., J. Bajjalieh, L. Auvil, H. Wessler, S. Althaus, K. Welbers, W. van Atteveldt, and M. Jungblut. 2021. “Four Best Practices for Measuring News Sentiment Using ‘off-the-Shelf’dictionaries: A Large-Scale p-Hacking Experiment.” Computational Communication Research 3 (1): 1–27.
- Choi, S., H. Shin, and S.-S. Kang. 2021. “Predicting Audience-Rated News Quality: Using Survey, Text Mining, and Neural Network Methods.” Digital Journalism 9 (1): 84–105.
- Chorley, M. J., and G. Mottershead. 2016. “Are You Talking to Me?” Journalism Practice 10 (7): 856–867.
- De Vreese, C. H., M. Boukes, A. Schuck, R. Vliegenthart, L. Bos, and Y. Lelkes. 2017. “Linking Survey and Media Content Data: Opportunities, Considerations, and Pitfalls.” Communication Methods and Measures 11 (4): 221–244.
- Denny, M. J., and A. Spirling. 2018. “Text Preprocessing for Unsupervised Learning: Why It Matters, When It Misleads, and What to Do about It.” Political Analysis 26 (2): 168–189.
- Diehl, Trevor,Brian E. Weeks, andHomero Gil De Zúñiga. 2016. “Political Persuasion on Social Media: Tracing Direct and Indirect Effects of News Use and Social Interaction.” New Media & Society 18 (9): 1875–1895.
- Dienlin, T., N. Johannes, N. D. Bowman, P. K. Masur, S. Engesser, A. S. Kümpel, J. Lukito, et al. 2021. “An Agenda for Open Science in Communication.” Journal of Communication 71 (1): 1–26.
- Eberl, J. M., P. Tolochko, P. Jost, T. Heidenreich, and H. G. Boomgaarden. 2020. “What’s in a Post? How Sentiment and Issue Salience Affect Users’ Emotional Reactions on Facebook.” Journal of Information Technology & Politics 17 (1): 48–65.
- García-Perdomo, V., R. Salaverría, D. K. Kilgo, and S. Harlow. 2018. “To Share or Not to Share: The Influence of News Values and Topics on Popular Social Media Content in the United States, Brazil, and Argentina.” Journalism Studies 19 (8): 1180–1201.
- Gardner, W., E. P. Mulvey, and E. C. Shaw. 1995. “Regression Analyses of Counts and Rates: Poisson, Overdispersed Poisson, and Negative Binomial Models.” Psychological Bulletin 118 (3): 392–404.
- Gelman, A., and E. Loken. 2014. “The Statistical Crisis in Science.” American Scientist 102 (6): 460.
- Gil de Zúñiga, H., B. Weeks, and A. Ardèvol-Abreu. 2017. “Effects of the News-Finds-Me Perception in Communication: Social Media Use Implications for News Seeking and Learning about Politics.” Journal of Computer-Mediated Communication 22 (3): 105–123.
- Grimmer, J., and B. M. Stewart. 2013. “Text as Data: The Promise and Pitfalls of Automatic Content Analysis Methods for Political Texts.” Political Analysis 21 (3): 267–297.
- Guess, A. M., B. Nyhan, and J. Reifler. 2020. “Exposure to Untrustworthy Websites in the 2016 US Election.” Nature Human Behaviour 4 (5): 472–480.
- Guo, L. 2019. “Media Agenda Diversity and Intermedia Agenda Setting in a Controlled Media Environment: A Computational Analysis of China’s Online News.” Journalism Studies 20 (16): 2460–2477.
- John, L. K., G. Loewenstein, and D. Prelec. 2012. “Measuring the Prevalence of Questionable Research Practices with Incentives for Truth Telling.” Psychological Science 23 (5): 524–532.
- Kalsnes, B., and A. O. Larsson. 2018. “Understanding News Sharing across Social Media.” Journalism Studies 19 (11): 1669–1688.
- Kantner, C., and M. Overbeck. 2020. Exploring Soft Concepts with Hard Corpus-Analytic Methods. In Reflektierte algorithmische Textanalyse (S. 169–190). De Gruyter.
- Kilgo, D. K., K. Lough, and M. J. Riedl. 2020. “Emotional Appeals and News Values as Factors of Shareworthiness in Ice Bucket Challenge Coverage.” Digital Journalism 8 (2): 267–286.
- Kim, D. H., S. M. Jones-Jang, and K. Kenski. 2021. “Why Do People Share Political Information on Social Media?” Digital Journalism 9 (8): 1123–1140.
- Kim, H. S. 2021. “How Message Features and Social Endorsements Affect the Longevity of News Sharing.” Digital Journalism 9 (8): 1162–1183.
- Kirtley, O. J., G. Lafit, R. Achterhof, A. P. Hiekkaranta, and I. Myin-Germeys. 2021. “Making the Black Box Transparent: A Template and Tutorial for Registration of Studies Using Experience-Sampling Methods.” Advances in Methods and Practices in Psychological Science 4 (1): 251524592092468.
- Kümpel, A. S., V. Karnowski, and T. Keyling. 2015. “News Sharing in Social Media: A Review of Current Research on News Sharing Users, Content, and Networks.” Social Media + Society 1 (2): 2056305115610141.
- Lenz, G. S., and A. Sahn. 2021. “Achieving Statistical Significance with Control Variables and without Transparency.” Political Analysis 29 (3): 356–369.
- Markowitz, D. M., H. Song, and S. H. Taylor. 2021. “Tracing the Adoption and Effects of Open Science in Communication Research.” Journal of Communication 71 (5): 739–763.
- Masur, P. K., and M. Scharkow. 2020. specr: Conducting and Visualizing Specification Curve Analyses. https://CRAN.R-project.org/package=specr
- Matthes, J., F. Marquart, B. Naderer, F. Arendt, D. Schmuck, and K. Adam. 2015. “Questionable Research Practices in Experimental Communication Research: A Systematic Analysis from 1980 to 2013.” Communication Methods and Measures 9 (4): 193–207.
- Mohammad, S. M., and P. D. Turney. 2013. “Crowdsourcing a Word-Emotion Association Lexicon.” Computational Intelligence 29 (3): 436–465.
- Newman, N., R. Fletcher, A. Schulz, S. Andi, and R. K. Nielsen. 2020. Reuters Institute Digital News Report 2020. Reuters Institute for the Study of Journalism: https://www.digitalnewsreport.org/survey/2020/.
- Open Science Collaboration. 2015. “Estimating the Reproducibility of Psychological Science.” Science 349 (6251): 4716–1–4716-8.
- Pipal, C., B. N. Bakker, G. Schumacher, and M. A. C. G. van der Velden. 2022a. Emotional Appeals in Politics Are Not Systematically Related to Macro Trends, Ideology, or Experience. OSF Preprint: https://osf.io/ur5xg/
- Pipal, C., M. Schoonvelde, and G. Schumacher. 2022b. Taking Context Seriously: Joint Estimation of Sentiment and Topics in Textual Data. OSF Preprint: https://osf.io/e56tu/
- Proksch, S. O., W. Lowe, J. Wäckerle, and S. Soroka. 2019. “Multilingual Sentiment Analysis: A New Approach to Measuring Conflict in Legislative Speeches.” Legislative Studies Quarterly 44 (1): 97–131.
- Puschmann, C., and A. Powell. 2018. “Turning Words into Consumer Preferences: How Sentiment Analysis is Framed in Research and the News Media.” Social Media + Society 4 (3): 205630511879772.
- Puschmann, C., and M. Haim. 2021. useNews. OSF Preprint: https://osf.io/uzca3/
- Rudat, A., J. Buder, and F. W. Hesse. 2014. “Audience Design in Twitter: Retweeting Behavior between Informational Value and Followers’ Interests.” Computers in Human Behavior 35: 132–139.
- Salgado, S., and G. Bobba. 2019. “News on Events and Social Media: A Comparative Analysis of Facebook Users' Reactions.” Journalism Studies 20 (15): 2258–2276.
- Saraceno, J., E. R. Hansen, and S. A. Treul. 2021. “Reevaluating the Substantive Representation of Lesbian, Gay, and Bisexual Americans: A Multiverse Analysis.” The Journal of Politics 83 (4): 1837–1843.
- Sarma, A., A. Kale, M. J. Moon, N. Taback, F. Chevalier, J. Hullman, and M. Kay. 2021. multiverse: Multiplexing Alternative Data Analyses in R Notebooks. OSF Preprint: https://osf.io/yfbwm/
- Silberzahn, R., E. L. Uhlmann, D. P. Martin, P. Anselmi, F. Aust, E. Awtrey, Š. Bahník, et al. 2018. “Many Analysts, One Data Set: Making Transparent How Variations in Analytic Choices Affect Results.” Advances in Methods and Practices in Psychological Science 1 (3): 337–356.
- Simmons, J. P., L. D. Nelson, and U. Simonsohn. 2011. “False-Positive Psychology: Undisclosed Flexibility in Data Collection and Analysis Allows Presenting Anything as Significant.” Psychological Science 22 (11): 1359–1366.
- Simonsohn, U., J. P. Simmons, and L. D. Nelson. 2020. “Specification Curve Analysis.” Nature Human Behaviour 4 (11): 1208–1214.
- Song, Hyunjin,Jaeho Cho, andGrace A. Benefield. 2020. “The Dynamics of Message Selection in Online Political Discussion Forums: Self-Segregation or Diverse Exposure?.” Communication Research 47 (1): 125–152.
- Song, H., P. Tolochko, J.-M. Eberl, O. Eisele, E. Greussing, T. Heidenreich, F. Lind, S. Galyga, and H. G. Boomgaarden. 2020. “In Validations We Trust? The Impact of Imperfect Human Annotations as a Gold Standard on the Quality of Validation of Automated Content Analysis.” Political Communication 37 (4): 550–572.
- Steegen, S., F. Tuerlinckx, A. Gelman, and W. Vanpaemel. 2016. “Increasing Transparency through a Multiverse Analysis.” Perspectives on Psychological Science 11 (5): 702–712.
- Stroud, N. J., and A. Muddiman. 2019. “Social Media Engagement with Strategy- and Issue-Framed Political News.” Journal of Communication 69 (5): 443–466.
- Tandoc, E. C., and T. P. Vos. 2016. “The Journalist is Marketing the News.” Journalism Practice 10 (8): 950–966.
- Tausczik, Y. R., and J. W. Pennebaker. 2010. “The Psychological Meaning of Words: LIWC and Computerized Text Analysis Methods.” Journal of Language and Social Psychology 29 (1): 24–54.
- Trilling, D., P. Tolochko, and B. Burscher. 2017. “From Newsworthiness to Shareworthiness: How to Predict News Sharing Based on Article Characteristics.” Journalism & Mass Communication Quarterly 94 (1): 38–60.
- Valenzuela, S., M. Piña, and J. Ramírez. 2017. “Behavioral Effects of Framing on Social Media Users: How Conflict, Economic, Human Interest, and Morality Frames Drive News Sharing.” Journal of Communication 67 (5): 803–826.
- van Atteveldt, W., D. Margolin, C. Shen, D. Trilling, and R. Weber. 2019. “A Roadmap for Computational Communication Research.” Computational Communication Research 1 (1): 1–11.
- van Atteveldt, W., M. A. van der Velden, and M. Boukes. 2021. “The Validity of Sentiment Analysis: Comparing Manual Annotation, Crowd-Coding, Dictionary Approaches, and Machine Learning Algorithms.” Communication Methods and Measures 15 (2): 121–140.
- van Atteveldt, W., and T. Q. Peng. 2018. “When Communication Meets Computation: Opportunities, Challenges, and Pitfalls in Computational Communication Science.” Communication Methods and Measures 12 (2–3): 81–92.
- Welbers, K., and M. Opgenhaffen. 2019. “Presenting News on Social Media: Media Logic in the Communication Style of Newspapers on Facebook.” Digital Journalism 7 (1): 45–62.
- Young, L., and S. Soroka. 2012. “Affective News: The Automated Coding of Sentiment in Political Texts.” Political Communication 29 (2): 205–231.