
Abstract
Objective: To investigate and compare two ALS staging systems, King’s clinical staging and Milano-Torino (MiToS) functional staging, using data from the LiCALS phase III clinical trial (EudraCT 2008-006891-31). Methods: Disease stage was derived retrospectively for each system from the ALS Functional Rating Scale-Revised subscores using standard methods. The two staging methods were then compared for timing of stages using box plots, correspondence using chi-square tests, agreement using a linearly weighted kappa coefficient and concordance using Spearman’s rank correlation. Results: For both systems, progressively higher stages occurred at progressively later proportions of the disease course, but the distribution differed between the two methods. King’s stage 3 corresponded to MiToS stage 1 most frequently, with earlier King’s stages 1 and 2 largely corresponding to MiToS stage 0 or 1. The Spearman correlation was 0.54. There was fair agreement between the two systems with kappa coefficient of 0.21. Conclusion: The distribution of timings shows that the two systems are complementary, with King’s staging showing greatest resolution in early to mid-disease corresponding to clinical or disease burden, and MiToS staging having higher resolution for late disease, corresponding to functional involvement. We therefore propose using both staging systems when describing ALS.
Introduction
Amyotrophic lateral sclerosis (ALS), also known as motor neuron disease (MND), is a progressive neurodegenerative disease of motor neurons in the brain and spinal cord, resulting in progressive paralysis, with death typically within two to five years of diagnosis (Citation1). Although the cumulative lifetime risk of ALS is 1 in 300 (Citation2), the point prevalence is only about 5 per 100,000 persons because of the poor prognosis. The needs of patients differ as ALS progresses, with diagnosis and therapist support being important early on, and respiratory intervention, nutritional intervention and end-of-life care at a later stage.
Various ALS staging methods have been proposed, with uses such as a tool for rehabilitation (Citation3), rapid functional assessment (Citation4), comparison of different treatment models (Citation5,Citation6), biomarker analysis (Citation7) and health economics (Citation8). The El Escorial criteria (Citation9) provide a set of diagnostic guidelines that are based on patterns of disease spread but are not in themselves a staging system. The most widely studied approaches have been the Milano-Torino (MiToS) functional staging and King’s clinical staging systems (Citation10,Citation11). The MiToS system uses six stages, from 0 to 5 and is based on functional ability as assessed by the ALS Functional Rating Scale-Revised (ALSFRS-R) (Citation12), with stage 0 being normal function and stage 5 being death. The King’s system uses five stages, from 1 to 5 and is based on disease burden as measured by clinical involvement and significant feeding or respiratory failure, with stage 1 being symptom onset and stage 5 being death. The King’s system is not based on ALSFRS-R scores, but can be estimated from them with 92% concordance (Citation13).
Although the two systems both measure stage and show content validity, mapping correctly to disease progression, it is not clear to what extent they are collinear and therefore redundant. We therefore set out to compare the systems using data from a phase III randomised double-blind placebo-controlled trial of lithium carbonate in ALS (LiCALS) (EudraCT number 2008-006891-31) (Citation14), in which ALSFRS-R scores were recorded at three-monthly intervals.
Methods
Patients
Anonymised data from the LiCALS clinical trial were reanalysed. Data consisted of ALSFRS-R scores, site of disease onset (bulbar or limb), gastrostomy timing, measures of respiratory function, and timing of non-invasive ventilation, recorded every three months during an 18-month trial enrolment. For all patients, date of death or last follow-up were also recorded.
Clinical staging systems
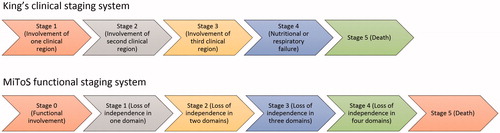
ALS clinical stage comparisons were undertaken using two staging systems: King’s clinical staging and MiToS functional staging. As stages were not previously recorded during the LiCALS clinical trial, stages for both systems were determined retrospectively and derived from historical data, as previously described (Citation10,Citation11) (). For simplicity, we encoded King’s stages with prefix K, and MiToS stages with prefix M, so, for example, K2M3 would represent King’s stage 2 and MiToS stage 3.
Figure 1. Flowchart of ALS staging systems and their definitions (King’s staging and MiToS staging).
Statistical analysis
A Kaplan-Meier survival analysis and log-rank test were used to test differences in survival from disease onset for each categorical variable, site of onset (bulbar or spinal), family history (sporadic ALS or familial ALS), gender, and age of onset in 10-year categories. We also tested the proportion of patients dead or alive using a chi-square test after censoring the date of death or last observation for all patients to 30 June 2011.
Standardised median times for reaching clinical stages were calculated as a proportion of time elapsed from onset to each disease stage across the duration of the disease for both King’s and MiToS systems, with 0 representing symptom onset, and 1, death, using only data from deceased patients, as previously described (Citation11).
Spearman’s coefficient was used to test overall correlation between the two systems. Pairwise comparisons between the number of patients in each King’s and MiToS stage were used to test the relationship between specific stages using a chi-square test. Standardised residuals were used to test which items were most responsible for any associations observed. Agreement between the two ordinal scales was tested using a linearly weighted kappa coefficient.
Kappa coefficient was calculated using VassarStats (http://vassarstats.net/kappa.html). All other statistical tests were carried out using SPSS v22.0 (SPSS Inc, Illinois, USA).
Ethics
The LiCALS clinical study was approved by the South East London Research Ethics Committee, reference 09/H1102/15. All participants involved provided written consent. This current study does not require ethics approval due to analysis being conducted on fully anonymised pre-existing clinical trial data.
Results
Patient characteristics
Data were available for 217 patients, of whom 95 had died by the censor date. Patient characteristics are shown in . Median survival was 43.6 months, which is similar to that found in a previous study using referral clinic data of 42.3 months (Citation11). There were no significant differences in survival by gender, family history or site of onset, and no differences were seen in the proportion still alive by the study end-date. Older age at disease onset was associated with worse survival, p = 0.01, and consistent with this observation, the proportion of deaths compared with censored observations progressively increased as patients were classified into higher age groups: 56% of patients in the 75–84-years age group had died by the end of the trial, compared with only 14% for the 25–34-years age group.
Table 1. Characteristics of LiCALS patients. Median time to death or last observation and percentage of death at last observation compared using different categories (gender, site of onset, family history and age of onset).
Standardised median time
Ninety-five patients had died by the end of the study. The standardised median proportion of time elapsed from onset to each King’s stage is shown in and . Corresponding values for MiToS stages are shown in and , showing a wider distribution of King’s stages through the early and middle disease course, compared with a tendency for MiToS stages to be distributed later in the disease course.
Figure 2. Box plot for Standardised Median Time (SMT) from onset to each disease stage. (A) SMT for King’s stages. (B) SMT for MiToS stages. The y-axis represents the proportion of disease time elapsed, where 0 is disease onset and 1 is death. Horizontal lines on each plot represent the following: minimum, lower quartile, median, upper quartile and maximum values, read from bottom to top. Mean values are marked by ‘x’ and outliers by ‘•’.
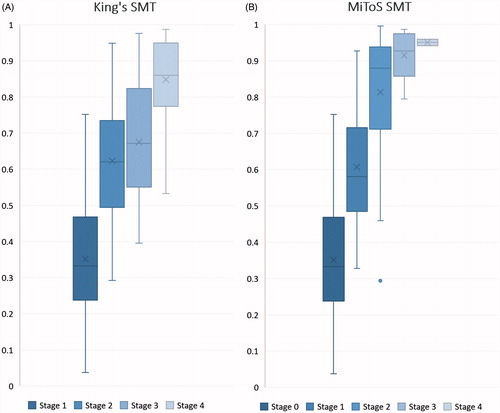
Table 2. Median number of months and Standardised Median Time (SMT) from onset to each stage. (A) King’s staging system, (B) MiToS staging system. Patients dead on last observation were recorded and median time from onset to each stage used and repeated for each stage in both staging systems. IQR = Interquartile range.
Comparison of staging systems
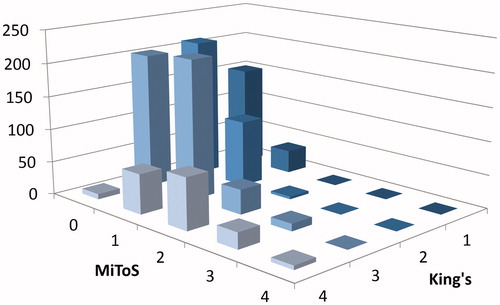
To compare each staging system, King’s and MiToS scores were plotted against frequency for all pairwise comparisons (). King’s stages 1 and 2 matched mostly with MiToS stages 0 or 1 (K1M0 n = 151, K2M0 n = 210, K1M1 n = 35, K2M1 n = 100) with little overlap to MiToS stage 2 (K2M2 n = 4) and none with MiToS stages 3 and 4. However, for King’s stage 3, although the majority was paired with MiToS stages 0 or 1 (K3M0 n = 203, K3M1 n = 211), more patients were defined as MiToS stages 2 (K3M2 n = 37) and 3 (K3M3 n = 11). In King’s stage 4 all four MiToS stages were seen (K4M0 n = 8, K4M1 n = 60, K4M2 n = 77, K4M3 n = 24, K4M4 n = 6). A chi-square test confirmed association between some stages with the two staging systems (p < 0.001) and standardised residuals showing the strongest association were of King’s stage 4 with MiToS stage 2. A Spearman’s rank correlation coefficient between the King’s and MiToS systems showed a correlation of 0.54. A linearly weighted kappa agreement between the two systems highlighted a kappa coefficient of 0.21 with a 95% confidence interval of 0.18–0.24.
Figure 3. Three-dimensional bar chart showing the count of patients in each clinical stage by both systems. The y-axis represents the number of patients, x-axis the MiToS stage (0-4) and z-axis the King’s stage (Citation1–4) of disease progression.
Discussion
We have found that while the King’s clinical staging system is able to differentiate early to mid-disease well, the MiToS staging is able to differentiate late stages in detail, which is in line with previous findings (Citation15). These results support the use of both systems when staging, as they summarise two different aspects of patient information. King’s staging is mostly focused on anatomical disease spread and significant involvement of respiratory muscles, whereas MiToS staging is aimed more towards the distinction of functional capabilities during the spread of the disease. Because functional engagement necessarily follows anatomical involvement, MiToS stages inevitably tend to lag behind King’s stages, manifesting as a higher resolution later on in the disease. This is most clearly seen in , where the relative distribution of individuals in each staging system is shown. The MiToS stages remain at a low resolution for the majority of King’s stages up to K4, at which point there is significant differentiation of the MiToS stages. These findings should be validated in a prospective study.
These differences in disease description by the two systems are also shown by a Spearman’s rank correlation of 0.54, showing some correspondence between the two systems. Association testing shows that King’s stage 4 and MiToS stage 2 are the most strongly associated between all staging pairs. Linearly weighted kappa coefficient tests the strength of agreement between two ordinal scales with increase of penalty based on the level of disagreement. A commonly used scale to interpret kappa values, ranges from 0 (chance agreement) to 1 (perfect agreement) with intervals of poor, slight, fair, moderate, substantial and almost perfect (Citation16). Our analysis between King’s and MiToS staging systems showed a fair agreement with a linearly weighted kappa coefficient of 0.21.
Examination of the proportion of disease elapsed at each stage confirms that King’s stages show more resolution through early to mid-disease and MiToS stages towards the end. Patients in King’s stages 1, 2 and 3 are often in MiToS stages 0 or 1. We found that King’s Stage 4 corresponds to MiToS stages 2, 3 and 4, and about 80–90% of the disease course. The benefit of MiToS staging in differentiating later stages of disease is in contrast to the ALSFRS-R scores from which it was derived, that exhibits a floor effect and lack of sensitivity in the later stages (Citation10–12) i.e. by combining information from different parts of the ALSFRS-R, MiToS staging is able to provide value over and above the ALSFRS-R score as a functional indicator for disease progression.
A limitation of this study is its use of clinical trial data rather than clinic or population data. However, this may be advantageous, as results are more likely to be relevant to daily clinical practice. We have previously shown that clinical trial data show a shift towards a greater proportion of disease-course passed for a given stage (Citation13). This occurrence is probably a result of left censoring due to the population being selected for trial participation and sourced from a biased clinic population.
The two disease staging systems described are complementary rather than redundant, and provide different types of information. King’s staging summarises the clinical or anatomical spread of disease, while MiToS staging summarises the functional burden of disease. A similar situation exists for cancers. The American Joint Committee on Cancer’s TNM scale allocates a score for size, lymph node infiltration and metastasis as a functional indicator for disease progression (Citation17), and this is combined with grouping of patients into one of four clinical stages that determine overall disease progression. King’s stage prefixed K, and MiToS stage prefixed M, would allow a concise summary of disease spread and functional burden. We therefore propose using both to describe ALS stage.
Declaration of interest
AAC is a consultant for Mitsubishi-Tanabe Pharma, GSK, and Chronos Therapeutics, and chief investigator for clinical trials for Cytokinetics and OrionPharma.
Acknowledgements
This is work from two EU Joint Programme - Neurodegenerative Disease Research (JPND) projects (STRENGTH, ALS-CarE). The projects are supported through the following funding organisations under the aegis of JPND - www.jpnd.eu (United Kingdom, Medical Research Council and Economic and Social Research Council). AAC receives salary support from the National Institute for Health Research (NIHR) Dementia Biomedical Research Unit at South London and Maudsley NHS Foundation Trust and King’s College London. The work leading up to this publication was funded by the European Community’s Health Seventh Framework Programme (FP7/2007–2013; grant agreement number 259867).
References
- Knibb JA, Keren N, Kulka A, Leigh PN, Martin S, Shaw CE, et al. A clinical tool for predicting survival in ALS. J Neurol Neurosurg Psychiatry. 2016; 87:1361–7.
- Johnston CA, Stanton BR, Turner MR, Gray R, Blunt AH, Butt D, et al. Amyotrophic lateral sclerosis in an urban setting: a population based study of inner city London. J Neurol. 2006;253:1642–3.
- Sinaki M, Mulder DW. Rehabilitation techniques for patients with amyotrophic lateral sclerosis. Mayo Clin Proc. 1978;53:173–8.
- Hillel AD, Miller RM, Yorkston K, McDonald E, Norris FH, Konikow N. Amyotrophic lateral sclerosis severity scale. Neuroepidemiology. 1989;8:142–50.
- Riviere M, Meininger V, Zeisser P, Munsat T. An analysis of extended survival in patients with amyotrophic lateral sclerosis treated with riluzole. Arch Neurol. 1998;55:526–8.
- Lacomblez L, Bensimon G, Douillet P, Doppler V, Salachas F, Meininger V. Xaliproden in amyotrophic lateral sclerosis: early clinical trials. Amyotroph Lateral Scler Other Motor Neuron Disord. 2004;5:99–106.
- Puentes F, Topping J, Kuhle J, van der Star BJ, Douiri A, Giovannoni G, et al. Immune reactivity to neurofilament proteins in the clinical staging of amyotrophic lateral sclerosis. J Neurol Neurosurg Psychiatry. 2014;85:274–8.
- Oh J, An JW, Oh SI, Oh KW, Kim JA, Lee JS, et al. Socioeconomic costs of amyotrophic lateral sclerosis according to staging system. Amyotroph Lateral Scler Frontotemporal Degener. 2015;16:202–8.
- Brooks BR, Miller RG, Swash M, Munsat TL. World Federation of Neurology Research Group on Motor Neuron D. El Escorial revisited: revised criteria for the diagnosis of amyotrophic lateral sclerosis. Amyotroph Lateral Scler Other Motor Neuron Disord. 2000;1:293–9.
- Chio A, Hammond ER, Mora G, Bonito V, Filippini G. Development and evaluation of a clinical staging system for amyotrophic lateral sclerosis. J Neurol Neurosurg Psychiatry. 2015;86:38–44.
- Roche JC, Rojas-Garcia R, Scott KM, Scotton W, Ellis CE, Burman R, et al. A proposed staging system for amyotrophic lateral sclerosis. Brain. 2012;135:847–52.
- Cedarbaum JM, Stambler N, Malta E, Fuller C, Hilt D, Thurmond B, et al. The ALSFRS-R: a revised ALS functional rating scale that incorporates assessments of respiratory function. BDNF ALS Study Group (Phase III). J Neurol Sci. 1999;169:13–21.
- Balendra R, Jones A, Jivraj N, Steen IN, Young CA, Shaw PJ, et al. Use of clinical staging in amyotrophic lateral sclerosis for phase 3 clinical trials. J Neurol Neurosurg Psychiatry. 2015;86:45–9.
- Group UK-LS, Morrison KE, Dhariwal S, Hornabrook R, Savage L, Burn DJ, et al. Lithium in patients with amyotrophic lateral sclerosis (LiCALS): a phase 3 multicentre, randomised, double-blind, placebo-controlled trial. Lancet Neurol. 2013;12:339–45.
- Ferraro D, Consonni D, Fini N, Fasano A, Del Giovane C, Emilia Romagna Registry for ALSG, et al. Amyotrophic lateral sclerosis: a comparison of two staging systems in a population-based study. Eur J Neurol. 2016;23:1426–32.
- Landis JR, Koch GG. The measurement of observer agreement for categorical data. Biometrics. 1977;33:159–74.
- Edge SB, Compton CC. The American Joint Committee on Cancer: the 7th edition of the AJCC cancer staging manual and the future of TNM. Ann Surg Oncol. 2010;17:1471–4.