
Abstract
Interleukin-6 (IL6) expression increases in atrophying muscles and lung tissue during compromised function. Considering ALS patients undergo these same pathological changes, IL6 levels may be relevant for prognostication and treatment. The amount of soluble IL6 receptor, dictated by the IL6R358Ala variant, and local tissue environment in which IL6 signaling occurs is known to influence the ultimate effects of IL6 in multiple diseases. In this longitudinal study, we show that serum IL6 levels negatively correlate both with the patient’s functional status as measured by the overall ALSFRS-R and subscores, and with respiratory function as measured by the percent predicted FVC (ppFVC). The correlations are only present in the two-thirds of patients who carry the IL6R358Ala variant that mediates pro-inflammatory transsignaling in the cases of ALSFRS-R limb and respiratory subscores and ppFVC. These results suggest that some observed associations between IL6 and ALS are driven by the subset of patients carrying the IL6R358Ala variant and thus that any IL6-targeted therapeutic approaches may be more advantageous when aimed at this group. Specifically, with relation to respiratory decline, these patients may benefit from closer respiratory follow-up and early initiation of noninvasive ventilation.
1. Introduction
Amyotrophic lateral sclerosis (ALS) is a uniformly fatal disease of unknown pathogenesis and a highly variable rate of progression (Citation1,Citation2). The rate of clinical progression could be explained by differences in the multisystem inflammatory components of ALS (Citation3). While several cytokines are reported to have increased expression in ALS, interleukin 6 (IL6) stands out as an intriguing biomarker and therapeutic target and has thus become a focus of research and a recent clinical trial (NCT02469896). IL6 is a multi-functional cytokine that influences diverse cellular mechanisms, many key in ALS pathology (Citation4–8). Multiple groups have shown patients with ALS exhibit elevated IL6 in serum and CSF (Citation9–13) that may correlate with muscle atrophy and compromised lung function (Citation14–21), pathologies experienced by all ALS patients.
The ultimate effect of IL6 is determined both by the target cell and the receptor type activated (Citation22). In contrast to classical signaling through the membrane-bound IL6 receptor, IL6 transsignaling occurs by binding to a circulating soluble receptor (sIL6R), cleaved from specific cell surfaces by proteases, which can then, as a complex, bind to any cell expressing the near ubiquitous gp130 molecule (Citation8). Cleavage of the IL6 receptor to produce sIL6R is tightly controlled by a genotypic mechanism involving a single nucleotide polymorphism, the IL6R358Ala variant, in the receptor sequence at the interface of the cell membrane, resulting in a dose-dependent increase of the sIL6R in bodily fluids with presence of one or two copies of the variant (the “C”) allele; individuals with no copies of the variant allele have the AA genotype (Citation16).
With a minor allele frequency of 0.39, the IL6R358Ala variant is present in approximately 2/3 of those with European ancestry, consistent with the cohort in this study (Citation13,Citation23). The presence of the IL6R358Ala variant has been shown to be a modifier of respiratory compromise in individuals with respiratory conditions and can predict responsiveness to anti-IL6 therapies in chronic inflammatory conditions (Citation24,Citation25). Transsignaling is proposed to be the pathologic mechanism for IL6 in the nervous system (Citation26), and may regulate much of the circulating IL6 observed in ALS patients, possibly modifying disease progression (Citation13). Indeed, we have previously shown that the increase in IL6 in ALS is driven by patients who carry the IL6R358Ala variant and that this same group has faster disease progression in the first year after symptom onset (Citation13). Here we sought to determine whether, in the known setting of increased IL6 in ALS, various measures of functional decline in ALS patients are different between IL6R358Ala variant allele groups.
Increased circulating levels of IL6 are associated with changes in metabolism, cell stress, and inflammatory/immune responses, including those in denervated and atrophied muscle with similar processes expected in the pulmonary compartment (Citation27,Citation28). Using IL6 gene expression data in tissue from the SOD1 mouse model of ALS, our lab has confirmed the potential for both denervated skeletal muscle and lung parenchyma to serve as production sites of IL6 during ALS (data not shown). To further understand the temporality of this correlation, we investigated IL6 levels before and after severe respiratory insufficiency (here defined as ppFVC < 55%). Spirometry values, including FVC, are often expressed as the percent predicted for a specific patient’s age, height, sex and ethnicity [NHANES III (Citation29)] reflecting the average predicted value for that individual if they were healthy and thus are more clinically useful than discrete volumes of vital capacity. Above ppFVC 55%, IL6 production is likely due to skeletal muscle denervation without a substantial contribution from respiratory compromise and atelectasiss (Citation14,Citation30–36). Skeletal muscle production of IL6 should also continue throughout disease as a product of atrophying muscle, as has been seen in other disease with chronic inflammatory states (Citation37–40).
ALS is characterized in research and clinical evaluation by changes in the Revised ALS Functional Rating Scale (ALSFRS-R) and respiratory function [spirometry, specifically forced vital capacity (FVC)]. A reliable serum and/or genetic biomarker which could explain contributions to the variable decline in one or more clinical measure of ALS would allow for improved prognosis and could identify potential molecular targets for therapeutic intervention in specific subgroups.
2. Materials and methods
2.1. Subjects
All subjects were unrelated persons of self-reported European ancestry (97 subjects, M:F = 64:33). Genetic status regarding disease causative mutations (e.g. SOD1, C9ORF) was unknown for the majority of patients, therefore those patients with known familial ALS were not excluded (n = 28 visits from 10 individuals). Inclusion criteria were any patient 18 and older with a probable or definite diagnosis of ALS (Citation41) as determined by two independent neuromuscular disease specialists; Awaji criteria were not routinely tested for. Exclusion criteria consisted of a current diagnosis of any co-existing neurological diseases, inability to provide informed consent, known ppFVC < 80% prior to ALS diagnosis, and the current use of tocilizumab. Clinical data for all subjects were collected at the Wake Forest ALS Center during routine clinical practice, de-identified, and entered into the Wake Forest ALS Biorepository database by research staff. All subjects provided informed consent as required by the Wake Forest School of Medicine Institutional Review Board (IRB00015673).
2.2. Serum samples
De-identified blood samples were collected by venipuncture during routine consecutive clinic visits for up to four visits. Serum was separated from whole blood within an hour of collection by centrifugation (2500rpm at 23° C) and stored at −80° C. Prior to assays, thawed aliquots were cleared by 10-min centrifugation at 18,000×g at 4 °C. Protein concentrations for serum were determined using bicinchoninic acid assay total protein assay (Thermo Scientific, Waltham, MA, USA, 23225) to assure that the sample protein content fell within normal range for adults (serum 6.4–8.3 g/dl).
2.3. ELISA assays
IL6 protein levels were measured in triplicate with commercial kits according to manufacturer’s instructions with appropriate dilutions (R&D Systems, Minneapolis, MN, USA, Q6000B). Plates were read on a Wallac plate reader. The lower detection limit of the utilized assay is reported by the manufacturer to be 0.16 pg/mL. Intra- and inter-assay precisions were determined experimentally using a single consistent sample across assays to be <5.8% and <6.8%, respectively.
2.4. Genotyping of IL6R Ala358 variant rs2228145
DNA was purified from whole blood using the Qiagen AutoPure LS using standard Purgene chemistry. DNA was then genotyped using a validated TaqMan assay for the IL6R variant rs2228145 according to manufacturer’s instructions (Applied Biosystems, USA, assay ID: C_16170664_10; IL6R Ala358 variant) and read using the allelic discrimination protocol on an rtPCR System (Applied Biosystems, Foster City, CA, USA, model 7500). Positive controls for each genotype and three no template controls (blanks) were run for each assay set.
2.5. Measures of disease progression
For each clinic visit where repository samples were collected, a clinical research nurse recorded the subject’s ppFVC and ALSFRS-R global (0–48 points) and subscores (limb, bulbar, and respiratory) to quantify disability and symptoms as previously described (Citation42). ppFVC was determined by one of two neuromuscular respiratory therapists on handheld spirometry (EasyOne Air, NDD Medical Technologies, Andover, MA, USA) with the best of three measurements recorded. If the patient was noted to be cognitively limited during spirometry measurements or was unable to perform a maximal effort due to bulbar symptoms this was noted by the therapist and the data was later excluded from this study. Laboratory research staff were given de-identified biological samples along with the corresponding clinical data so as to maintain blinded experimenters. Eighteen patient visits did not include information for ALSFRS-R or FVC and therefore were not included in the respective analyses dependent on those parameters.
Because the delineating value of ppFVC ≤ 55% is not a strict cutoff for diaphragmatic paralysis in ALS and because FVC measurements may be influenced by a patient’s effort we also performed all computations that were split by this value at ppFVC ≤ 60%, ≤50%, and ≤45%. We found no change in the statistical significance of our results and were thus able to determine that ppFVC ≤ 55% was most reflective of the overall pattern.
2.6. Statistical analyses
Demographic and disease characteristic comparison p-values for *C vs AA groups were determined by Chi-square tests of independence or student’s two tailed t-tests where appropriate. Prior to analyses, serum IL6 levels were winsorized to within two standard deviations of the mean of the cohort as a whole to limit the influence of any highly outlying values (14 of 300 total values winsorized). All data were non-normally distributed, thus Spearman’s correlations were performed on the experimentally determined and clinically collected values described above. Because prior evidence has shown that the effect of the C allele may be strongest in those patients with fast progressing disease (Citation13), to maintain within the dataset those 18 patients where only one visit was recorded, each visit was evaluated as a discrete data point unrelated to patient ID for sections 3.3–3.5. Student’s one-tailed t-test was used to compare groups for rtPCR.
For linear regressions, patient ID was used longitudinally as a random effect using REML method in the 79 patients with multiple visits. The following effects were entered into a multiple regression model: IL6 (pg/mL), age at the time of visit (years), sex, diagnostic delay from symptom onset to diagnosis (in months, termed “dd”), presence of the C allele, and site of onset (bulbar or non, termed “site”). Those effects with p ≤ 0.2 were retained for the final model as reported for the case of each identified variable of interest. 95% confidence intervals are reported for those effects that were statistically significant in the final model.
Values of p < 0.05 were considered to be statistically significant. Analysis and graphs generated with JMP Genomics 9 software (SAS studio).
3. Results
3.1. Patient cohort
contains demographic and disease-specific information for this patient cohort, which is similar in makeup with respect to gender, age, and location of onset of disease to both many large population-based studies of ALS and randomized controlled trials in ALS (Citation43–48). There were no significant differences when comparing demographic and disease-specific information between *C and AA groups, notably sex, site of onset, age, and disease duration.
Table 1 Demographics for patients used in correlations ().
Table 2 Demographics for patients used in repeated measures regression model.
3.2. Longitudinally, serum IL6 negatively correlates with overall patient function as measured by ALSFRS-R global, respiratory, and limb subscores in all ALS patients
To determine if there is a relationship between serum IL6 and clinical disease measures that is maintained over time, we examined the visits for 79 patients with multiple study visits longitudinally (). These analyses confirm that IL6 negatively correlates with ALSFRS-R global (p = 0.001), limb (p = 0.004), and respiratory scores (p = 0.039) (). While the relationship between IL6 and ppFVC was not statistically significant it was retained in the final model and has a p value of 0.15. In line with previous findings (Citation21,Citation49–52), shorter time between symptom onset and diagnosis was correlated with faster progression of ALSFRS-R respiratory subscore (p = 0.09) and older age was correlated with faster progression of ppFVC (p = 0.021) ().
Table 3 Regression models.
3.3. ALS patients have a negative correlation between ALSFRS-R and serum IL6
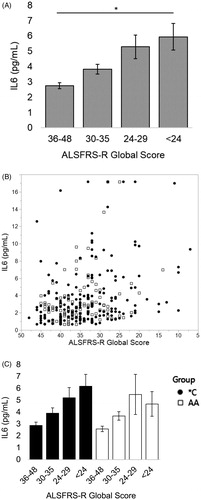
To determine if subjective measures of patient function correlate with IL6 we looked at the relationship between ALSFRS-R and serum IL6 for 97 patients across 295 visits. We found a significant negative correlation between ALSFRS-R global score and serum IL6 (; Spearman’s correlation, rho= −0.2968, p < 0.0001, n = 295 visits represented as a scatterplot with ALSFRS-R score in ). When encounters were divided into groups of patients carrying the IL6R358Ala variant C allele (CC and AC, referred to from hereon as *C) or not (AA), the negative correlation was significant for both groups (; Spearman’s correlation *C, blue, rho= −0.3093, p < 0.0001, n = 184; AA, red, rho= −0.2612, p = 0.0056, n = 111).
Figure 1 As ALSFRS-R score worsens, serum IL6 increases; this relationship exists for all patients but is more predictable across those with the C allele. (A) Patients who have lost over half the possible points on the ALSFRS-R scale on average have double the serum IL6 as someone who has lost less than a quarter of the available points (“<24” vs “36–48” *p < 0.001; student’s t-test); mean values left to right (n#): 2.75 (136), 3.82 (89), 5.29 (45), 5.94 (25). (B) Scatterplot of data tested. (C) The elevation in serum IL6 with worsening (decreasing) ALSFRS score is maintained more consistently for individuals with the C allele at worsened scores. Mean values from left to right (n#) for *C: 2.88 (77), 3.91 (54), 5.21 (32), 6.18 (21). Mean values from left to right (n#) for AA: 2.59 (59), 3.68 (35), 5.49 (13), 4.69 (4); Spearman correlations: all patients rho= −0.2968, p < 0.0001; *C rho= −0.3093, p < 0.0001; AA rho= −0.2612, p = 0.0056.
3.4. In patients carrying the IL6R358Ala variant, serum IL6 negatively correlates with ALSFRS-R limb subscore
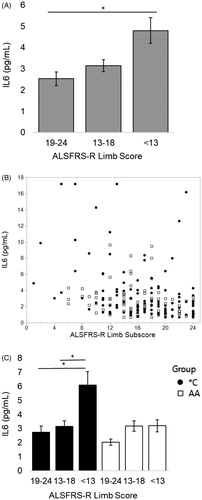
For all visits, IL6 has a significant negative correlation with ALSFRS-R limb subscore (Spearman’s correlation, rho= −0.3067, p < 0.001). Looking at these visits where ppFVC is above 55% there is a significant negative correlation between ALSFRS-R limb subscore and serum IL6 for all subjects (; Spearman’s correlation, rho= −0.3251, p < 0.0001; n = 189 visits represented as a scatterplot with ALSFRS-R limb subscore in ). This negative correlation is only significant for *C patients (; Spearman’s correlation *C, blue, rho= −0.3679, p < 0.0001, n = 115; AA, red, p = 0.0567, n = 74). There is not a relationship between IL6 and the ALSFRS-R respiratory subscore (p = 0.481) or between IL6 and ppFVC (p = 0.436) for any group or subgroup of patients with ppFVC > 55%.
Figure 2 When ppFVC > 55% (before severe respiratory insufficiency), as ALSFRS-R limb subscore worsens, serum IL6 increases. When divided by presence of the C allele, this relationship is only significant for *C patients. (A) Patients who have lost over half the possible limb subscore points on the ALSFRS-R scale on average have nearly double the serum IL6 as someone who has lost less than a quarter of the available points (“<13” vs “19–24” *p < 0.001, student’s t-test); mean values from left to right (n#): 2.53 (63), 3.15 (81), 4.80 (45). (B) Scatterplot of analyzed data. (C) The elevation in serum IL6 with worsening (decreasing) ALSFRS limb subscore for is apparent for individuals with the C allele with a doubling of the average serum IL6 after a patient is at or below the half-of-normal ALSFRS-R limb subscore (“19–24” vs “13–18” and “19–24” vs “<13” *p < 0.001, student’s t-test). Mean values from left to right (n #) for *C: 2.73 (45), 3.14 (45), 6.08 (25). Mean values from left to right (n #) for AA: 2.02 (18), 3.17 (36), 3.19 (20). Spearman correlations: all patients rho= −0.3251, p < 0.0001; *C rho= −0.3679, p < 0.0001; AA p = 0.0567.
3.5. In patients carrying the IL6R358Ala variant, serum IL6 negatively correlates with subjective and objective measures of respiratory function after the patient has severe respiratory insufficiency
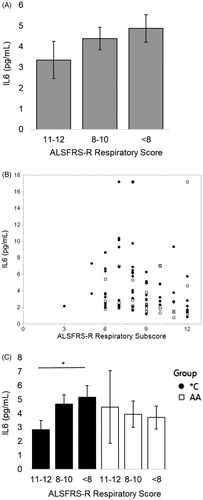
For all visits, IL6 has a significant negative correlation with ALSFRS-R respiratory subscore (Spearman’s correlation, rho= −0.2210, p < 0.001). For visits where ppFVC ≤ 55%, IL6 increased in a manner associated with a decrease in subjective lung function as measured by a decreasing ALSFRS-R respiratory subscore (; Spearman correlation, rho= −0.3060, p = 0.0034; n = 90 visits represented as a scatterplot with ALSFRS-R respiratory subscore in ). This negative correlation exists only for *C patient visits (; Spearman’s correlation: *C, blue, rho= −0.3114, p = 0.0146, n = 61; AA, red, p = 0.141, n = 29).
Figure 3 When ppFVC ≤ 55% (severe respiratory insufficiency), as ALSFRS-R respiratory subscore worsens, serum IL6 increases. When divided by presence of the C allele, this relationship is only significant for *C patients. (A) Patients who have lost at least 1/3 of the points on the respiratory subscale (“<8”) have a 31% increase in their serum IL6 from patients with little to no subjective respiratory impairment (“11–12”). Mean values from left to right (n#): 3.35 (19), 4.38 (42), 4.87 (29). (B) Scatterplot of analyzed data. (C) Patients with the C allele who have lost at least 1/3 of the points on the respiratory subscale have an average 45% increase in their serum IL6 from patients with little to no subjective respiratory impairment (“<8” vs “11–12” *p = 0.05, student’s t-test). Mean values from left to right (n#) for *C: 2.84 (10), 4.67 (19), 5.17 (32). Mean values from left to right (n#) for AA: 4.46 (16), 3.94 (4), 3.71 (9). Spearman correlations: all patients rho= −0.3060, p = 0.0034; *C rho= −0.3114, p = 0.0146; AA p = 0.141.
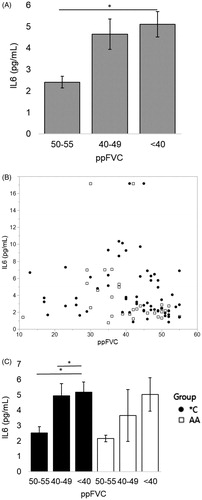
Objectively, as measured by a further decreasing ppFVC, for all visits IL6 has a significant negative correlation with ppFVC (Spearman’s correlation, rho= −0.1928, p < 0.001). For visits where ppFVC ≤ 55%, serum IL6 also increased with a decrease in lung function (; Spearman correlation, rho= −0.3082, p = 0.0030; n = 91 visits represented as a scatterplot with ppFVC in ). Similar as for ALSFRS-R, within IL6R genotype subgroup the negative correlation between IL6 and ppFVC is only significant in *C patients (Spearman correlation: *C, blue, rho= −0.3119, p = 0.0144, n = 61; AA, red, p = 0.070, n = 30). While global hypoxia (measured by SpO2) may be a driving factor behind IL6 levels (Citation11), we found no significant relationship with SpO2 and IL6 in this study (p = 0.35).
Figure 4 After ppFVC ≤ 55%, IL6 increases with lower values of ppFVC. When divided by presence of the C allele, this relationship is significant only for *C patients. (A) On average, patients have over 100% increase in serum IL6 when 10–15 percentage points are lost from ppFVC after reaching ppFVC ≤ 55% (“<40” vs “50–55” *p < 0.01, student’s t-test). Mean values from left to right (n#): 2.41 (21), 4.64 (37), 5.11 (33). (B) Scatterplot of analyzed data. (C) The elevation in serum IL6 with worsening (decreasing) ppFVC is maintained significantly for patients with the C allele; those *C individuals have a significant increase in IL6 just after reaching severe respiratory failure (“50–55” vs “40–50” and “50–55” vs “<40” *p < 0.05). Mean values from left to right (n#) for *C: 2.54 (14), 4.96 (28), 5.17 (19). Mean values from left to right (n#) for AA: 2.17 (7), 3.66 (9), 5.03 (14). Spearman correlations: all patients rho= −0.3082, p = 0.0030; *C rho= −0.3119, p = 0.0144; AA p = 0.070.
Of note, the relationship between limb score and IL6 does still exist for visits where ppFVC ≤ 55% (rho= −0.2203, p = 0.0369) possibly reflective of a continuum of disease processes. However, it has an effect size (equivalent to the rho) that is smaller than that for the respiratory scores, and for limb subscores prior to ppFVC dropping below 56%.
4. Discussion
Identification of predictive biomarkers in ALS is an active area of research. However, in complex neurodegenerative diseases such as ALS, fluctuations in levels of an individual marker are unlikely to be associated with a single pathological event. Here, we presented data suggesting that IL6 can serve as a molecular marker, both for overall decline and when combined with other clinical indicators for the various deteriorating processes at work during a specific period in disease. This was confirmed to be true also when following a cohort of patients longitudinally. IL6 is able to reflect distinct aspects of ALS because, in concert with its various receptors and cellular sources, it guides and responds to distinct cellular functions. In neurodegenerative diseases, synaptic dysfunction has been proposed to be an early event, and in both animal models and ALS patients, neuromuscular denervation precedes many non-autonomous cellular events (Citation53–55). Muscle atrophy that follows denervation is associated with increased expression of IL6 (Citation3,Citation14,Citation17,Citation37,Citation56,Citation57).
While the initial loss of and decrease in respiratory function is purely neuromuscular, as alveoli are continually sub-maximally inflated, a process of microatelectasis and local tissue hypoxia can trigger release of IL6 within the lung parenchyma (Citation58,Citation59). Once local IL6 production is turned on, transsignaling can propagate tissue damage to parts of the lung tissue that are still functioning, resulting in hyperplasia of smooth muscle cells thus creating obstruction of small airways that further worsens loss of functional parenchyma (Citation16,Citation60,Citation61). Therefore, we hypothesize that it is once severe respiratory insufficiency is experienced and the IL6 “trigger” has been flipped on that circulating IL6 will demonstrate a negative relationship with respiratory function. Our lab has found that lung tissue from the SOD1 mouse model of ALS is a source of IL6 at end stage (data not shown), which has been shown to be a time where the animal experiences significant respiratory insufficiency as measured by FVC (Citation27,Citation62). In cases of bilateral diaphragmatic paralysis in human patients, supine FVC has been reported to be reduced by 45–55% (Citation30–33). Thus, after ppFVC has dropped below 56%, we expect pathologic processes stemming from microatelectasis in the lungs to make a larger contribution to overall serum IL6 levels. Serial pulmonary function tests in ALS patients show a progressive reduction in the FVC that accelerates toward the end of the disease and previous research has shown that higher IL6 levels are associated with impending respiratory failure (Citation21,Citation63). In accordance with this previous evidence and the data presented here, we propose that as severe respiratory insufficiency sets in, increases in IL6 will reflect further loss of FVC.
While our initial longitudinal analyses of the relationship between ppFVC and IL6 were not statistically significant (p = 0.15), we feel that it is worth mentioning that this may be due to the fact that this analysis included all visits, both before and after ppFVC was below 56%. Due to limitations on subject numbers from having to exclude patients with only one visit from the longitudinal model, if we had limited the linear regression to only include those patients with ppFVC below 56%, our power would be such that revealing any relationship would be severely restricted. Future studies should make efforts to recruit patients such that they can be stratified with multiple visits above and below these values. Given the evidence presented here, comparing the relationship between IL6 and ppFVC in the same patients before and after severe respiratory insufficiency will be especially revealing. While patients with known reductions in FVC were excluded from this study, it is worth noting that undiagnosed pulmonary pathology could have influenced respiratory progression in any subset of patients; thus further studies on this subject should make efforts to either exclude or stratify patients with prior chronic pulmonary diseases.
Virtually, all ALS patients experience weakness of the respiratory muscles, both those of the chest wall and the diaphragm, leading to respiratory failure (Citation64). In neuromuscular respiratory failure, patients’ lungs are repeatedly underinflated, causing alveolar hypoventilation and chronic microatelectasis (Citation58,Citation65–67). IL6 is released in local hypoxic conditions (Citation59), such as atelectasis, and is associated with injury even in non-atelectatic lung regions, worsening parenchymal loss (Citation60). It has been reported that IL6 transsignaling also causes the hyperplasia of airway smooth muscle cells (Citation61). As expected, it is those patients with greater amounts of sIL6R (*C) who have a significant relationship between experienced and/or objectively measured respiratory function and circulating IL6. It is important to note that the hypoxic conditions referred to are those within the microenvironment of affected alveoli and that we do not claim a global hypoxic state in ALS.
We have shown that IL6 negatively correlates with discrete measures of functional performance in ALS patients, both at individual visits and longitudinally. The relationship holds only for, and thus is likely driven at least in part by, the *C genotype patients; those patients who have potential for greater transsignaling when IL6 is elevated. In fact, IL6 and diagnostic delay are the only two factors explored in the longitudinal model that are significant for ALSFRS global, respiratory, and limb scores and with ppFVC. These 2 factors do not correlate with each other (p = 0.85 as discrete factors, p = 0.35 for longitudinal analysis) indicating that they are independent of one another. Inhibition of IL6 at its site of production and detrimental action (skeletal muscle or within the lung) may be beneficial in this subset of patients. As *C patients show negative relationships between IL6 and dual measures of respiratory function, they may benefit from closer respiratory follow-up as their respiratory decline has the potential to be steeper when IL6 is elevated. Finally, earlier initiation of noninvasive ventilation in *C patients could reduce the propagation of atelectasis mediated by IL6 transsignaling (Citation60). Further studies characterizing the specific response of *C patients to NIV, both functionally and as reflected by IL6, are needed.
Acknowledgements
The authors thank T Johnston-Crews and M Marandi for help in patient recruitment and medical record coordination, and J Strupe, P Arounleut, M Lyon for help in sample organization and processing.
Declaration of interest
The authors report no conflict of interest.
Additional information
Funding
References
- Swinnen B, Robberecht W. The phenotypic variability of amyotrophic lateral sclerosis. Nat Rev Neurol. 2014;10:661–70.
- Harrison D, Mehta P, van Es MA, Stommel E, Drory VE, Nefussy B, et al; Pooled Resource Open-Access ALS Clinical Trials Consortium. “ALS reversals”: demographics, disease characteristics, treatments, and co-morbidities. Amyotroph Lateral Scler Frontotemporal Degener. 2018;19:495–9.
- Lyon MS, Wosiski-Kuhn M, Gillespie R, Caress J, Milligan C. Inflammation, immunity, and amyotrophic lateral sclerosis: I. Etiology and pathology. Muscle Nerve. 2019;59:10–22.
- Yoshida H, Hashizume M, Suzuki M, Mihara M. Anti-IL-6 receptor antibody suppressed T cell activation by inhibiting IL-2 production and inducing regulatory T cells. Eur J Pharmacol. 2010;634:178–83.
- Teague TK, Marrack P, Kappler JW, Vella AT. IL-6 rescues resting mouse T cells from apoptosis. J Immunology. 1997;158:5791–6.
- Rose-John S, Neurath MF. IL-6 trans-signaling: the heat is on. Immunity. 2004;20:2–4.
- Rincon M, Anguita J, Namakura T, Fikrig E, Flavell RA. Interleukin (IL)-6 directs the differentiation of IL-4 producing CD4+ T cells. J Exp Med. 1997;185:178–83.
- Lissilaa R, Buatois V, Magistrelli G, Williams AS, Jones GW, Herren S, et al. Although IL-6 trans-signaling is sufficient to drive local immune responses, classical IL-6 signaling is obligate for the induction of T cell-mediated autoimmunity. J Immunol. 2010;185:5512–21.
- Ono S, Hu J, Shimizu N, Imai T, Nakagawa H. Increased interleukin-6 of skin and serum in amyotrophic lateral sclerosis. J Neurol Sci. 2001;187:27–34.
- Sekizawa T, Openshaw H, Ohbo K, Sugamura K, Itoyama Y, Niland JC. Cerebrospinal fluid interleukin 6 in amyotrophic lateral sclerosis: immunological parameter and comparison with inflammatory and non-inflammatory central nervous system diseases. J Neurol Sci. 1998;154:194–9.
- Moreau C, Devos D, Brunaud-Danel V, Defebvre L, Perez T, Destee A, et al. Elevated IL-6 and TNF-alpha levels in patients with ALS: inflammation or hypoxia? Neurology. 2005;65:1958–60.
- Mizwicki MT, Fiala M, Magpantay L, Aziz N, Sayre J, Lui G, et al. Tocilizumab attenuates inflammation in ALS patients through inhibition of IL6 receptor signaling. Am J Neurodegen Dis. 2012;1:305–15.
- Wosiski-Kuhn M, Robinson M, Strupe J, Arounleut P, Martin M, Caress J, et al. IL6 receptor(358)Ala variant and trans-signaling are disease modifiers in amyotrophic lateral sclerosis. Neurol Neuroimmunol Neuroinflamm. 2019;6:e631.
- Munoz-Canoves P, Scheele C, Pedersen BK, Serrano AL. Interleukin-6 myokine signaling in skeletal muscle: a double edged sword? FEBS J. 2013;280:4131–48.
- Lahiri T, Laporte JD, Moore PE, Panettieri RA, Shore SA. Interleukin-6 family cytokines: signaling and effects in human airway smooth muscle cells. Am J Physiol Lung Cell Mol Physiol. 2001;280:1225–32.
- Robinson MB, Deshpande DA, Chou J, Cui W, Smith S, Langefeld C, et al. IL6 trans-signaling increases expression of airway disease genes in airway smooth muscle. Am J Physiol Lung Cell Mol Physiol. 2015;309:129–38.
- Visser M, Pahor M, Taaffe DR, Goodpaster BH, Simonsick EM, Newman AB, et al. Relationship of interleukin-6 and tumor necrosis factor a with muscle mass and muscle strength in elderly men and women. J Gerontol A Biol Sci Med Sci. 2002;57:326–32.
- Doganci A, Eigenbrod T, Krug N, De Sanctis GT, Hausding M, Erpenbeck VJ, et al. The IL-6R alpha chain controls lung CD4 + CD25+ Treg development and function during allergic airway inflammation in vivo. J Clin Invest. 2005;115:313–25.
- Gimeno D, Delclos GL, Ferrie JE, De Vogli R, Elovainio M, Marmot MG, et al. Association of CRP and IL-6 with lung function in a middle-aged population initially free from self-reported respiratory problems: the Whitehall II study. Eur J Epidemiol. 2011;26:135–44.
- Kobayashi T, Tanaka K, Fujita T, Umezawa H, Amano H, Yoshioka K, et al. Bidirectional role of IL-6 signal in pathogenesis of lung fibrosis. Respir Res. 2015; 6:99.
- Pronto-Laborinho A, Pinto S, Gromicho M, Pereira M, Swash M, de Carvalho M. Interleukin-6 and amyotrophic lateral sclerosis. J Neurol Sci. 2019;398:50–3.
- Scheller J, Chalaris A, Schmidt-Arras D, Rose-John S. The pro- and anti-inflammatory properties of the cytokine interleukin-6. Biochim Biophys Acta. 2011;1813:878–88.
- van Dongen J, Jansen R, Smit D, Hottenga JJ, Mbarek H, Willemsen G, et al; AAGC Collaborators. The contribution of the functional IL6R polymorphism rs2228145, eQTLs and other Genome-wide SNPs to the heritability of plasma sIL-6R levels. Behav Genet. 2014;44:368–82.
- Hawkins GA, Robinson MB, Hastie AT, Li X, Li H, Moore WC, et al.; National Heart, Lung, and Blood Institute–sponsored Severe Asthma Research Program (SARP). The IL6R variation Asp(358)Ala is a potential modifier of lung function in subjects with asthma. J Allergy Clin Immunol. 2012;130:510–5.
- Enevold C, Baslund B, Linde L, Josephsen NL, Tarp U, Lindegaard H, et al. Interleukin-6-receptor polymorphisms rs12083537, rs2228145, and rs4329505 as predictors of response to tocilizumab in rheumatoid arthritis. Pharmacogenet Genomics. 2014;24:401–5.
- Campbell IL, Erta M, Lim ML, Frausto R, May U, Rose-John S, et al. Trans-signaling is a dominant mechanism for the pathogenic actions of interleukin-6 in the brain. J Neurosci. 2014;34:2503–13.
- Stoica L, Keeler AM, Xiong L, Kalfopoulos M, Desrochers K, Brown Jr RH, et al. Restrictive lung disease in the Cu/Zn superoxide-dismutase 1 G93A amyotrophic lateral sclerosis mouse model. Am J Respir Cell Mol Biol. 2017;56:405–8.
- Tankersley CG, Haenggeli C, Rothstein JD. Respiratory impairment in a mouse model of amyotrophic lateral sclerosis. J Appl Physiol (1985). 2007;102:926–32.
- Hankinson JL, Odencrantz JR, Fedan KB. Spirometric reference values from a sample of the general U.S. population. Am J Respir Crit Care Med. 1999;159:179–87.
- Kokatnur L, Rudrappa M. Diaphragmatic palsy. Diseases 2018;6:16.
- Laroche CM, Carroll N, Moxham J, Green M. Clinical significance of severe isolated diaphragm weakness. Am Rev Respir Dis. 1988;138:862–6.
- Pereira MC, Mussi RFM, Massucio R. A d C, Camino AM, Barbeiro A. d S, Villalba W. d O, et al. Idiopathic bilateral diaphragmatic paresis. J Bras Pneumol. 2006;32:481–5.
- D'Aquino LC, Rodrigues SC, Barros JA, Rubin AS, Rosario Filho NA, Pereira CA. Predicting reduced TLC in patients with low FVC and a normal or elevated FEV1/FVC ratio. J Bras Pneumol. 2010;36:460–7.
- Hiscock N, Chan MH, Bisucci T, Darby IA, Febbraio MA. Skeletal myocytes are a source of interleukin-6 mRNA expression and protein release during contraction: evidence of fiber type specificity. FASEB J. 2004;18:992–4.
- Keller P, Keller C, Carey AL, Jauffred S, Fischer CP, Steensberg A, et al. Interleukin-6 production by contracting human skeletal muscle: autocrine regulation by IL-6. Biochem Biophys Res Commun. 2003;310:550–4.
- Kosmidou I, Vassilakopoulos T, Xagorari A, Zakynthinos S, Papapetropoulos A, Roussos C. Production of interleukin-6 by skeletal myotubes: role of reactive oxygen species. Am J Respir Cell Mol Biol. 2002;26:587–93.
- Tsujinaka T, Fujita J, Ebisui C, Yano M, Kominami E, suzuki k, et al. Interleukin 6 receptor antibody inhibits muscle atrophy and modulates proteolytic systems in interleukin 6 transgenic mice. J Clin Invest. 1996;97:244–9.
- van Hees HW, Schellekens WJ, Linkels M, Leenders F, Zoll J, Donders R, et al. Plasma from septic shock patients induces loss of muscle protein. Crit Care. 2011;15:R233.
- Kuroda K, Nakashima J, Kanao K, Kikuchi E, Miyajima A, Horiguchi Y, et al. Interleukin 6 is associated with cachexia in patients with prostate cancer. Urology 2007;69:113–7.
- Shyh-Chang N. Metabolic Changes During Cancer Cachexia Pathogenesis. Adv Exp Med Biol. 2017;1026:233–49.
- Ludolph A, Drory V, Hardiman O, Nakano I, Ravits J, Robberecht W, et al.; WFN Research Group On ALS/MND. A revision of the El Escorial criteria - 2015. Amyotroph Lateral Scler Frontotemporal Degener. 2015;16:291–2.
- Cedarbaum JM, Stambler N, Malta E, Fuller C, Hilt D, Thurmond B, et al. The ALSFRS-R: a revised ALS functional rating scale that incorporates assessments of respiratory function. BDNF ALS Study Group (Phase III). J Neurol Sci. 1999;169:13–21.
- Thakore NJ, Lapin BR, Pioro EP; Pooled Resource Open-Access ALS Clinical Trials Consortium. Trajectories of impairment in amyotrophic lateral sclerosis: insights from the pooled resource open-access ALS clinical trials cohort. Muscle Nerve. 2018;57:937–45.
- Traynor BJ, Alexander M, Corr B, Frost E, Hardiman O. Effect of a multidisciplinary amyotrophic lateral sclerosis (ALS) clinic on ALS survival: a population based study, 1996-2000. J Neurol Neurosurg Psychiatry. 2003;74:1258–61.
- Kaufmann P, Levy G, Thompson JL, Delbene ML, Battista V, Gordon PH, et al. The ALSFRSr predicts survival time in an ALS clinic population. Neurology. 2005;64:38–43.
- Zoccolella S, Beghi E, Palagano G, Fraddosio A, Guerra V, Samarelli V, et al. Predictors of long survival in amyotrophic lateral sclerosis: a population-based study. J Neurol Sci. 2008;268:28–32.
- Millul A, Beghi E, Logroscino G, Micheli A, Vitelli E, Zardi A. Survival of patients with amyotrophic lateral sclerosis in a population-based registry. Neuroepidemiology. 2005;25:114–9.
- Suh MR, Choi WA, Choi YC, Lee JW, Hong JH, Park J, et al. Long-term outcome of amyotrophic lateral sclerosis in Korean subjects. Ann Rehabil Med. 2017;41:1055–64.
- Atassi N, Berry J, Shui A, Zach N, Sherman A, Sinani E, et al. The PRO-ACT database: design, initial analyses, and predictive features. Neurology. 2014;83:1719–25.
- Chio A, Logroscino G, Hardiman O, Swingler R, Mitchell D, Beghi E, et al.; Eurals Consortium. Prognostic factors in ALS: a critical review. Amyotroph Lateral Scler. 2009;10:310–23.
- Javad Mousavi SA, Zamani B, Shahabi Shahmiri S, Rohani M, Shahidi GA, Mostafapour E, et al. Pulmonary function tests in patients with amyotrophic lateral sclerosis and the association between these tests and survival. Iran J Neurol 2014;13:131–7.
- Wang MD, Little J, Gomes J, Cashman NR, Krewski D. Identification of risk factors associated with onset and progression of amyotrophic lateral sclerosis using systematic review and meta-analysis. Neurotoxicology 2017;61:101–30.
- Vinsant S, Mansfield C, Jimenez-Moreno R, Del Gaizo Moore V, Yoshikawa M, Hampton TG, et al. Characterization of early pathogenesis in the SOD1(G93A) mouse model of ALS: part II, results and discussion. Brain Behav. 2013;3:431–57.
- Vinsant S, Mansfield C, Jimenez-Moreno R, Del Gaizo Moore V, Yoshikawa M, Hampton TG, et al. Characterization of early pathogenesis in the SOD1(G93A) mouse model of ALS: part I, background and methods. Brain Behav. 2013;3:335–50.
- Fischer LR, Culver DG, Tennant P, Davis AA, Wang M, Castellano-Sanchez A, et al. Amyotrophic lateral sclerosis is a distal axonopathy: evidence in mice and man. Exp Neurol. 2004;185:232–40.
- Bolin LM, Verity AN, Silver JE, Shooter EM, Abrams JS. Interleukin-6 production by Schwann cells and induction in sciatic nerve injury. J Neurochem. 1995;64:850–8.
- Yamada M, Hatanaka H. Interleukin-6 protects cultured rat hippocampal neurons against glutamate-induced cell death. Brain Res. 1994;643:173–80.
- Bach JR. Pathophysiology of paralytic-restrictive pulmonary syndromes. In: Bach JR, editor. Pulmonary rehabilitation: the obstructive and paralytic conditions. Philadelphia, PA: Hanley & Belfus; 1996:275–83.
- Yan SF, Tritto I, Pinsky D, Liao H, Huang J, Fuller G, et al. Induction of interleukin 6 (IL-6) by hypoxia in vascular cells. Central role of the binding site for nuclear factor-IL-6J Biol Chem. 1995;270:11463–71.
- Tsuchida S, Engelberts D, Peltekova V, Hopkins N, Frndova H, Babyn P, et al. Atelectasis causes alveolar injury in nonatelectatic lung regions. Am J Respir Crit Care Med. 2006;174:279–89.
- De S, Souhrada M, Zelazny ET, Souhrada JF. IL-1 beta and IL-6 induce hyperplasia and hypertrophy of cultured guinea pig airway smooth muscle cells. J Appl Physiol. 1995;78:1555–63.
- Jiang JH, Yang EJ, Baek MG, Kim SH, Lee SM, Choi SM. Anti-inflammatory effects of electroacupuncture in the respiratory system of a symptomatic amyotrophic lateral sclerosis animal model. Neurodegener Dis. 2011;8:504–14.
- Hardiman O. Management of respiratory symptoms in ALS. J Neurol. 2011;258:359–65.
- Ringel SP, Murphy JR, Alderson MK, Bryan W, England JD, Miller RG, et al. The natural history of amyotrophic lateral sclerosis. Neurology. 1993;43:1316–22.
- Cooperstock M. Atelectasis complicating acute poliomyelitis with involvement of respiratory muscles. Arch Pediatr Adolesc Med. 1944;67:457–62.
- Schmidt-Nowara WW, Altman AR. Atelectasis and neuromuscular respiratory failure. Chest. 1984;85:792–5.
- Jacobson G, Cohen SR, Carter RA. Pulmonary complications of acute bulbar poliomyelitis. Radiology. 1951;57:629–41.