
Abstract
Objective: This study characterized two patient-reported outcome measures (PROMs): a patient-facing adaptation of the revised amyotrophic lateral sclerosis (ALS) Functional Rating Scale (“self-entry ALSFRS-R”) and the Activities-specific Balance Confidence (ABC) Scale. Methods: ALS patients presenting to clinic completed PROMs that included (1) the self-entry ALSFRS-R, (2) the Activities-specific Balance Confidence Scale (ABC Scale), and (3) a question about falls. PROM data were compared to one another and to the traditional ALSFRS-R collected by trained evaluators in clinic (“standard ALSFRS-R”). Results: Over the data collection period, 449 ALS patients completed at least one of the three PROMs. Self-entry vs. standard ALSFRS-R total scores (n = 183) had high agreement (intraclass correlation (ICC)=0.81, 95% CI = 0.67, 0.88). Self-entry ALSFRS-R total scores were significantly higher than standard ALSFRS-R total scores (2.3 points, p < 0.001). In a subset of participants who contributed data at two timepoints, the average ALSFRS-R decline was not significantly different between methods (n = 49). ABC scores correlated highly with self-entry and standard ALSFRS-R Gross Motor subdomain scores (Pearson’s r = 0.72, p < 0.001 and Pearson’s r = 0.76, p < 0.001, respectively; n = 130). ABC score was negatively correlated with the number of reported falls within the last month (Spearman’s r=–0.40; p < 0.001; n = 130). A 10-point decrease in ABC score increased odds of a reported fall by 16%. Conclusions: In a multidisciplinary clinic setting, self-entry and standard ALSFRS-R scores were similar, but not interchangeable. Self-entry scores were higher than standard ALSFRS-R scores but declined at a similar rate to the standard ALSFRS-R. ABC scores correlated with self-reported fall history and thus may provide useful data for clinical care.
Introduction
Amyotrophic lateral sclerosis (ALS) is a progressive neurodegenerative disease primarily affecting motor neurons. ALS disease-modifying medications such as riluzole and edaravone have a modest effect (Citation1,Citation2), and additional effective therapies are needed. As people with ALS develop progressive disability, multidisciplinary care is needed to address functional changes and maximize independence, safety, and quality of life. Thus, the care of ALS patients encompasses a dual mission of providing timely multidisciplinary support and advancing clinical research to facilitate the development of effective treatments for people with ALS.
Patient-reported outcome measures (PROMs) are emerging as important tools in ALS care and research. PROMs can be used to gather patients’ perspectives on function directly and efficiently. The data could alert care teams to changes in patient function and guide clinical care. Increasingly, PROMs are also important in ALS clinical research (Citation3) as outcomes that allow remote data collection to reduce trial burden and enable frequent data collection, which can reduce variability and sample size in ALS trials (Citation4–8).
Two relevant PROMs for people with ALS are the Activities-specific Balance Confidence Scale (ABC Scale) (Citation9) and a patient-facing adaptation of the Revised ALS Functional Rating Scale (ALSFRS-R) (Citation10). The ABC Scale is a 16-item scale scored 0–100 that is designed to assess individuals’ confidence in his/her balance across a range of activities of daily living. ABC scores, which range from 0 (no confidence at all) to 100 (full confidence), correlate with real-world behavior (such as frequency of doing specific activities) (Citation11) and can discriminate between levels of physical functioning (Citation12). ABC scores have also been shown to predict falls in a general elderly population (Citation13,Citation14) and in people with Parkinson’s disease (Citation15). The ABC Scale has not been explored in ALS.
The ALSFRS-R is a 12-item, 48-point questionnaire that assesses function in four domains (Bulbar, Fine Motor, Gross Motor, and Respiratory) (Citation16). It is a commonly used primary outcome measure in ALS trials and can track ALS progression in clinical settings. It was designed to be a guided assessment, administered by a trained examiner, either in person or by telephone. Patient-facing versions of the ALSFRS-R have now been developed and evaluated as PROMs in ALS research populations (Citation5,Citation7,Citation8,Citation10).
In this study, we performed a retrospective analysis of patient-facing ALSFRS-R and ABC Scale PROM data gathered from an all-comer ALS clinic population. We explored whether these PROMs, collected in the waiting room prior to clinic visits, agree with data collected by clinic staff during the visit.
Methods
From September 2017 through October 2019, people with ALS completed PROMs in the waiting room for the Massachusetts General Hospital (MGH) Multidisciplinary ALS clinic. Participants were established patients with known diagnoses of ALS who were presenting for a follow-up visit. At check-in, patients received a tablet to complete PROMs on a platform integrated with the hospital electronic medical record (EMR). Caregivers were permitted to assist patients with data entry on the tablet. Patients were not screened for cognitive function, comfort using tablet computers, or ability to answer the questions independently. Clinic staff were available to answer questions about how to use the tablet.
PROMs included the patient-facing ALSFRS-R (“self-entry ALSFRS-R”), the ABC Scale, and a single question asking patients to estimate the number of falls they had in the prior month.
The self-entry ALSFRS-R we used in this study (Citation10) used patient-friendly wording that had been adapted from the standard ALSFRS-R. It was previously shown to correlate well with the standard ALSFRS-R (Citation10).
PROM answers were stored in the EMR and extracted later alongside the date of the visit, demographic information, medical history, and the standard ALSFRS-R completed in clinic by a certified evaluator (“standard ALSFRS-R”). The certified evaluators, consisting of fifteen clinic nurses and coordinators, were all trained in ALSFRS-R administration and certified through the Barrow Neurological Institute, the outcomes training center for the Northeast ALS Consortium.
Manual chart review was conducted to extract standard ALSFRS-R scores from all clinic visits with PROM data between the dates of September 2017 and October 2019. Data were spot-checked by another investigator for correctness and completeness. This retrospective study was approved by the Institutional Review Board convened at Partners Healthcare.
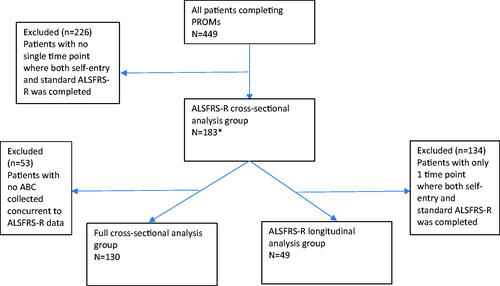
PROMs were filled out as a part of clinical care, and thus were missing data. To make best use of the existing data, we defined three analysis populations: (1) full cross-sectional cohort: those with ABC, self-reported falls, self-entry ALSFRS-R, and standard ALSFRS-R total scores; (2) ALSFRS-R cross-sectional cohort: those with both self-entry and standard ALSFRS-R total scores at one timepoint; (3) ALSFRS-R longitudinal cohort: those with both self-entry and standard ALSFRS-R total scores for at least two timepoints ().
Figure 1 Consort diagram of analysis cohorts. *Due to data entry issues, three patients with ALSFRS-R total scores were missing subscores.
For analyses of the full cross-sectional cohort, correlations among ABC score and self-entry and standard ALSFRS-R total scores were performed using a Pearson correlation coefficient. Patients were categorized by the number of self-reported falls over the previous month patients into six groups (0, 1, 2, 3, 4, 5, or more). To quantify the increased risk of falling attributable to increasing ABC score, we split participants into those who reported no falls and those who reported any falls. We used this categorization as the outcome of a logistic regression with ABC score as the predictor. The ABC score and self-entry and standard ALSFRS-R Gross Motor and total scores were compared across fall groups using a Spearman correlation.
For analyses of the ALSFRS-R cross-sectional cohort, comparisons of ALSFRS-R methods included the first available visit for each patient that contained both self-entry and standard ALSFRS-R. A Bland–Altman plot was produced to show any systematic differences between methods. An interclass correlation for agreement between the two methods (intraclass correlation (ICC)(2,1)) was used to assess agreement, interpreting a value of 0.5–0.75 as moderate, 0.75–0.90 as high, and above 0.90 as excellent. A scatter plot with an estimated regression line was produced to show where methods deviated on the ALSFRS-R scale.
For analyses of the ALSFRS-R longitudinal cohort, the first two charts for each patient containing both the self-entry and standard ALSFRS-R were included in the analysis. A Bland–Altman plot was produced to show any systematic differences between the monthly change between the two methods and an ICC(2,1) was produced to assess agreement in monthly change for the two methods. Individual plots of ALSFRS-R scores over time were generated to visualize self-entry and standard ALSFRS-R slopes. Differences between guided and self-entry ALSFRS-R slopes were plotted in a box plot.
Descriptive statistics were used to summarize patient characteristics for the entire cohort and for the population included for each of the analyses, and were split by whether or not a patient was included in each of the three analysis groups. The included and excluded groups were compared using a t-test for continuous measures and Fisher’s exact test for categorical measures. All tests were two-tailed and assessed at an alpha of 0.05. Analyses were carried out in the R statistical software (Vienna, Austria) (Citation17).
Results
Over the data collection period, 449 individual patients with ALS filled out at least one part of the PROMs (). Out of the 449, 183 patients had both self-entry and standard ALSFRS-R scores at one timepoint (ALSFRS-R cross-sectional cohort). Of these 183, 130 also had ABC scores and reported falls available at the same time point (full cross-sectional cohort). Of the 183 patients in the ALSFRS-R cross-sectional cohort, 49 had longitudinal data available for comparison of ALSFRS-R methods (ALSFRS-R longitudinal cohort). The demographics for these three cohorts are shown in . For each, the patients excluded were comparable to patients included, except for modestly lower ALSFRS-R scores.
Table 1 Demographics of analysis cohorts.
Cross-sectional self-entry vs. standard ALSFRS-R scores have high agreement
Self-entry and standard ALSFRS-R total scores were available for 183 patients; of these, 180 had subdomain scores available. The ICC for self-entry vs. standard ALSFRS-R methods was high (0.81, 95% CI = 0.67, 0.88). Each ALSFRS-R subdomain score had a similar ICC between self-entry and standard scores (mean; 95% CI): Bulbar (0.83; 0.69, 0.90), Fine Motor (0.84; 0.75, 0.89), Gross Motor (0.86; 0.80, 0.90), Respiratory (0.74; 0.66, 0.80). A scatter plot comparing ALSFRS-R data gathered using the two methods () and a Bland–Altman plot () suggests that the difference between self-entry vs. standard scores increased with higher ALSFRS-R scores. Overall, self-entry ALSFRS-R total scores were significantly higher than standard ALSFRS-R totals (n = 183; mean difference 2.3 points, SD = 4.5, paired t-test p < 0.001), with the difference spread across domains.
Figure 2 Cross sectional agreement of the guided and self-entry ALSFRS-R total scores was high (ICC = 0.81; 95% CI = 0.67–0.88; p < 0.001; n = 183). A linear regression line is indicated in the solid line, and ideal agreement is shown in the dashed line. The offset of the solid line demonstrates that self-entry scores are slightly higher than guided scores. The intersection of the dashed and solid lines suggests that the guided and self-entry scores may be slightly more similar when ALSFRS-R scores are lower.
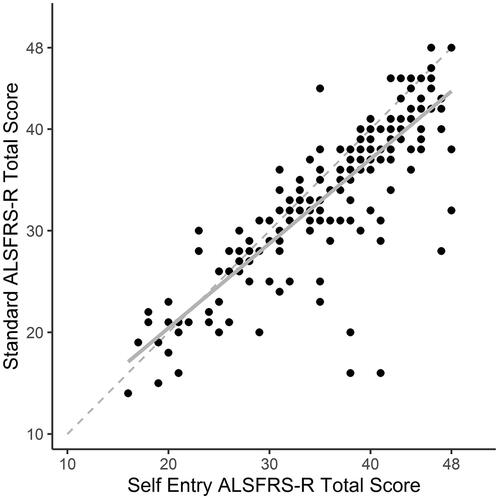
Figure 3 (a) The Bland–Altman plot of difference in ALSFRS-R total scores obtained by self-entry and standard administration methods shows no systemic biases in either method. Upper and lower limits of the confidence bounds were –11.0 and 6.5. Nine datapoints lay outside of the Bland–Altman confidence bounds. (b) The Bland–Altman plot of difference in longitudinal changes in ALSFRS-R total scores obtained by self-entry and standard administration methods shows an exaggerated response to changes in functioning in the self-entry scores.
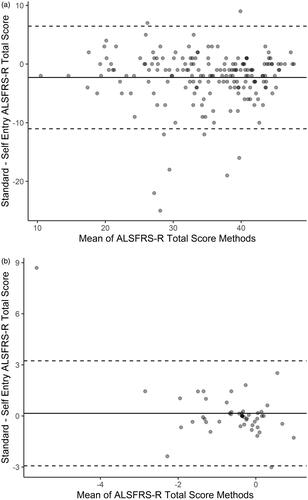
The Bland–Altman analysis comparing self-entry and standard ALSFRS-R did not reveal any strong bias in the self-entry compared to standard ALSFRS-R (). Nine patients had self-entry and standard ALSFRS-R total scores with large differences, thus sitting outside the Bland–Altman confidence bounds (). Seven of these patients had self-entry ALSFRS-R total scores that were 11 or more points higher than their standard ALSFRS-R total scores, and two had self-entry ALSFRS-R total scores that were more than six points lower than their standard ALSFRS-R total scores. A review of the clinical data for these patients revealed two were thought to have frontotemporal dementia and one routinely exaggerated his deficits as a part of well-documented drug seeking activity. No explanation was found for the other six patients with large differences between self-entry and standard ALSFRS-R (including three patients who recorded 48 (of 48 possible points) on the self-entry ALSFRS-R despite obvious clinical deficits on chart review).
Rates of decline measured by longitudinal self-entry vs. standard ALSFRS-R are not significantly different
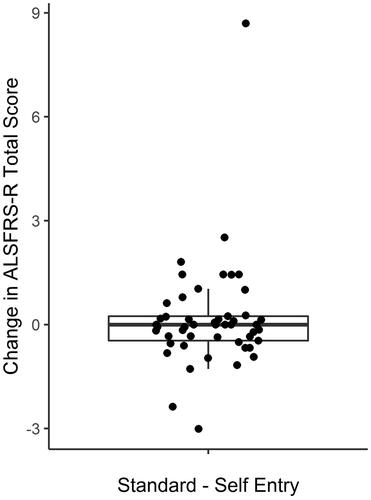
The average time between visits for patients with longitudinal ALSFRS-R data (n = 49) was 7.2 months (range: 0.7–20.5). The average rate of decline in self-entry and standard ALSFRS-R was −0.8 points per month (95% CI: −1.2 to −0.3) and −0.6 points per month (95% CI: −0.8 to −0.4), respectively. These were not significantly different (p = 0.49). However, the rate of decline of self-entry and standard ALSFRS-R total scores showed poor agreement (ICC 0.18, 95% CI = 0.05, 0.31) (). When the rate of decline measured by self-entry vs. standard ALSFRS-R was visualized in individual patients (), a majority of individuals demonstrated ALSFRS-R slopes that are similar across the two methods, while some individuals showed markedly different slopes between the two methods. The Bland–Altman analysis comparing self-entry and standard ALSFRS-R did show an exaggerated response to change in the self-entry ALSFRS-R (). A boxplot of the differences between self-entry and standard rates of ALSFRS-R decline demonstrate that the median difference in slopes between methods was 0, with an interquartile range of −0.5, 0.2 points per month ().
Figure 4 Longitudinal agreement between slopes in the self-entry and standard ALSFRS-R total scores (n = 49) over time was 0.18 (95% CI = 0.05–0.31). A linear regression line is indicated in the solid line, and ideal agreement is shown in the dashed line. This suggests a trend toward self-entry slopes being steeper in those with more rapidly progressive disease and shallower in those with more slowly progressive disease, compared to the standard ALSFRS-R.
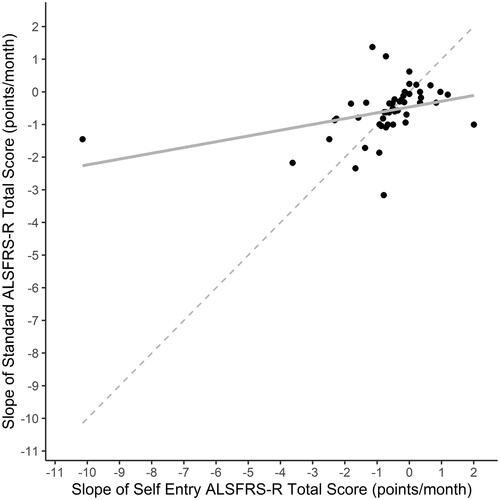
Figure 5 ALSFRS-R total scores for all participants with longitudinal self-entry and standard ALSFRS-R data (n = 49). Any individuals who appear to have only one set of scores have perfectly overlapping self-entry and standard ALSFRS-R scores.
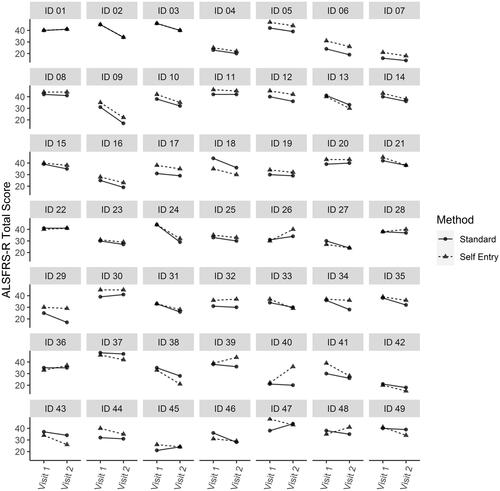
Figure 6 A boxplot of differences between ALSFRS-R slopes measured by the self-entry and standard methods demonstrate that the median difference in slopes between methods (n = 49) was 0, with an interquartile range of –0.5, 0.2 points per month.
ABC Scale scores correlate with Gross Motor subdomain and total ALSFRS-R scores
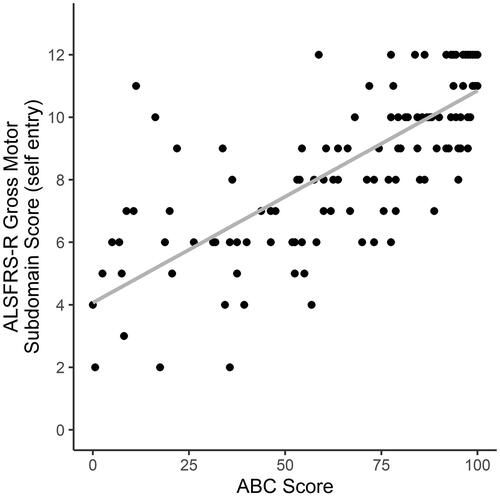
The ABC score had high correlations with the self-entry and standard ALSFRS-R Gross Motor subdomain scores (Pearson’s r = 0.76, p < 0.001, and Pearson’s r = 0.72, p < 0.001, respectively) (). As expected, correlations between the self-entry and standard ALSFRS-R total scores and the ABC score were lower (Pearson’s r = 0.58 (p < 0.001) and 0.56 (p < 0.001), respectively). There was no correlation between the self-entry or standard ALSFRS-R Bulbar subdomain score and the ABC (Pearson’s r < 0.1, p > 0.25).
Figure 7 The self-entry ALSFRS-R gross motor subdomain score correlates highly with the ABC score (r = 0.76; p < 0.001; n = 130).
ABC Scale scores correlate with self-reported falls
The ABC score was negatively correlated with the number of reported falls within the last month. As ABC scores decreased, the number of reported falls within the last month increased (Spearman’s r=–0.40; p < 0.001; ). For every 10-point decrease in the ABC score, the odds of having fallen at all in the last month increased by 16%.
Figure 8 (a) Correlation of number of reported falls with the ABC score. There is a moderate correlation between the number of falls and the ABC score, with the number of reported falls increasing as the ABC score decreases (Spearman’s r=–0.3; p < 0.001; n = 130). (b) Correlation of number of reported falls with the self-entry ALSFRS-R gross motor subdomain score. The correlation between the number of falls and the self-entry ALSFRS-R gross motor subdomain is less strong (Spearman’s r=–0.21; p < 0.001; n = 130).
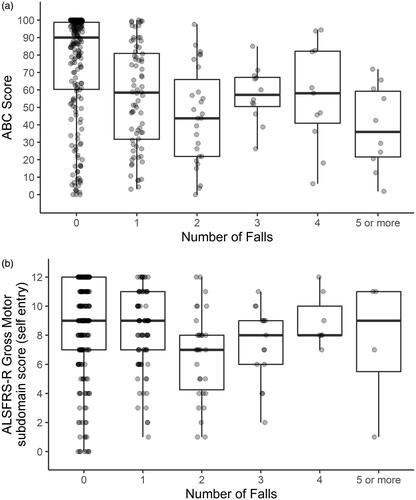
Compared to the ABC score, the gross motor subdomain scores of the ALSFRS-R were less strongly correlated with the number of reported falls (self-entry ALSFRS-R Spearman’s r= −0.31, p < 0.001, ; standard ALSFRS-R Spearman ’s r= −0.22, p = 0.001, data not shown).
Discussion
In this study, we evaluated the relationships between two functionally relevant PROMs, the patient-facing self-entry ALSFRS-R and the ABC Scale, with patient-reported falls and standard ALSFRS-R scores, in an ALS clinic population. Both the self-entry ALSFRS-R and the ABC Scale provide valuable data about ALS patients’ perspectives on their daily functioning that may be useful in clinical management and possibly as clinical trial outcomes.
Self-entry and standard ALSFRS-R scores gathered in an all-comer ALS clinic population are similar, but not interchangeable
We found that the self-entry and standard ALSFRS-R scores had high agreement, though self-entry scores were approximately two points (5%) higher, with differences spread across all domains of the ALSFRS-R. These results align with our prior analyses and what others have published: using various forms of patient-facing ALSFRS-R, patients tend to give themselves higher ALSFRS-R scores than evaluators (Citation7,Citation8,Citation10).
Compared to other cross-sectional studies of self-entry vs. standard ALSFRS-R, which found ICCs between 0.93 and 0.97 (Citation5,Citation7,Citation8,Citation10), we found slightly lower agreement in ALSFRS-R scores between the two methods (ICC 0.81). In addition, the upper- and lower-limits of agreement between the two methods () were 92%, wider than previously reported (Citation5). These differences suggest that our cross-sectional self-entry and standard ALSFRS-R data have more variability than previous studies—not unexpected, given that this is a clinic population, rather than a highly selected research population. Review of the few outliers whose self-entry ALSFRS-R data was incongruent with the standard ALSFRS-R revealed several reasons, including cognitive change, misunderstanding of the PROMs tools, and even malingering. It is possible that the self-entry ALSFRS-R is more susceptible to each of these factors than the standard ALSFRS-R. Future studies should examine which patient characteristics predict reliable completion of PROMs.
In our longitudinal dataset, the rate of decline between the self-entry and standard ALSFRS-R scores over time was −0.8 vs. −0.6 points per month, respectively. This difference was not statistically significant. Compared to the three other studies with longitudinal self-entry ALSFRS-R data, our results show a slightly larger difference in rate of decline between the two methods. Maier and colleagues found a mean decline of −0.57 and −0.49 points per month (Citation5); we previously found declines of −0.53 and −0.43 points per month (Citation8); and Montes et al. found declines of −0.6 and −0.73 points per month for self-entry and standard ALSFRS-R (Citation10), respectively. Notably, in two prior studies (Citation8,Citation10), there also was no evidence of a statistically significant difference in rates of ALSFRS-R decline between self-entry and standard collection methods.
In our study, the agreement between ALSFRS-R slopes across methods was low (ICC 0.18). However, our longitudinal cohort (n = 49) was smaller than our cross-sectional cohort (n = 130), and the long interval between visits (average 7 months) may have caused variability in our longitudinal data. Prior ALSFRS-R studies with closer follow-up had lower variability (Citation8). Thus, the agreement we report could be due to small sample size and long duration between visits, which does not recapitulate a trial setting. Additional studies with more robust and frequent longitudinal data are needed to understand how the self-entry ALSFRS-R compares with the standard ALSFRS-R at measuring change over time.
In summary, self-entry and standard ALSFRS-R scores were similar in a multidisciplinary clinic setting, and the slopes of each were not statistically different over time. However, individual self-entry and standard scores should not be viewed as interchangeable. There was a bias toward higher scores with self-entry. This finding in an all-comer ALS clinic patient population was consistent with studies done with ALS research participants (Citation7,Citation8,Citation10). Still, the self-entry ALSFRS-R adds value to both clinical care and clinical trials. In an era of increasing opportunity to collect PROMs using mobile apps, and during the COVID-19 pandemic, in which remote data collection is essential to continuing clinical trials, self-entry ALSFRS-R has practical advantages over the guided ALSFRS-R—it may allow more frequent collection, lower trial burden, less missingness of data, and a true PROM. Further studies examining the performance of the self-entry ALSFRS-R over time in different ALS populations are warranted to fully understand its benefits.
The ABC Scale holds promise as a novel PROM in ALS
We explored the ABC Scale in our ALS clinic population because it assesses patients’ perception of their functional mobility, and thus may be a useful PROM to guide clinical practice in ALS. In our cohort, the ABC Scale provided valuable information: decreasing ABC Scale scores were associated with increasing self-reported falls, and each 10-point reduction in the ABC Scale score was associated with 16% increased odds of having fallen in the last month. ABC scores had convergent validity with the ALSFRS-R. As expected, the ABC score correlated well with the ALSFRS-R Gross Motor subdomain and moderately well with the ALSFRS-R total score. ABC scores also had good discriminant validity with the ALSFRS-R, as ABC scores did not correlate with ALSFRS-R Bulbar subdomain scores.
In our ABC Scale dataset, there were patients whose individual ABC scores were incongruent with their number of self-reported falls (, lower left and upper right quadrants). For people who had low ABC scores but no falls, it is possible that low confidence in balance led them to take care to avoid falls. Conversely, for people who had fallen but had high ABC scores, it is possible that cognitive impairment could be affecting insight into fall risk, leading to overconfidence. Additionally, because scores were compared with self-reported falls in the previous month, it is unclear whether lower ABC scores were associated with risk of falling, or whether lower confidence in balance was a result of having fallen in that month. Furthermore, the retrospective recollection of falls data is subject to recall errors. A full prospective exploration of cognition, ABC scores, and reported falls would help clarify.
The ABC Scale, a PROM, is more easily obtained than the two measures currently shown to predict falls in ALS (the timed up and go test (Citation18) and a composite leg strength score (Citation19)), and could find use for guiding multidisciplinary care, particularly if future analyses could define key questions within the ABC Scale that predict falls. The ABC Scale could also find a role as a PROM in ALS trials, though further study would be required to understand how to position it for trial use. Longitudinal studies of the ABC Scale in ALS patients to evaluate ABC scores over time, its relationship to disability and quality of life, and its ability to predict meaningful clinical outcomes, would help define its potential role in assessing therapies in development for ALS.
Study limitations and future studies
It is important to note that our study has several limitations. Not all patients who presented to ALS clinic for follow-up visits completed PROMs. PROMs were optional. Some patients were not provided the tablet because of time limitations or tablet availability. These factors may have caused selection bias. Patients were permitted to have caregiver assistance with the tablets, and caregivers could have influenced answers.
The longitudinal analyses had additional limitations. The longitudinal cohort was smaller and may have had additional selection bias compared to the cross-sectional cohort. Furthermore, individual follow-up times varied. Follow-up studies should standardize visit intervals to overcome this source of variability. Future studies should also consider important patient characteristics, such as cognitive status, to determine those patients most amenable to using PROMs. This will help to understand the potential benefit of using PROMs both in clinical management and clinical trials.
Finally, we offered no training on PROMs completion. The variability in this study underlines the potential benefit of instructing patients on the completion of PROMs prior to their collection.
Conclusions
Both the self-entry ALSFRS-R and the ABC Scale provide valuable data about ALS patients’ perspective on their daily functioning. Despite increased variability in our clinic dataset compared to prior studies, our data still demonstrate that these PROMs show high agreement with outcomes such as the standard ALSFRS-R and reported falls, and thus may be useful in guiding clinical care. Further evaluation of these measures with longitudinal studies, instruction on PROM completion, and a focus on patient characteristics will help establish best practices for the use of PROMs in ALS trials.
Acknowledgements
The authors thank all the patients who contributed their time and effort to this study. We thank Dr. Anita Myers, the primary developer and copyright holder of the ABC Scale, for granting us permission to use the ABC Scale for this study, and thank Dr. Merit E. Cudkowicz for her support of this study.
Declaration of interest
Sheena Chew is an employee of Biogen. This manuscript was prepared when she was an employee of Massachusetts General Hospital and received research support from Biogen. Katherine M. Burke reports no disclosures. Ella Collins reports no disclosures. Reagan Church reports no disclosures. Sabrina Paganoni reports research grants from the ALS Association, ALS Finding a Cure, the American Academy of Neurology, the Spastic Paraplegia Foundation, the Muscular Dystrophy Association, Amylyx Therapeutics, Revalesio Corporation, Ra Pharma, Biohaven, Clene Nanomedicine, Prilenia and personal consulting fees from Orion. Katharine Nicholson reports consulting fees from for Alector, Al Therapeutics, Avanir Pharmaceuticals, Biogen, Biohaven Pharmaceuticals, MT Pharma, Wave Therapeutics. She has received research support from the ALS Association, American Academy of Neurology, ALS Finding a Cure, Target ALS, Muscular Dystrophy Association, Brainstorm Therapeutics, Salah Foundation. Suma Babu reports research support from American Academy of Neurology, AANEM Foundation, The ALS Association, Muscular Dystrophy Association, Biogen Inc, Orion Corporation, Voyager Therapeutics and Novartis pharmaceuticals. Jennifer B. Scalia reports no disclosures. Fabiola de Marchi reports no disclosures. Amy L. Ellrodt reports no disclosures. Lidia M.V.R. Moura reports no disclosures. James Chan reports no disclosures. James D. Berry reports consulting fees from Biogen, Clene Nanomedicine, and Alexion. He has received research support from Biogen, MT Pharma of America, Anelixis Therapeutics, Amylyx Therapeutics, Brainstorm Cell Therapeutics, Genentech, nQ Medical, NINDS, Muscular Dystrophy Association, ALS One, and ALS Finding A Cure.
References
- Bensimon G, Lacomblez L, Meininger V. A controlled trial of riluzole in amyotrophic lateral sclerosis. ALS/Riluzole Study Group. N Engl J Med. 1994;330:585–91.
- Abe K, Aoki M, Tsuji S, Itoyama Y, Sobue G, Togo M, et al. Safety and efficacy of edaravone in well defined patients with amyotrophic lateral sclerosis: a randomised, double-blind, placebo-controlled trial. Lancet Neurol. 2017;16:505–12.
- De Marchi F, Berry JD, Chan J, Caldwell S, Ellrodt A, Scalia J, et al. Patient reported outcome measures (PROMs) in amyotrophic lateral sclerosis. J Neurol. 2020;267:1754–9.
- Rutkove SB, Qi K, Shelton K, Liss J, Berisha V, Shefner JM. ALS longitudinal studies with frequent data collection at home: study design and baseline data. Amyotroph Lateral Scler Frontotemporal Degener. 2019;20:61–7.
- Maier A, Holm T, Wicks P, Steinfurth L, Linke P, Munch C, et al. Online assessment of ALS functional rating scale compares well to in-clinic evaluation: a prospective trial. Amyotroph Lateral Scler. 2012;13:210–6.
- Wicks P, Vaughan TE, Massagli MP, Heywood J. Accelerated clinical discovery using self-reported patient data collected online and a patient-matching algorithm. Nat Biotechnol. 2011;29:411–4.
- Bakker LA, Schroder CD, Tan HHG, Vugts S, van Eijk RPA, van Es MA, et al. Development and assessment of the inter-rater and intra-rater reproducibility of a self-administration version of the ALSFRS-R. J Neurol Neurosurg Psychiatry. 2020;91:75–81.
- Berry JD, Paganoni S, Carlson K, Burke K, Weber H, Staples P, et al. Design and results of a smartphone-based digital phenotyping study to quantify ALS progression. Ann Clin Transl Neurol. 2019;6:873–81.
- Powell LE, Myers AM. The Activities-specific Balance Confidence (ABC) Scale. J Gerontol A Biol Sci Med Sci. 1995;50A:M28–M34.
- Montes J, Levy G, Albert S, Kaufmann P, Buchsbaum R, Gordon PH, et al. Development and evaluation of a self-administered version of the ALSFRS-R. Neurology. 2006;67:1294–6.
- Myers AM, Powell LE, Maki BE, Holliday PJ, Brawley LR, Sherk W. Psychological indicators of balance confidence: relationship to actual and perceived abilities. J Gerontol A Biol Sci Med Sci. 1996;51:M37–M43.
- Myers AM, Fletcher PC, Myers AH, Sherk W. Discriminative and evaluative properties of the activities-specific balance confidence (ABC) scale. J Gerontol A Biol Sci Med Sci. 1998;53:M287–M94.
- Lajoie Y, Gallagher SP. Predicting falls within the elderly community: comparison of postural sway, reaction time, the Berg Balance Scale and the Activities-specific Balance Confidence (ABC) scale for comparing fallers and non-fallers. Arch Gerontol Geriatr. 2004;38:11–26.
- Cleary K, Skornyakov E. Predicting falls in community dwelling older adults using the Activities-specific Balance Confidence Scale. Arch Gerontol Geriatr. 2017;72:142–5.
- Mak MK, Pang MY. Balance confidence and functional mobility are independently associated with falls in people with Parkinson's disease. J Neurol. 2009;256:742–9.
- Cedarbaum JM, Stambler N, Malta E, Fuller C, Hilt D, Thurmond B, et al. The ALSFRS-R: a revised ALS Functional Rating Scale that incorporates assessments of respiratory function. BDNF ALS Study Group (Phase III). J Neurol Sci. 1999;169:13–21.
- R Development Core Team. R: a language and environment for statistical computing. Vienna, Austria: R Foundation for Statistical Computing; 2019.
- Montes J, Cheng B, Diamond B, Doorish C, Mitsumoto H, Gordon PH. The Timed Up and Go test: predicting falls in ALS. Amyotroph Lateral Scler. 2007;8:292–5.
- Schell WE, Mar VS, Da Silva CP. Correlation of falls in patients with amyotrophic lateral sclerosis with objective measures of balance, strength, and spasticity. NeuroRehabilitation. 2019;44:85–93.