
Abstract
Introduction: Vital capacity (VC) is routinely used for ALS clinical trial eligibility determinations, often to exclude patients unlikely to survive trial duration. However, spirometry has been limited by the COVID-19 pandemic. We developed a machine-learning survival model without the use of baseline VC and asked whether it could stratify clinical trial participants and a wider ALS clinic population. Methods. A gradient boosting machine survival model lacking baseline VC (VC-Free) was trained using the PRO-ACT ALS database and compared to a multivariable model that included VC (VCI) and a univariable baseline %VC model (UNI). Discrimination, calibration-in-the-large and calibration slope were quantified. Models were validated using 10-fold internal cross validation, the VITALITY-ALS clinical trial placebo arm and data from the Emory University tertiary care clinic. Simulations were performed using each model to estimate survival of patients predicted to have a > 50% one year survival probability. Results. The VC-Free model suffered a minor performance decline compared to the VCI model yet retained strong discrimination for stratifying ALS patients. Both models outperformed the UNI model. The proportion of excluded vs. included patients who died through one year was on average 27% vs. 6% (VCI), 31% vs. 7% (VC-Free), and 13% vs. 10% (UNI). Conclusions. The VC-Free model offers an alternative to the use of VC for eligibility determinations during the COVID-19 pandemic. The observation that the VC-Free model outperforms the use of VC in a broad ALS patient population suggests the use of prognostic strata in future, post-pandemic ALS clinical trial eligibility screening determinations.
Introduction
Patient heterogeneity in trial populations increases sample size, trial duration and reduces power (Citation1,Citation2). Among approaches for dealing with heterogeneity are enrichment strategies applied using baseline characteristics. These have generally been used with the goal of including patients with earlier disease and excluding patients less likely to complete the trial due to advanced disease (Citation3). The success of baseline eligibility criteria, however, is in question and several recent publications have suggested that they be replaced by risk estimates (Citation2,Citation4,Citation5). A study of 38 ALS trials concluded that traditional eligibility criteria excluded nearly 60% of ALS patients and failed to reduce heterogeneity in survival (Citation5).
Over the last 20 years, most ALS clinical trials have required patients to have a minimum baseline % expected VC (BL%VC) (Citation2,Citation5–7). The majority of trials used BL%VC inclusion criteria cutoffs between ≥50% to ≥80%. Previous work has shown BL%VC to be prognostic of survival (Citation2,Citation6,Citation8,Citation9), and excluding patients with low BL%VC aims to reduce the number of patients that may not survive the study period.
The global COVID-19 pandemic presents a broad, continually evolving challenge for conducting clinical trials. One area of impact is in the collection of %VC from ALS patients (Citation10,Citation11). With the safety of patients and staff at the forefront, some ALS clinics stopped collecting %VC measures in clinical trials for the duration of the pandemic. Andrews et al., (Citation10) found that 69% of 61 responding ALS clinics reported difficulty performing spirometry, even when patients were in clinic. Furthermore, there has been a spike in telemedicine, making it even more difficult to obtain routine spirometry. Some of this move toward telemedicine will abate with the resolution of the COVID-19 pandemic, but in some cases, it will remain an important tool. Remote evaluation makes sense for people with ALS because travel to appointments can be arduous. Remote assessment of breathing function for patient care (Citation12–14) and clinical trials (Citation15) is an active area of research. In the meantime, and perhaps for years to come, VC may be less frequently measured than in the past.
We asked whether a survival model trained without baseline VC measures could be built, whether its performance could match that of a model trained with baseline VC measures, and whether the model could outperform a standard BL%VC criterion at excluding patients least likely to survive when applied to a broader group of clinic patients.
Materials and methods
Training and validation data
Data used in training predictive models were obtained from the PRO-ACT Database. PRO-ACT contains records from over 10,700 ALS patients who participated in 23 phase II/III trials. The database of over 10 million longitudinally collected data points includes demographic, laboratory and medical data, survival, and family histories (Citation16). A PRO-ACT subset was used for model training to minimize missingness among baseline predictors and ensure all included patients had follow-up data to assess the outcome (time from baseline to tracheostomy or death).
Data from 188 placebo patients from the year-long tirasemtiv VITALITY-ALS trial were used for model validation as an external test dataset representative of a contemporary clinical trial population (Citation17). Data from 630 patients treated at the Emory University ALS clinic between 2008 and 2015 were used for validation as an external dataset representative of a clinic population (Citation18). All patients in the external datasets had multiple visits beginning from their baseline trial visit or first clinic visit, and generally included the full ALSFRS-R questionnaire, VC, and vital signs.
Predictor variables
A panel of diverse predictors available at baseline visits in both the clinical trial and clinic settings was compiled. The complete set of predictors considered in model development included: patient characteristics (age, sex, height, weight, BMI), disease characteristics (time since symptom onset and diagnosis, site of symptom onset, riluzole use), vitals (SBP, DBP, pulse), ALSFRS-R, and measures of vital capacity. For all ALSFRS-R scores and %VC, slopes were derived from symptom onset to baseline assuming “full health” (i.e., all ALSFRS-R question scores = 4 and 100%VC) the day prior to symptom onset and were included in the complete feature set. This complete set of predictors was used to train a multivariable survival model with VC included (VCI, 8), and a comparator multivariable survival model using the same panel of predictors, but purposely excluding VC measures (VC-Free). Variables were cleaned and standardized between the PRO-ACT, VITALITY-ALS, and Emory Clinic datasets, and descriptive statistics were generated to assess the similarity between training and test datasets. For both models (VCI & VC-Free), variable selection from the full set of predictors was performed using a random forest algorithm (Citation19).
A univariable reference model (UNI) was also created to predict survival using a single predictor, baseline %VC. The use of only BL%VC to predict patient risk of death most closely relates to the current approach employed to enrich for survival in ALS clinical trials: that is, defining an inclusion criterion with a minimum baseline %VC threshold.
A complete PROBAST assessment of the development and validation of the VCI and VC-Free models is provided in the supplemental materials (Citation20).
Model creation and evaluation
For each multivariable model, VCI and VC-Free, a Cox proportional hazards model was used as the loss function to train a gradient boosting machine-learning model to predict the time from baseline to tracheostomy or death (Citation21). For the UNI model, a Cox proportional hazards model was fit with a single predictor. Each model returns a predicted log-hazard that was used to rank order patients by relative predicted risk of death. The log-hazard was transformed using the baseline cumulative hazard to provide predicted survival probabilities over time (Citation8).
Models were assessed for discrimination and calibration through one year (Citation22). Discrimination was evaluated using the concordance (c) statistic. A C-statistic close to 1 indicates good discriminative ability, whereas a C-statistic close to 0.5 indicates poor discrimination (Citation23). Calibration was quantified using the calibration-in-the-large and calibration slope. A calibration-in-the-large close to 0 and a calibration slope close to 1 indicate good calibration (Citation24).
To assess reproducibility, internal 10-fold cross-validation was performed using the PRO-ACT training set. To assess generalizability, external model validation was performed using the VITALITY-ALS clinical trial and Emory clinic datasets (Citation25). To ensure a fair comparison of performance between models, each validation set was filtered to patients with non-missing BL%VC (PRO-ACT N = 5251, VITALITY-ALS N = 188, EMORY N = 581). The VITALITY-ALS dataset is a highly selected group of participants. Likewise, PRO-ACT is composed of a selected group of ALS trial participants who were also subject to selection criteria. We included the Emory clinic dataset to assess model performance and thus the utility of the model for a broader ALS population, one that is more representative of the pool of patients that could be screened for clinical trial inclusion.
Simulations
Simulations were run to mimic enrollment into a clinical trial with inclusion criteria defined to enrich the population for survival. Random samples of N = 250 were drawn from the Emory clinic data. Sampled patients were “screened” for inclusion into the trial based on having >50% predicted probability of survival at one year. Inclusion for each sampled population was assessed using predictions from the UNI, VCI, and VC-Free models. Simulations were run 100 times. Actual deaths through one-year, median survival and the proportion of “screened” patients included versus excluded based on predictions from each model were summarized across all simulations. Kaplan–Meier curves for patients ≤ or > 50% predicted probability of survival at one year based on predictions from each model (UNI, VCI, VC-Free) are plotted for the full Emory population.
Computational methods
Computations were performed using the R statistical computing system (v4.0.2), including tidyverse (Citation26), randomForestSRC (Citation27), gbm (Citation28), survival (Citation29), survivalROC (Citation30), and survminer (Citation31).
Results
Patient characteristics for each data source, the PRO-ACT internal validation subset (N = 5251) and the two external validation datasets, VITALITY-ALS placebo arm (N = 188) and Emory clinic data (N = 581), are summarized in . As expected, the Emory clinic data include a broader group of patients than the clinical trial datasets as displayed by wider ranges and greater variability across reported baseline characteristics. The median follow-up time for Emory clinic patients was 15.9 months versus 12.5 months for both PRO-ACT and the VITALITY-ALS placebo arm. The PRO-ACT internal validation subset included 1017 (19.4%) patients who died within one year, 17 (9.0%) of the VITALITY-ALS placebo arm died within one year, and 61 (10.5%) of the Emory clinic patients died within one year.
Table 1 Patient characteristics.
summarizes differences in variable importance rankings between the VCI and VC-Free models. VC slope, BL%VC, and baseline VC, ranked as the 1st, 3rd, and 5th most important features in the VCI model, respectively, were deleted in the VC-Free model by design. As a result, age and BMI rose from the 2nd and 4th to the 1st and 2nd most important features. Baseline ALSFRS-R slope jumped several positions, rising from 10th to 4th. Finally, variables that did not meet the importance threshold of the VCI model appeared as predictors in the VC-Free model, including the 7th place speech score slope.
Table 2 Comparison of variable importances between VCI and VC-Free models.
Model performance metrics for the VCI, VC-Free, and UNI models are summarized in , respectively. The VCI model displayed optimal discrimination on internal validation with a C-statistic (95% CI) across all 10-fold of internal cross validation of 0.80 (0.79, 0.81) (). The VC-Free model discrimination degraded slightly on internal validation with an overall C-statistic (95% CI) of 0.77 (0.75, 0.78) (). Both multivariable models clearly outperformed the univariable (UNI) model on internal validation with an overall C-statistic (95% CI) of 0.72 (0.70, 0.73) (). Discrimination on external datasets was comparable for the VCI and VC-Free models, and again both clearly outperformed the UNI model [C-statistic (95% CI): VITALITY-ALS – VCI 0.79 (0.70, 0.88), VC-Free 0.76 (0.66, 0.86), UNI 0.59 (0.43, 0.74); EMORY – VCI 0.78 (0.73, 0.83), VC-Free 0.79 (0.74, 0.85), UNI 0.63 (0.57, 0.70)].
Figure 1 Summary of VCI model performance. (A) Discrimination as measured with the C-statistic, (B) calibration as measured with calibration slope and (C) calibration-in-the-large for each of 10-folds from internal cross validation and two external datasets. (D) Visual translation of discrimination and calibration for all Emory clinic patients. Patients are stratified by predicted probability of survival at one year and Kaplan–Meier curves are plotted against mean predicted curves for each stratum.
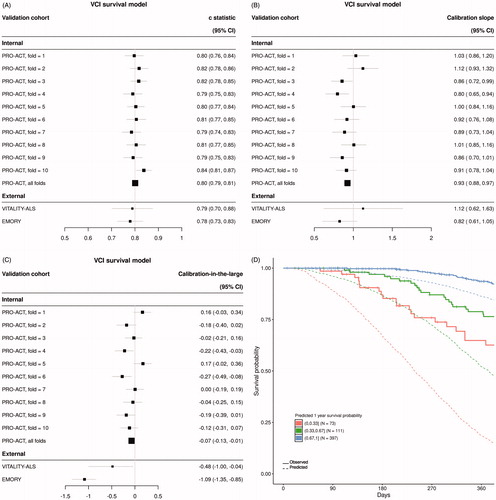
Figure 2 Summary of VC-Free model performance. (A) Discrimination as measured with the C-statistic, (B) calibration as measured with calibration slope and (C) calibration-in-the-large for each of 10-folds from internal cross validation and two external datasets. (D) Visual translation of discrimination and calibration for all Emory clinic patients. Patients are stratified by predicted probability of survival at one year and Kaplan–Meier curves are plotted against mean predicted curves for each stratum.
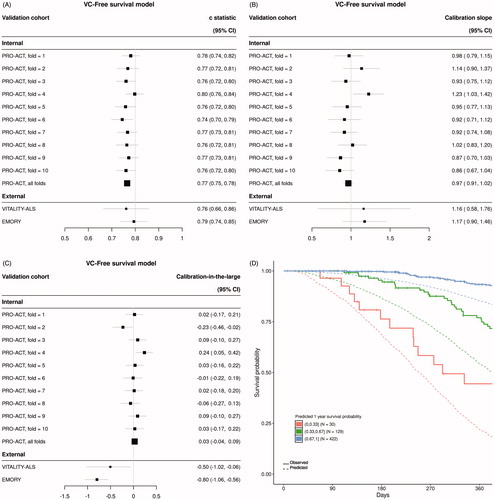
Figure 3 Summary of UNI model performance. (A) Discrimination as measured with the C-statistic, (B) calibration as measured with calibration slope and (C) calibration-in-the-large for each of 10-folds from internal cross validation and two external datasets. (D) Visual translation of discrimination and calibration for all Emory clinic patients. Patients are stratified by predicted probability of survival at one year and Kaplan–Meier curves are plotted against mean predicted curves for each stratum.
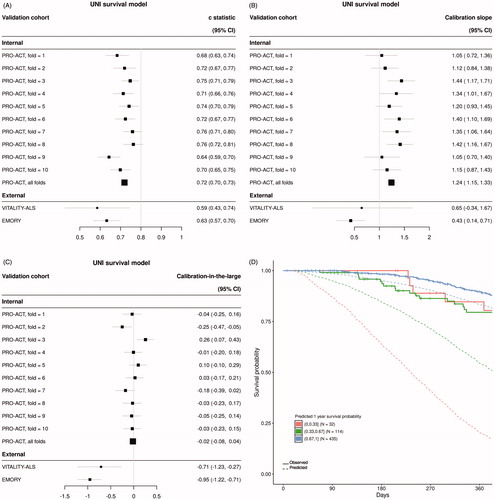
Calibration was assessed for each model using calibration slope () and calibration-in-the-large (). The VC-Free model slightly outperformed both the VCI model and the UNI model when assessing calibration on the internal data [calibration slope (95% CI): VCI 0.93 (0.88, 0.97), VC-Free 0.97 (0.91, 1.02), UNI 1.24 (1.15, 1.33); calibration-in-the-large (95% CI): VCI −0.07 (−0.13, −0.01), VC-Free 0.03 (−0.04, 0.09), UNI −0.02 (−0.08, 0.04)]. Calibration on external datasets degraded from internal validation for all three models; however, the VC-Free model showed superior calibration for the external Emory clinic data over both the VCI and UNI models. This can be visually observed in for the VC-Free model comparing actual Kaplan–Meier curves to mean predicted curves for several prediction defined risk strata compared to the equivalent plots for the VCI () and UNI models ().
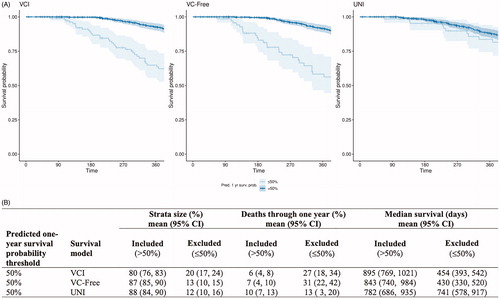
Recent ALS trials have defined BL%VC >50% as an inclusion criterion (example: the HEALEY ALS Platform Trial). Plotting BL%VC against predicted probability of one-year survival from the UNI model, , shows a 50% predicted probability of one-year survival coincidentally aligns with BL 50%VC. Thus, this prediction threshold was used to define included vs. excluded patients in our simulations. shows Kaplan–Meier curves of actual one-year survival for the entire Emory population, stratified by the 50% predicted survival cutoff applied to patient predictions from each model. These curves clearly display a greater visual separation in survival curves when strata are defined using the multivariable models (VCI and VC-Free) compared to the UNI model. quantifies the differences in survival for the included (>50% predicted one-year survival) vs. excluded (≤50% predicted one-year survival) populations across 100 simulations for all three models. On average, 10% of the included patients defined by the UNI model died within one year, a small decrease from 13% in the excluded group. Additionally, these included patients had only a very modest increase in median survival (mean = 782 days) compared to the excluded group (mean = 741 days), whereas both the VCI and VC-Free models selected groups for inclusion that were substantially enriched for survival (deaths through one year: VCI 6%, VC-Free 7%; median survival: VCI 895 days, VC-Free 843 days) as compared to the excluded population (deaths through one year: VCI 27%, VC-Free 31%; median survival: VCI 454 days, VC-Free 430 days). The included group defined by the UNI model corresponds to 88% of screened patients, 80% for the VCI model, and 87% for the VC-Free model.
Figure 4 BL%VC vs. predicted probability of one-year survival from UNI model. A vertical red line is plotted at BL 50%VC, a common ALS clinical trial inclusion criteria cutoff.
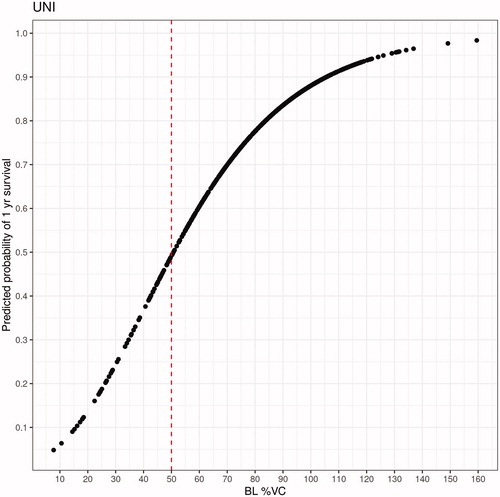
Figure 5 Trial enrichment results. (A) Kaplan-Meier curves plotted for patients with ≤50% (excluded) or >50% (included) predicted probability of survival at one year based on predictions from each model: VCI, VC-Free, & UNI. Stratified survival data through one year is plotted for all Emory clinic patients (N = 581). (B) Results of 100 simulations of N = 250 sampled from the Emory clinic data. For each simulation, all sampled patients were assessed for inclusion into the ‘trial’. Patients were ‘included’ if their predicted probability of one-year survival was >50% based on each model prediction and ‘excluded’ if their prediction was ≤50%. 95% confidence intervals (CI) are derived from the quantiles of the bootstrapped samples.
Discussion
A robust machine-learning survival model was generated without the use of baseline vital capacity measures. Compared to the VCI model (), the VC-Free model () purposely lacking vital capacity predictors was remarkably strong. The model had slightly reduced discrimination on internal validation, and slightly improved calibration. The model maintained performance with the VITALITY-ALS trial dataset and showed improved performance with the Emory clinic dataset. These datasets are both contemporary and fully external to the PRO-ACT training set, an indication of the strength of the VC-Free model. The strong discrimination results indicate that the model is useful for stratification.
It is important to note that PRO-ACT is an aggregate of 23 clinical trials, many of which had inclusion criteria that limited baseline %VC. A model fit to clinical trial populations may suffer when applied to an unrestricted patient population such as the Emory clinic data. When a strong selector such as VC is removed from a model trained with clinical trial data, performance on a clinic dataset may improve modestly, as was observed with the Emory clinic data.
As reflected in the recent FDA Guidance (Citation32), a trend in the design of ALS clinical trials is to move toward broader inclusion criteria. Thus, it is particularly significant that a multivariable prognostic model (i.e., the VC-Free model), when applied to a broad clinic population, demonstrated superior performance in selecting patients most likely to survive the duration of a clinical trial. The median survival time of the patients excluded using the VC-Free model (mean = 430 days) was substantially lower compared to the use of the BL%VC univariable model (mean = 741 days), while excluding the same proportion of patients (VC-Free: 13%, UNI: 12%). From these results, one could contend that even fewer patients could be excluded using the VC-Free model while still outperforming the modest enrichment provided by the BL%VC cutoff. As access to ALS clinical trials is expanded to a broader patient population, the use of the VC-Free or, postpandemic, the VCI model rather than BL%VC in eligibility determinations will lead to the inclusion of more patients while simultaneously excluding those patients least likely to survive the trial. We do acknowledge a limitation of this analysis is that it assumes a single criterion for inclusion. More commonly several inclusion criteria are defined, and such additional layers of patient selection could impact the magnitude of results.
The survival model is multifactorial (), and this may have contributed to the successful creation of a robust model lacking baseline VC. The original top feature, baseline VC slope, reached a 15% variable importance, indicating that survival predictions are dependent on multiple features and allowing other features to rise in importance upon the removal of the VC predictors. In assessing these models, it is important to consider that the VC-Free model was built for the express purpose of empirically predicting ALS survival, not as a model to causally explain ALS (Citation33). A model built to explain ALS would by necessity include VC as it is a key predictor. If the purpose of the model is to predict survival, one can more readily accept that other features may be able to account for some of the contributions of a missing key predictor. These findings indicate the plasticity and rapid adaptability of tree-based machine-learning methods for predicting outcomes.
Comparing the Emory and the PRO-ACT datasets offers insights into the differences between patients seen at tertiary care clinics and patients typically included in clinical trials (). There appears to be a trend toward greater male participation and a selection for younger patients. In addition, clinical trials include fewer bulbar patients than the clinic population. Interestingly, compared to the Emory clinic data, both time since symptom onset and diagnosis are greater in the PRO-ACT population while the baseline functional score and %VC are similar. As a result, the ALSFRS-R and %VC slopes are attenuated in the clinical trial population. Taken in their entirety, the eligibility criteria applied in the clinical trials included in PRO-ACT selected younger, less bulbar participants with slower rates of functional and respiratory decline than a wider clinic population.
When assessing the population to use for simulations (), we considered the PRO-ACT patient population, but noted that an analysis using PRO-ACT would not be representative of patients undergoing an initial eligibility determination due to the previous application of selection criteria applied to each clinical trial included in this database. A more realistic situation is captured by the analysis of the Emory clinic patient records naïve to selection criteria. Simulations using the Emory data clearly show that both the VC-Free and VCI models achieved a better separation of survival curves between the included and excluded populations over the simple application of the BL%VC only (UNI) model. This can be attributed to the multiple predictors in the VC-Free and VCI models. Rather than using the single BL%VC as a predictor, the predicted probability includes the relative contributions of 31 predictors in a single metric. Thus, the predicted survival probability essentially summarizes in a single metric the available prognostic information for each individual.
We have shown that a multivariable survival model without VC measures (VC-Free) performs as well as a multivariable survival model including VC measures (VCI) and significantly better than a univariable model including only BL%VC (UNI). Prediction-defined inclusion criteria from a VC-Free model can be considered in place of baseline %VC criterion during the COVID pandemic when VC readings are difficult to obtain. The improved stratification demonstrated by using predicted survival compared to the use of baseline %VC should also be a consideration in the design of eligibility criteria for future, post-pandemic ALS clinical trials. The VC-Free model has the potential to make remote screening possible while eliminating the need for spirometry for trial inclusion. Risk-based selection criteria using prognostic models should lead to ALS clinical trials that are more inclusive, more rapidly enrolled and, more generalizable to the majority of ALS patients.
Declaration of interest
No potential conflict of interest was reported by the author(s).
Supplemental Material
Download MS Word (41.7 KB)Acknowledgments
The machine learning models described here were created using the PRO-ACT database. We thank Cytokinetics for generously providing access to the VITALITY-ALS placebo dataset for use in these studies.
Additional information
Funding
References
- Ravits JM, La Spada AR. ALS motor phenotype heterogeneity, focality, and spread: Deconstructing motor neuron degeneration. Neurology. 2009;73:805–11.
- Goyal NA, Berry JD, Windebank A, Nathan P, Maragakis NJ, Berg LH, et al. Addressing heterogeneity in ALS clinical trials. Muscle Nerve. 2020;62:156–66.
- Moore DH, Katz JS, Miller RG. A review of clinical trial designs in amyotrophic lateral sclerosis. Neurodegen Dis Manage. 2011;1:481–90.
- McDermott CJ. Clinical trials in amyotrophic lateral sclerosis. Curr Opin Neurol. 2019;32:758–63.
- van Eijk RPA, Westeneng HJ, Nikolakopoulos S, Verhagen IE, van Es MA, Eijkemans MIC, et al. Refining eligibility criteria for amyotrophic lateral sclerosis clinical trials. Neurology. 2019;92:e451–e460.
- Czaplinski A, Yen AA, Appel SH. Forced vital capacity (FVC) as an indicator of survival and disease progression in an ALS clinic population. J Neurol Neurosurg Psychiatry. 2005;77:390–2.
- Czaplinski A, Yen AA, Appel SH. Amyotrophic lateral sclerosis: early predictors of prolonged survival. J Neurol. 2006;253:1428–36.
- Berry JD, Taylor AA, Beaulieu D, Meng L, Bian A, Andrews J, et al. Improved stratification of ALS clinical trials using predicted survival. Ann Clin Transl Neurol. 2018; 5:474–85.
- Westeneng H-J, Debray TPA, Visser AE, van Eijk RPA, Rooney JPK, Calvo A, et al. Prognosis for patients with amyotrophic lateral sclerosis: development and validation of a personalised prediction model. Lancet Neurol.2018;17:423–33.
- Andrews JA, Berry JD, Baloh RH, Carberry N, Cudkowicz ME, Dedi B, et al. Amyotrophic lateral sclerosis care and research in the United States during the COVID-19 pandemic: challenges and opportunities. Muscle Nerve. 2020;62:182–6.
- Norris SP, Likanje MN, Andrews JA. Amyotrophic lateral sclerosis: update on clinical management. Curr Opin Neurol. 2020;33:641–8.
- De Marchi F, Cantello R, Ambrosini S, Mazzini L, CANPALS Study Group. Telemedicine and technological devices for amyotrophic lateral sclerosis in the era of COVID-19. Neurol Sci. 2020;41:1365–7. Jun
- Capozzo R, Zoccolella S, Musio M, Barone R, Accogli M, Logroscino G. Telemedicine is a useful tool to deliver care to patients with amyotrophic lateral sclerosis during COVID-19 pandemic: results from Southern Italy. Amyotroph Lateral Scler Frontotemporal Degener 2020;21:542–548.
- Vasta R, Moglia C, D'Ovidio F, Di Pede F, De Mattei F, Cabras S, et al. Telemedicine for patients with amyotrophic lateral sclerosis during COVID-19 pandemic: an Italian ALS referral center experience. Amyotroph Lateral Scler Frontotemporal Degener 2021;22:308–311.
- Govindarajan R, Berry JD, Paganoni S, Pulley MT, Simmons Z. Optimizing telemedicine to facilitate amyotrophic lateral sclerosis clinical trials. Muscle Nerve. 2020;62:321–6.
- Zach N, Ennist DL, Taylor AA, Alon H, Sherman A, Kueffner R, et al. Being PRO-ACTive - What can a clinical trial database reveal about ALS? Neurotherapeutics. 2015;12:417–23.
- Shefner JM, Cudkowicz ME, Hardiman O, Cockroft BM, Lee JH, Malik FI, VITALITY-ALS Study Group, et al. A phase III trial of tirasemtiv as a potential treatment for amyotrophic lateral sclerosis. Amyotroph Lateral Scler Frontotemporal Degener. 2019;20:584–94.
- Traxinger K, Kelly C, Johnson BA, Lyles RH, Glass JD. Prognosis and epidemiology of amyotrophic lateral sclerosis: Analysis of a clinic population, 1997-2011. Neurol Clin Pract. 2013;3:313–20.
- Breiman L 2001. Random Forests. Machine Learning Journal 45:5-32. Available at Berkeley Statistic Department website: https://www.stat.berkeley.edu/∼breiman/randomforest2001.pdf
- Moons KGM, Wolff RF, Riley RD, Whiting PF, Westwood M, Collins GS, et al. PROBAST: a tool to assess risk of bias and applicability of prediction model studies: explanation and elaboration. Ann Intern Med. 2019;170:W1.
- Friedman JH. Greedy function approximation: a gradient boosting machine. Ann. Stat 2001;29:1189–232.
- Steyerberg EW, Vergouwe Y. Towards better clinical prediction models: seven steps for development and an ABCD for validation. Eur Heart J. 2014;35:1925–31.
- Harrell FE, Lee KL, Mark DB. Multivariable prognostic models: issues in developing models, evaluating assumptions and adequacy, and measuring and reducing errors. Statist Med. 1996;15:361–87.
- Crowson CS, Atkinson EJ, Therneau TM. Assessing calibration of prognostic risk scores. Stat Methods Med Res. 2016;25:1692–706.
- Steyerberg EW. 2019. Chapter 17: Validation of prediction models. In: Clinical prediction clinical prediction models: a practical approach to development, validation, and updating. Cham, Switzerland: Springer Nature, 299–311.
- Wickham, H. 2019. Package ‘tidyverse’. Retrieved from The Comprehensive R Archive Network website: https://cran.r-project.org/web/packages/tidyverse/tidyverse.pdf
- Ishwaran H, Kogalur UB. 2020. Package ‘randomForestSRC’. Retrieved from The Comprehensive R Archive Network website: https://cran.r-project.org/web/packages/randomForestSRC/randomForestSRC.pdf
- Ridgeway G, Edwards D, Kriegler B, Schroedl S, Southworth H. 2020. Package ‘gbm’. Retrieved from The Comprehensive R Archive Network website: https://cran.r-project.org/web/packages/gbm/gbm.pdf
- Therneau T. 2020. Package ‘survival’. Retrieved from The Comprehensive R Archive Network website: https://cran.r-project.org/web/packages/survival/survival.pdf
- Heagerty PJ. 2015. Package ‘survivalROC’. Retrieved from The Comprehensive R Archive Network website: https://cran.r-project.org/web/packages/survivalROC/survivalROC.pdf
- Kassambara A. 2020. Package ‘survminer’. Retrieved from The Comprehensive R Archive Network website: https://cran.r-project.org/web/packages/survminer/survminer.pdf
- FDA. 2019. Amyotrophic Lateral Sclerosis: Developing Drugs for Treatment. Guidance for Industry. Retrieved May 1, 2020 from FDA website: https://www.fda.gov/media/130964/download
- Shmueli G. To explain or to predict? Statist Sci. 2010;25:289–310.