
Abstract
Introduction: The edaravone development program for amyotrophic lateral sclerosis (ALS) included trials MCI186-16 (Study 16) and MCI186-19 (Study 19). A cohort enrichment strategy was based on a Study 16 post hoc analysis and applied to Study 19 to elucidate a treatment effect in that study. To determine whether the Study 19 results could be generalized to a broader ALS population, we used a machine learning (ML) model to create a novel risk-based subgroup analysis tool. Methods: A validated ML model was used to rank order all Study 16 participants by predicted time to 50% expected vital capacity. Subjects were stratified into nearest-neighbor risk-based subgroups that were systematically expanded to include the entire Study 16 population. For each subgroup, a statistical analysis generated heat maps that revealed statistically significant effect sizes. Results: A broad region of the Study 16 heat map with significant effect sizes was identified, including up to 70% of the trial population. Incorporating participants identified in the cohort enrichment strategy yielded a broad group comprising 76% of the original participants with a statistically significant treatment effect. This broad group spanned the full range of the functional score progression observed in Study 16. Conclusions: This analysis, applying predictions derived using an ML model to a novel methodology for subgroup identification, ascertained a statistically significant edaravone treatment effect in a cohort of participants with broader disease characteristics than the Study 19 inclusion criteria. This novel methodology may assist clinical interpretation of study results and potentially inform efficient future clinical trial design strategies.
Introduction
Amyotrophic lateral sclerosis (ALS) is an incurable, progressive, and fatal neuromuscular disease characterized by degeneration of motor neurons in the brain and spinal cord (Citation1,Citation2). ALS patients typically live 2–5 years from disease onset, and 50% die within 30 months of symptom onset (Citation1,Citation3,Citation4). Current treatment includes disease-modifying therapy, symptom management, and palliative care (Citation5).
Two therapies—riluzole and edaravone—have been approved for treating ALS in a number of countries (Citation6,Citation7). Riluzole, in use since the mid-1990s in the United States (US) and Europe, was shown to prolong survival by 2–3 months (Citation7,Citation8). Radicava® (edaravone) is approved for use in Japan, the US, South Korea, Canada, and Switzerland. Edaravone slows the rate of functional loss by 33% over 24 weeks as measured by scores on the revised ALS Functional Rating Scale (ALSFRS-R, Citation6,Citation9).
The conduct of ALS clinical trials has been notoriously difficult, complicated by heterogeneity of disease progression and other factors (Citation10,Citation11). Such heterogeneity restricts the ability to identify well-defined patient subgroups and potentially increases type II error resulting from excessive variance in the endpoint assessing efficacy. In the edaravone clinical development program, an enrichment strategy was adopted to study a patient population in which a significant treatment effect might be demonstrated (Citation11–13). Study 16, an early phase 3, 24-week edaravone trial, showed numerical results favoring edaravone on the primary endpoint, change from baseline in ALSFRS-R score, but the effect was not statistically significant (Citation12). Post hoc analysis of Study 16 identified 2 populations in which significant treatment effects were demonstrated (Citation12,Citation13). The characteristics of these populations were defined in two steps (steps 1 and 2, ). Analysis of the Step 1 and 2 populations showed that these patients experienced significantly less decline in ALSFRS-R score with edaravone versus placebo (Citation12,Citation13). For this reason, the Step 2 post hoc criteria were utilized as inclusion criteria for the subsequent phase 3 trial, Study 19 (Citation9). The primary objective of Study 19 was to confirm the efficacy of edaravone versus placebo in ALS patients based on the 24-week change in the ALSFRS-R score.
Table 1 Summary of Study 16 post hoc analysis populations.
Study 19 demonstrated a significant effect of edaravone in slowing functional decline (Citation9). For example, the least squares mean ± standard error (SE) values for the change in ALSFRS-R score during 24 weeks were −7.50 ± 0.66 for placebo versus −5.01 ± 0.64 for edaravone. The between-group difference was 2.49 ± 0.76 (p = 0.0013). The enrichment strategy used for Study 19 had several important features. First, it likely reduced the clinical heterogeneity of the study population and the proportion of slowly progressing patients (Citation11,Citation13). Second, the result of a combined decrease in heterogeneity and increase in measurable treatment effect increased the possibility of achieving a statistically significant difference in outcome measures between treatment arms (Citation11,Citation13). Study 19 imposed stringent selection criteria, substantially reducing the eligible pool of patients. This effect is exemplified by the proportion of patients in the Study 16 group selected using those criteria (68/199, 34%). Third, the selection criteria implemented for Study 19 helped identify patients more likely to demonstrate a significant treatment effect. What remains unclear is whether this methodology uncovered a subgroup of patients with an elevated edaravone response or simply demonstrated a treatment effect common to a broad range of ALS patients in a mathematically optimized subgroup. Whether Study 19 results can be generalized to a broader ALS population would be valuable for clinicians to know when managing patients in real-world practice. To explore this, we applied a machine learning (ML) model to Study 16 outcomes data, stratifying patients based on predicted outcomes to create a novel, risk-based subgroup analysis tool.
Methods
Studies 16 and 19
Data from edaravone clinical Studies 16 and 19 were used as the source for analyses. Study 16 was a randomized, double-blind, parallel-group, placebo-controlled study that included a 24-week double-blind period followed by a 24-week open-label active-treatment extension period (Citation12). Eligible patients fulfilled the following criteria: (1) 20–75 years of age, (2) a diagnosis of “definite,” “probable,” or “probable laboratory-supported” ALS according to the El Escorial and revised Airlie House criteria, (3) forced vital capacity (FVC) ≥70% predicted, (4) less than 3 years disease duration from first ALS symptom, (5) change in ALSFRS-R score of −1 to −4 during a 12-week observation period prior to the start of the study, and (6) ALS of grade 1 or 2 in the Japan ALS Severity Classification. After the observation period, eligible patients were randomly assigned 1:1 to edaravone or placebo for 24 weeks. The intent-to-treat population included 101 edaravone and 104 placebo patients. Study 19 was also a randomized, 24-week double-blind, parallel-group, placebo-controlled study that included 69 edaravone and 68 placebo patients. Eligibility criteria were developed following a post hoc analysis of Study 16. Age and change in ALSFRS-R score during an observation period were the same, but Study 19 included an El Escorial diagnosis of “definite” or “probable,” FVC ≥80% , less than 2 years disease duration, and scores ≥2 on all ALSFRS-R items, with a respiratory score ≥4. In both studies, edaravone was administered once daily in 60-mg doses via 60-minute intravenous infusions. Infusions were given for 14 days for the first cycle and for 10 of the 14-day periods for all subsequent cycles. Each treatment cycle was followed by a 14-day drug-free period. The primary efficacy endpoint in both studies was the change in ALSFRS-R from baseline to the end of week 24.
Machine learning model
This analysis utilized a previously validated gradient boosting machine model to predict the log-hazard risk of patients progressing to 50% expected vital capacity (VC50) . This model was developed using the clinical trial records of 4600 unique patients included in the Pooled Resource Open-Access ALS Clinical Trials (PRO-ACT) database (the “internal” data set) (Citation14). VC50 was reached during the period of their respective trials by 1926 (42%) of the patients. The model has an average area under the receiver operating curve (AUC) measured at the 1-year time point in a 10-fold internal cross-validation of 0.868, and an AUC of 0.923 using the placebo arm of the contemporary, external 6-month-long BENEFIT-ALS clinical trial (Citation14,Citation15).
Detectable effect cluster analysis
The protocol for detectable effect cluster (DEC) analysis is outlined in . Using the VC50 model, Study 16 patients were rankordered by their predicted log-hazards. Patients with low risk were listed first and patients with high risk were listed last. A preliminary analysis stratified the patients into tertiles based on this ordering. A more detailed analysis was performed by stratifying patients into 50 subgroups using the same ordering. For both the preliminary and detailed analyses, each of the risk-based subgroups was systematically expanded in 2% increments until the entire Study 16 population was included. For example, the low-risk tertile initially included 33% of patients. This group was analyzed to assess treatment effect. The group was then expanded to include 35% of patients, adding the patients with risk scores just greater than the initial group. This group was reanalyzed to assess treatment effect. The process was continued until the initial low-risk group was expanded to the entire full analysis set (FAS). The moderate- and high-risk tertiles were similarly expanded in 2% increments.
Figure 1 Detectable effect cluster analysis: a novel subgroup analysis method.
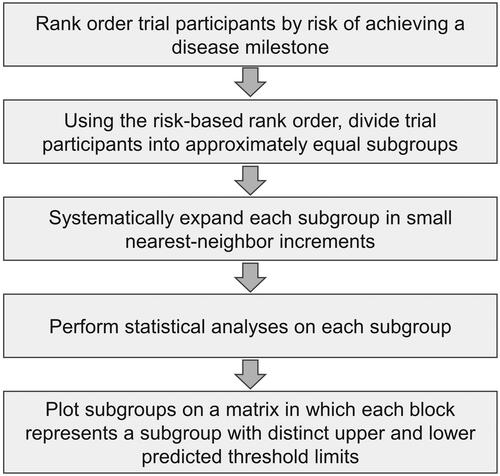
To visualize the results of the detailed analysis, a matrix was constructed in which each cell defined a subgroup with distinct upper and lower values for predicted log-hazard. One possible subgroup might be patients with log-hazard in the range from the 40th to 60th percentile of the FAS. Another could be from the 36th to 52nd percentile. All possible nearest-neighbor subgroups were created, for a total of 1275 groups (51 × 50 ÷ 2). While every cell includes trial participants that are contiguous by log-hazard rank, note that the subgroups are not distinct and that patients will appear in multiple subgroups.
A statistical analysis was performed for each subgroup as described in the original Study 16 statistical analysis plan. A heat map was developed that revealed combinations of treatment effect and mean square error (MSE) with statistically significant effect sizes (p < 0.05).
Results
Fifty percent expected vital capacity predictions
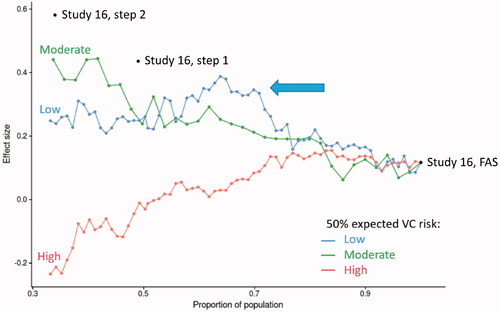
Predicted VC50 log-hazard values for each patient in studies 16 and 19 were generated using each individual’s baseline data. The distribution of VC50 risk in studies 16 and 19 is shown in . The Study 16 population was divided into tertiles, as shown in . The tertile populations were expanded in a stepwise fashion to gradually include the full study population. For example, the low-risk tertile was expanded to include patients with higher and higher risk scores. The series of Study 16 FAS VC50 subgroups thus created were then analyzed according to effect size (). The analysis revealed a population with improved treatment effect that included approximately 70% of the Study 16 FAS (, peak in the low-risk line graph, identified by the arrow).
Figure 2 Study 16 and 19: predicted VC50 population distribution. (A) Graph of the distribution of time to predicted VC50 for the Study 16 FAS. The distribution was divided into tertiles of low, moderate, and high risk for VC50 for subsequent analysis depicted in . (B) Distribution of Study 16 and 19 predicted VC50 risk profiles. The means in the two groups were similar (−1.03 and −0.91), and a t-test comparing the risk profile between the two studies was not significantly different (p = 0.13).
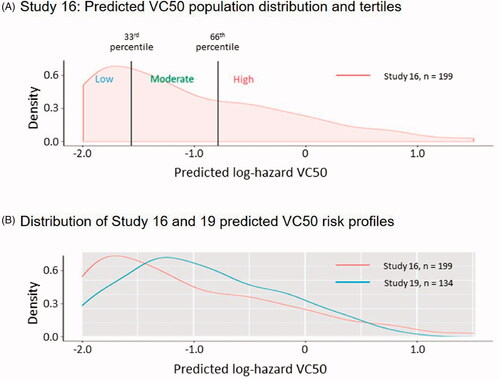
Figure 3 Effect size of the VC50 tertiles and expanded populations. The low-, moderate-, and high-risk tertile groups for VC50 were plotted according to the proportion of the population versus the effect size for that group. The population within each group was expanded at 2% increments and then plotted on the graph. The arrow indicates the area of the population within the low-risk group (blue line) that shows a local maximum in effect size. The locations of the Study 16 FAS, Step 1, and Step 2 populations are also shown. Effect size: treatment effect ÷ MSE; FAS: full analysis set; MSE: mean square error; VC50: 50% expected vital capacity.
Detectable effect cluster analysis
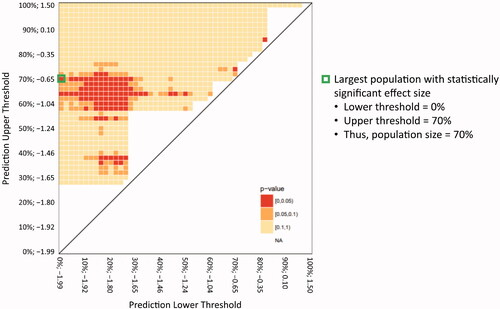
DEC analysis was used, as described in Methods, to analyze 1275 subgroups of the Study 16 FAS population. The DEC analysis matrix identified a broad region of the Study 16 heat map with significant effect sizes (). The VC50 largest population (designated VC50lp) with statistically significant effect size included 70% of the Study 16 FAS population (, green, boxed cell). For orientation, the smallest subgroups are located along the diagonal spanning from the lower left corner of the heat map to the upper right corner. The incremental nearest-neighbor 2% expansions are located vertically up from each of the initial subgroups. When constructed this way, the upper left corner of the matrix represents the FAS. Every subgroup between the subgroups along the diagonal and the FAS includes an ever-increasing number of nearest-neighbor participants. It should be noted that in , the heat map shows clear areas above the diagonal with no apparent subgroup—these are areas that contained too few participants in either arm before a meaningful comparison and were not included in the matrix for clarity. While each subgroup includes a unique set of participants, all subgroups, except for the initial 50 subgroups, overlap with many of the other subgroups.
Figure 4 Heat map of DEC analysis of effect size in Study 16 FAS. Heat map matrix of the DEC analysis nearest-neighbor risk-based groups. The populations were plotted according to the lower threshold of the population distribution (X-axis) versus the upper threshold of the population distribution (Y-axis), with numbers on each axis representing the percentage and log-hazard of VC50 for each threshold. The color of each square represents the calculated p-value for that population; red: ≥0 to <0.05; orange: ≥0.05 to <0.1; and yellow: ≥0.1 to <1. DEC: detectable effect cluster; FAS: full analysis set; VC50: 50% expected vital capacity.
When the VC50lp was combined with non-overlapping participants identified in the Study 16 Step 1 population (VC50lp + Step 1), 76.4% (n = 152) of the original participants were identified with a statistically significant treatment effect (). Study 16 Step 1 and Step 2 achieved significant effect sizes primarily by an increase in treatment effect, with a modest effect on MSE. In contrast, the VC50lp population achieved a significant effect size mainly by a decrease in heterogeneity, as evidenced by a substantially lower MSE, while having a modest increasing treatment effect. Overall, the VC50lp + Step 1 population displayed intermediate improvement in both treatment effect and MSE.
Table 2 Treatment effect sizes of the study populations.
Baseline characteristics of Studies 16 and 19 full analysis set and Study 16 subgroups
The distribution of VC50 risk profiles in Studies 16 and 19 were similar (). Compared with Study 16, Study 19 had fewer patients in the high- and low-risk groups, so the tails of the distribution were less pronounced. includes populations of the Study 19 FAS (N = 134), Study 16 FAS (N = 199), VC50lp + Step 1 (n = 152), VC50lp (n = 139), and those “not selected” (n = 47), which comprised the FAS patients minus patients in Step 1 and VC50lp.
Table 3 Baseline characteristics of the Study 16 and Study 19 FAS compared with the other populations identified in this study.
The “not selected” subgroup exhibited lower baseline ALSFRS-R (mean 39.8 points) and percent expected vital capacity (VC; mean 79%) than the other four groups. Compared with the Study 16 and 19 FAS, the VC50lp + Step 1 and VC50lp populations had similar baseline characteristics for sex, age, body mass index, days since symptom onset, and ALSFRS-R score (). However, pulmonary function (i.e. percent expected FVC) appeared to be slightly greater in the VC50lp + Step 1 and VC50lp populations. There were no deaths during the trial in the VC50lp + Step 1 or VC50lp populations compared with 3 deaths in the “not selected” subgroup. Importantly, while the mean baseline ALSFRS-R and percent expected VC values for the “not selected’ subgroup were decidedly lower than the other four groups, a simple separation of the “not selected” group could not be made due to the marked overlap in the ranges of the values.
Although the mean percent expected VC was similar between the Study 19 FAS and the VC50lp + Step 1 population, the range of values for percent expected VC included lower levels of pulmonary function in the VC50lp + Step 1 population due to the Study 19 inclusion criterion of >80% expected FVC. Importantly, while the mean and median were similar, the range of baseline ALSFRS-R scores included lower values in the VC50lp + Step 1 population versus the Study 19 FAS. This latter effect on baseline ALSFRS-R was certainly influenced by the Study 19 inclusion criteria of ≥2 points for all items in the ALSFRS-R at baseline.
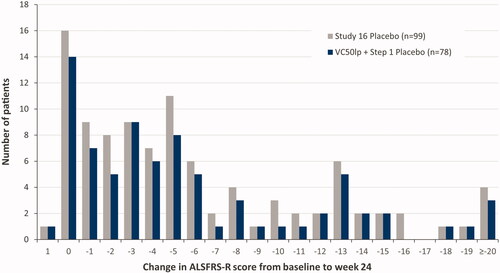
The distribution of changes in ALSFRS-R score from baseline to week 24 in the VC50lp + Step 1 placebo population was compared with the full Study 16 placebo population. The VC50lp + Step 1 placebo population spanned the entire range of ALSFRS-R scores observed for the Study 16 placebo population ().
Figure 5 Distribution of changes in ALSFRS-R score from baseline to week 24: Study 16 placebo patients (gray) vs VC50lp + Step 1 placebo patients (dark). ALSFRS-R: revised ALS Functional Rating Scale; VC50lp: VC50 largest population.
Discussion
Strategic enrichment strategies in ALS clinical trials are designed to overcome statistical challenges related to the inclusion of slow progressors and disease heterogeneity. However, questions remain about the applicability of results obtained using restrictive inclusion criteria in a registration trial to the broader patient population in real-world situations.
When machine learning techniques were applied to the Study 16 population data, a statistically significant edaravone treatment effect was found in a patient cohort broader than the Study 19 inclusion criteria. For example, the VC50lp + Step 1 population experienced a greater number of days since symptom onset (mean 625 ± 242) than Study 19 (mean 403 ± 170). These differences are likely due to differences in disease duration entry criteria for the two phase 3 studies, which were ≤3 years for Study 16 and ≤2 years for Study 19. Also, the VC50lp + Step 1 population had a lower baseline range of % expected VC values (75.2%–143.4%) than Study 19 (80.2–151.0%), likely due to differences in FVC entry criteria for the 2 studies, which were ≥70% expected for Study 16 and ≥80% expected for Study 19. Moreover, the range of ALSFRS-R scores was broader in the VC50lp + Step 1 population (29–47) than for Study 19 (36–47) and Study 16 had no restrictions in ALSFRS-R item scores. Thus, the VC50lp + Step 1 population included patients with a broader range of ALS disease characteristics at baseline than those of the Study 19 patient population. These findings are consistent with a previous Study 19 subgroup analysis, which indicated that the effect of edaravone on disease progression is more generalizable than the Study 19 inclusion criteria might otherwise indicate (Citation16).
As a post hoc analysis, this analysis is subject to the limitations inherent in such methodologies. For example, these analyses were not prespecified in Study 16. In addition, although p-values were calculated for each of the nearest-neighbor risk-based groups in the DEC analysis, the study was not powered to detect significant differences between the edaravone and placebo groups for each of these populations. Thus, the current analysis does not control for multiplicity in the DEC analysis p-value calculations.
Analysis of disease progression in the Study 16 placebo group and the VC50lp + Step 1 population indicated that the latter population included a wide range of disease progression from slow to rapid decline in the ALSFRS-R score. Thus, the VC50lp + Step 1 population, which exhibited an edaravone treatment effect, included patients with a range of disease progression rates reflective of the full Study 16 population. The wider question of generalizability beyond the Study 16 inclusion criteria remains to be determined in real-world analyses (Citation17).
Characteristics of the 47 patients in the “Study 16 not selected” population warrant further discussion (, last column on right). These patients experienced fewer days since symptom onset, lower baseline ALSFRS-R scores, lower baseline percent expected VC, and included all 3 of the deaths in Study 16. However, separating these patients based on baseline functional score or VC would be very difficult, as the ranges of the “not selected” group overlapped with the ranges of patients included in the other groups.
We initially hypothesized that a model predicting functional decline would be useful for creating groups of patients at a similar point in their disease progression, particularly if the endpoint is ALSFRS-R. However, if Patient A progresses from 46 to 40 points and Patient B progresses from 28 to 22 points, they progress at a similar rate, but Patient B is clearly more impaired and in a more advanced state of the disease than Patient A. In contrast, the VC50 model returns a prediction that can be viewed as a disease milestone, 50% vital capacity. When we apply DEC analysis using the time to 50% VC model, we effectively group patients by risk of achieving this disease milestone. Rather than grouping patients by predicted change in ALSFRS-R who may be in different states of the disease, the VC50 model succeeds in grouping patients who are in similar disease states.
This modeling methodology may assist the clinical interpretation of study results beyond inclusion criteria and may inform future, more efficient clinical trial design strategies for ALS. For example, the Study 16 steps 1 and 2 subgroups and the VC50lp subgroup demonstrate alternate strategies for defining a study population. Steps 1 and 2 achieved statistical significance by increasing the treatment effect while having relatively little impact on lowering the variance. In contrast, the VC50lp subgroup boosted the treatment effect to a lesser degree but had a more dramatic effect in lowering the variance. Also, regarding strategies for trial design, Step 2 included 34% of the Study 16 population, whereas the VC50lp included 70% of the Study 16 population. This latter consideration will have a significant effect on trial recruitment time. Finally, this methodology confirms the possibility of identifying a subpopulation within a failed clinical trial that could form the basis for a subsequent successful trial.
Acknowledgments
The authors thank Alex Morla, PhD, of p-value communications for editorial assistance. p-value communications received funding from MTPA for editorial assistance on this article.
Declaration of interest
B. R. B. has received clinical trial and research funding from NIH/CDC/RTI, MDA Association, ALS Association, Medicinova, Alexion, and Biogen. He serves as consultant to Avanir Pharmaceuticals, Inc., Biohaven Pharmaceuticals, Cytokinetics, Inc., ITF Pharma, Inc., MTPA, Amylyx, and Otsuka America, Inc. E. P. P. has received clinical trial and research funding from NIH/CDC, ALS Association, and Iron Horse Diagnostics, Inc. He serves as consultant to Argenx, Avanir Pharmaceuticals, Inc., Biohaven Pharmaceuticals, Cytokinetics, Inc., ITF Pharma, Inc., MTPA, NeuroTherapia, Inc., and Otsuka America, Inc. S. A. is an employee of MTPA. W. A., and J. P. are former employees of MTPA. M. S., D. B., A. A. T., M. K., and D. L. E. are employees of Origent Data Sciences, Inc.
Additional information
Funding
References
- Brown RH, Al-Chalabi A. Amyotrophic lateral sclerosis. N Engl J Med. 2017;377:162–72.
- G. B. D. Motor Neuron Disease Collaborators. Global, regional, and national burden of motor neuron diseases 1990–2016: a systematic analysis for the Global Burden of Disease Study 2016. Lancet Neurol. 2018;17:1083–97.
- Oskarsson B, Gendron TF, Staff NP. Amyotrophic lateral sclerosis: an update for 2018. Mayo Clin Proc. 2018;93:1617–28.
- Kiernan MC, Vucic S, Cheah BC, Turner MR, Eisen A, Hardiman O, et al. Amyotrophic lateral sclerosis. Lancet. 2011;377:942–55.
- Miller RG, Jackson CE, Kasarskis EJ, England JD, Forshew D, Johnston W, Quality Standards Subcommittee of the American Academy of Neurology, et al. Practice parameter update: the care of the patient with amyotrophic lateral sclerosis: drug, nutritional, and respiratory therapies (an evidence-based review): report of the Quality Standards Subcommittee of the American Academy of Neurology. Neurology. 2009;73:1218–26.
- Radicava® (edaravone injection) [package insert]. Jersey City, NJ: Mitsubishi Tanabe Pharma Corporation; August 2018.
- Rilutek® (riluzole) [package insert]. Bridgewater, NJ: sanofi-aventis U.S. LLC; November 2012.
- Miller RG, Mitchell JD, Moore DH. Riluzole for amyotrophic lateral sclerosis (ALS)/motor neuron disease (MND). Cochrane Database Syst Rev. 2012;2012:CD001447.
- Writing Group; Edaravone (MCI-186) ALS 19 Study Group. Safety and efficacy of edaravone in well defined patients with amyotrophic lateral sclerosis: a randomised, double-blind, placebo-controlled trial. Lancet Neurol. 2017;16:505–12.
- Mitsumoto H, Brooks BR, Silani V. Clinical trials in amyotrophic lateral sclerosis: why so many negative trials and how can trials be improved? Lancet Neurol. 2014;13:1127–38.
- Palumbo JM, Hubble J, Apple S, Takei K, Tsuda K, Liu S, et al. Post-hoc analyses of the edaravone clinical trials Study 16 and Study 19: a step toward more efficient clinical trial designs in amyotrophic lateral sclerosis. Amyotroph Lateral Scler Frontotemporal Degener. 2019;20:421–31.
- Abe K, Itoyama Y, Sobue G, Tsuji S, Aoki M, Doyu M, Edaravone ALS Study Group, et al. Confirmatory double-blind, parallel-group, placebo-controlled study of efficacy and safety of edaravone (MCI-186) in amyotrophic lateral sclerosis patients. Amyotroph Lateral Scler Frontotemporal Degener. 2014;15:610–7.
- Edaravone (MCI-186) ALS 16 Study Group. A post-hoc subgroup analysis of outcomes in the first phase III clinical study of edaravone (MCI-186) in amyotrophic lateral sclerosis. Amyotroph Lateral Scler Frontotemporal Degener. 2017;18:11–9.
- Beaulieu D, Taylor AA, Pierce D, Cuerdo J, Schactman M, Keymer M, et al. Chapter 14 – Improving clinical trial efficiency with machine learning models of disease progression. In: Smith RA, Kaspar BK, Svendsen CN, eds. Neurotherapeutics in the Era of Translational Medicine. Academic Press; 2021:333–66. ISBN 9780128164754.
- Shefner JM, Wolff AA, Meng L, Bian A, Lee J, Barragan D, BENEFIT-ALS Study Group, et al. A randomized, placebo-controlled, double-blind phase IIb trial evaluating the safety and efficacy of tirasemtiv in patients with amyotrophic lateral sclerosis. Amyotroph Lateral Scler Frontotemporal Degener. 2016;17:426–35.
- Agnese W, Apple S, Liu S, Zhang J, Hubble J. A post-hoc analysis of edaravone study 19: Forced vital capacity (FVC) subgroup analysis. European Network to Cure ALS (ENCALS) 2018 Meeting; 20–22 June 2018; Oxford, UK. Abstract D31.
- Van Eijk RPA, Westeneng H-J, Nikolakopoulos S, Verhagen IE, van Es MA, Eijkemans MJC, et al. Refining eligibility criteria for amyotrophic lateral sclerosis clinical trials. Neurology. 2019;92:e451–60.