
Abstract
Objective: To test whether high-sensitivity cardiac troponin T (hs-cTnT) could act as a diagnostic or prognostic biomarker in ALS, comparing hs-cTnT to neurofilament light (NfL). Methods: We performed a case-control study, including 150 ALS patients, 28 ALS mimics, and 108 healthy controls, and a follow-up study of the ALS patients, during 2014–2020 in Stockholm, Sweden. We compared concentrations of hs-cTnT in plasma and NfL in the cerebrospinal fluid between cases and controls. To evaluate the diagnostic performance, we calculated the area under the curve (AUC). Hazard ratios (HRs) were estimated from Cox models to assess associations between hs-cTnT and NfL at ALS diagnosis and risk of death. The longitudinal analysis measured changes of hs-cTnT and NfL since ALS diagnosis. Results: We noted higher levels of hs-cTnT in ALS patients (median: 16.5 ng/L) than in ALS mimics (11 ng/L) and healthy controls (6 ng/L). Both hs-cTnT and NfL could distinguish ALS patients from ALS mimics, with higher AUC noted for NfL (AUC 0.88; 95%CI 0.79–0.97). Disease progression correlated weakly with hs-cTnT (Pearson’s r = 0.18, p = 0.04) and moderately with NfL (Pearson’s r = 0.41, p < 0.001). Shorter survival was associated with higher levels of NfL at diagnosis (HR 1.08, 95%CI 1.04–1.11), but not hs-cTnT. hs-cTnT increased (12.61 ng/L per year, 95%CI 7.14–18.06) whereas NfL decreased longitudinally since ALS diagnosis. Conclusions: NfL is a stronger diagnostic and prognostic biomarker than hs-cTnT for ALS. However, hs-cTnT might constitute a disease progression biomarker as it increases longitudinally. The underlying causes for this increase need to be investigated.
Introduction
Cardiac troponin T (cTnT) is commonly used as a biomarker for myocardial infarction (Citation1). Several studies have detected elevated levels of cTnT in patients with neuromuscular disorders (Citation2–8). The role of cTnT in ALS patients is, however, not fully understood as previous studies have reported largely inconsistent results. Elevated levels of cTnT were identified among ALS patients in two studies with 40 and 22 ALS patients, all free of cardiac disease (Citation9,Citation10). In contrast, normal cTnT levels were found in two other studies, including 28 and 60 ALS patients, respectively (Citation11,Citation12).
In the present study, we aimed to investigate the performance of high-sensitivity cTnT (hs-cTnT) in plasma as a diagnostic and prognostic biomarker for ALS, in comparison to NfL in CSF, which is currently one of the most promising biomarkers of ALS (Citation13–21).
Materials and methods
We performed a case-control study and recruited patients who received a diagnosis of ALS between 1 January 2014 and 28 February 2020 at the Karolinska University Hospital neurology clinic that manages all ALS patients in Stockholm, Sweden (n = 364). Patients who met the revised El Escorial criteria for clinically definite, probable, and possible ALS were included (n = 332) (Citation22). We excluded from the study patients without hs-cTnT in plasma and NfL in CSF measured at the time of diagnosis, leaving in the analysis 150 patients.
We recruited ALS mimics and healthy persons as controls. Individuals with signs of muscle weakness, who were referred to the clinic under initial suspicion of ALS but later diagnosed with other diseases, and had hs-cTnT measured, were recruited as mimics (n = 28; Supplementary Table 1). We reviewed the mimics in September 2020 again, to ensure their diagnosis. We included siblings and partners of ALS patients as healthy controls (n = 108).
We also performed a follow-up study of ALS patients. We followed patients from the date of diagnosis until the date of death or tracheostomy, or 28 February 2020, whichever came first. Among the 150 patients, 110 had at least one more measurement of hs-cTnT and 47 had at least one more measurement of NfL during follow-up (Supplementary Table 2). Thus, we defined a baseline cohort including 150 patients with a measurement at diagnosis and a longitudinal cohort including 110 patients with at least two measurements of hs-cTnT.
ALS patients were categorized as having bulbar or non-bulbar onset. We calculated diagnostic delay as the time interval between symptom onset and diagnosis. Disability was measured using the revised ALS Functional Rating Scale (ALSFRS-R). Disease progression rate was estimated by 48 minus ALSFRS-R score at diagnosis divided by diagnostic delay in months (Citation23).
For ALS patients, CSF and blood were collected at diagnosis and repeatedly thereafter. Samples were collected from mimics during the diagnostic work-up, and from healthy controls shortly after the diagnosis of the index patient. The assessment of hs-cTnT was performed using Roche Diagnostics’ Elecsys 5th generation assay (Rotkreuz, Switzerland). The measurement of NfL was based on UmanDiagnostics’ sandwich enzyme-linked immunoassay (Umeå, Sweden; cat no 10-7001).
We used Kruskal-Wallis nonparametric test to compare differences in the distributions of age and sex, and the Mann–Whitney U test to compare hs-cTnT and NfL levels, between ALS patients and mimics as well as between ALS patients and healthy controls. To evaluate the diagnostic performance of hs-cTnT and NfL in separating ALS patients from mimics and healthy controls, we calculated Area Under the Curve (AUC) values and compared Receiver Operating Characteristic (ROC) curves (Citation24). We compared AUC values by the Chi-square test.
Among ALS patients, we first calculated Spearman’s rank correlation coefficients to measure the correlation between hs-cTnT and NfL. We then used Pearson’s correlation coefficients and linear regression models to assess relationships between hs-cTnT and NfL at diagnosis and disease progression rate, adjusting for age at sampling, sex, site of onset, and diagnostic delay in linear regression. We used the Mann–Whitney U test to assess correlations between hs-cTnT and NfL, and site of onset.
We used the baseline cohort to assess associations between hs-cTnT and NfL at diagnosis and the risk of death after ALS diagnosis. We plotted Kaplan–Meier survival curves for patients with different levels of hs-cTnT and NfL. We used Cox models to estimate hazard ratios (HRs) and their 95% confidence intervals (CIs), with time since symptom onset as the underlying time scale. To assess the prognostic values independent of known prognostic indicators of ALS, we adjusted for sex, site of onset, age at onset, diagnostic delay, body mass index at diagnosis, disease progression rate at diagnosis, and C9orf72 status in the analysis (Citation25,Citation26). hs-cTnT and NfL were mutually adjusted for one another.
We used the longitudinal cohort to present the temporal changes of hs-cTnT and NfL, using a linear regression model with cluster-robust standard errors adjusted for age and sex. We first analyzed all patients together and then according to sex, age at diagnosis (<65 and ≥65 years), onset type, and progression rate.
In all analyses, we considered p < 0.05 as a level of statistical significance. We performed the analyses in Stata software, version 16 (StataCorp, College Station, TX).
Protocol approvals and registrations
This study was approved by the Regional Ethical Review Board in Stockholm, Sweden, and followed the ethical principle as declared by the Declaration of Helsinki.
Results
The characteristics of study participants are summarized in . The ALS patients included in the study are the general representative of the entire population of ALS patients in Stockholm (Supplementary Table 3).
Table 1 Characteristics of ALS patients, ALS mimics and healthy controls, and the number of measurements of hs-cTnT in plasma and NfL in CSF.
The median level of hs-cTnT in plasma was higher in ALS patients at baseline (16.5 ng/L) than in mimics (11 ng/L, p < 0.001) and healthy controls (6 ng/L, p < 0.001) ( and Supplementary Table 4). 82 ALS patients (54.7%), six mimics (21.4%) and 12 healthy controls (11.1%) had hs-cTnT above the 99th percentile (Citation1). ALS patients also had higher levels of NfL in CSF than controls.
Figure 1 Boxplot on levels of (A) hs-cTnT in plasma, and (B) NfL in CSF, among ALS patients at baseline, ALS mimics, and healthy controls. All on a base 10 logarithmic scale. p Values were calculated using Mann–Whitney U test.
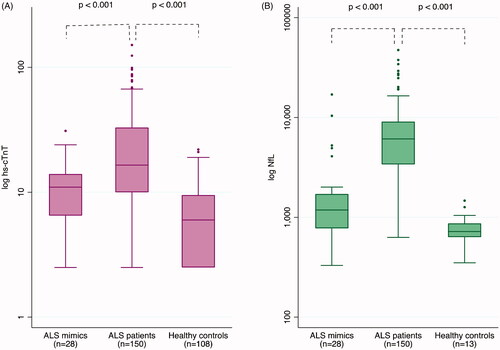
Higher AUC was noted for NfL (p = 0.02) than cTnT in separating ALS patients from mimics (). Adding hs-cTnT to NfL did not increase the AUC (p = 0.47). The result was similar when comparing ALS patients to healthy controls. ROC curves are shown in Supplementary Figure 1. hs-cTnT did not correlate with NfL at baseline, in ALS patients (Spearman’s rho −0.04; p = 0.76). There was a correlation between disease progression rate and hs-cTnT (Pearson’s r = 0.18, p = 0.04; multivariable regression p = 0.05) and NfL (Pearson’s r = 0.41, p < 0.001; multivariable regression p = 0.001). The median level of hs-cTnT was lower among ALS patients with bulbar onset (13 ng/L) than patients with non-bulbar onset (20 ng/L) (p = 0.003). There was no difference in the levels of NfL by type of onset.
Table 2 Area under the curve (AUC) values with 95% CI for hs-cTnT in plasma, NfL in CSF, and combined, in separating ALS patients from ALS mimics and healthy controls.
We included in the survival analysis of the baseline cohort 125 ALS patients with baseline measures of hs-cTnT and NfL and all other prognostic factors (n = 93 including also C9orf72 status; Supplementary Table 5). Supplementary Figure 2 depicts the Kaplan–Meier survival curves. After multivariable adjustment, a 1000-unit increase in NfL was associated with a higher risk of death (HR 1.08, 95% CI 1.04–1.11) (). The result was similar after further controlling for C9orf72 status. Although increasing levels of hs-cTnT were suggested to be associated with a higher risk of death, the results were not statistically significant.
Table 3 Multivariable Cox proportional hazards regression models for hs-cTnT in plasma and NfL in CSF among ALS patients with and without adjustment for C9orf72 repeat expansion.
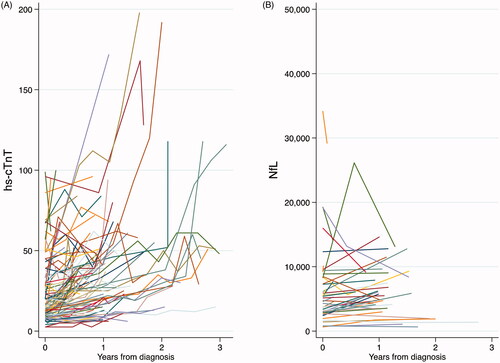
In the longitudinal cohort, after controlling for age and sex, hs-cTnT increased (12.61 ng/L per year, 95% CI 7.14–18.06; corresponding to 68.7%increase per year) whereas NfL decreased (−1709 ng/L per year, 95% CI −1851 to −113; corresponding to 22.4% decrease per year) over time since diagnosis (Supplementary Table 6). The increasing hs-cTnT level was noted among all patients regardless of sex, age, type of onset, or progression rate. NfL decreased over time among patients younger than 65 years, patients with non-bulbar onset, and patients with the fastest progression rate. displays the temporal pattern of hs-cTnT and NfL for each ALS patient from diagnosis.
Figure 2 Temporal changes of (A) hs-cTnT in plasma (n = 115), and (B) NfL in CSF (n = 47), after ALS diagnosis.
Discussion
In a case-control study of ALS supplemented with a longitudinal follow-up of the ALS patients, we found evidence of elevated hs-cTnT in ALS patients compared to mimics and healthy controls. We also demonstrated longitudinally increasing hs-cTnT levels in ALS patients after diagnosis, regardless of patient characteristics.
Previous studies have provided conflicting results on hs-cTnT levels in ALS patients compared to controls. Studies with negative findings did not directly study cTnT (Citation11,Citation12), whereas studies with positive findings, like our study, directly studied cTnT (Citation9,Citation10). We confirmed earlier studies in demonstrating elevated levels of NfL in CSF among ALS patients compared with mimics and healthy controls (Citation14–16,Citation18–21). In the analysis of diagnostic performance, hs-cTnT performed moderately well in distinguishing mimics from ALS patients. NfL, however, performed better, at a level similar to previous reports (Citation15,Citation16,Citation18,Citation20,Citation21).
Elevated levels of hs-cTnT were found to correlate with faster disease progression, although weakly. Non-bulbar onset ALS patients had higher hs-cTnT levels compared to bulbar onset patients. Consistent with previous studies, NfL was found to correlate with a faster disease progression rate and was associated with a higher risk of death (Citation15,Citation16,Citation18,Citation20,Citation21). No association was noted between the level of hs-cTnT and risk of death, however.
In our longitudinal analysis of ALS patients, hs-cTnT was found to increase over time. A similar pattern was noted by Mach et al., showing that ALS patients with elevated cTnT had a longer disease duration at sampling compared to those with normal cTnT levels (Citation9). NfL slowly decreased over time, in contrast to prior studies that showed NfL to increase in early disease stages (Citation16,Citation27–29) and become stable thereafter (Citation16,Citation27,Citation29–32). The contrasting temporal patterns of hs-cTnT and NfL indicate a potential use of hs-cTnT as an easily accessible and affordable disease progression biomarker in clinical trials. The increasing levels over time in all subgroups of ALS patients also demonstrate its potential use.
The strengths of our study include the large sample size, the rich information on clinical characteristics, and the complete follow-up. It is to our knowledge the first study to examine the correlations between cTnT and NfL as well as clinical characteristics in ALS. There are some limitations. First, this study did not investigate the sources or pathophysiological mechanisms of the elevated and increasing levels of hs-cTnT in ALS patients. Myocardial injury (Citation1) and defects (Citation11), sympathetic dysfunction (Citation33–36), cardiomyopathy (Citation37,Citation38), and chronic myocardia hypoxia due to respiratory failure in ALS (Citation39), etc. might all contribute. In the present study, we had a measure of creatine kinase (CK) for 45 patients with ALS and found a moderate correlation between CK and hs-cTnT (Spearman’s rho = 0.42; data not shown). Future studies should therefore examine the correlation between hs-cTnT and disease stage or number of body regions with involvement of upper or lower motor neurons, to better understand if hs-cTnT reflects central or peripheral damage. This applies to patients with ALS but also ALS mimics. Another limitation is the heterogeneous group of mimics.
In summary, we provide evidence that hs-cTnT in plasma is elevated in ALS patients compared to ALS mimics and healthy controls. However, NfL in CSF performs better than hs-cTnT, both as a diagnostic and prognostic biomarker. In contrast to NfL, hs-cTnT increases longitudinally as the disease progresses and might constitute a potential disease progression biomarker.
Declaration of interest
Ulf Kläppe reports no disclosures.
Sanharib Chamoun reports no disclosures.
Qing Shen reports no disclosures.
Anja Finn reports no disclosures.
Björn Evertsson reports no disclosures.
Henrik Zetterberg has served at scientific advisory boards for Denali, Roche Diagnostics, Wave, Samumed, Siemens Healthineers, Pinteon Therapeutics and CogRx, has given lectures in symposia sponsored by Fujirebio, Alzecure and Biogen, and is a co-founder of Brain Biomarker Solutions in Gothenburg AB (BBS), which is a part of the GU Ventures Incubator Program; all outside the submitted work.
Kaj Blennow has served as a consultant, at advisory boards, or at data monitoring committees for Abcam, Axon, Biogen, JOMDD/Shimadzu. Julius Clinical, Lilly, MagQu, Novartis, Roche Diagnostics, and Siemens Healthineers, and is a co-founder of Brain Biomarker Solutions in Gothenburg AB (BBS), which is a part of the GU Ventures Incubator Program; all outside the submitted work.
Rayomand Press has received grants from Pfizer and CSL Behring; all outside the submitted work.
Kristin Samuelsson has served as a member at scientific advisory boards for Alnylam Pharmaceuticals and Akcea Therapeutics; all outside the submitted work.
Anna Månberg reports no disclosures.
Fang Fang reports no disclosures.
Caroline Ingre serves as a member of the ALS Advisory Board EU for Biogen, a member of the Publication Steering Committee for Cytokinetics, a board member of the data monitoring committee of APL-ALS 206 for Apellis Pharmaceutical, a board member of the Stiching TRICALS Foundation and has received grants from Pfizer; all outside the submitted work.
Supplemental Material
Download MS Word (189.7 KB)Acknowledgments
We are grateful to all patients and their families for their contributions to this research project.
Data availability statement
Anonymized data will be made available upon reasonable requests to the corresponding author. The data are not publicly available due to privacy or ethical restrictions.
Additional information
Funding
Related Research Data
References
- Thygesen K, Alpert JS, Jaffe AS, Chaitman BR, Bax JJ, Morrow DA, et al. Fourth universal definition of myocardial infarction (2018). Eur Heart J. 2019;40:237–69.
- Messner B, Baum H, Fischer P, Quasthoff S, Neumeier D. Expression of messenger RNA of the cardiac isoforms of troponin T and I in myopathic skeletal muscle. Am J Clin Pathol. 2000;114:544–9.
- Lindberg C, Klintberg L, Oldfors A. Raised troponin T in inclusion body myositis is common and serum levels are persistent over time. Neuromuscul Disord. 2006;16:495–7.
- Aggarwal R, Lebiedz-Odrobina D, Sinha A, Manadan A, Case JP. Serum cardiac troponin T, but not troponin I, is elevated in idiopathic inflammatory myopathies. J Rheumatol. 2009;36:2711–4.
- Cox FM, Delgado V, Verschuuren JJ, Ballieux BE, Bax JJ, Wintzen AR, et al. The heart in sporadic inclusion body myositis: a study in 51 patients. J Neurol. 2010;257:447–51.
- Rittoo D, Jones A, Lecky B, Neithercut D. Elevation of cardiac troponin T, but not cardiac troponin I, in patients with neuromuscular diseases: implications for the diagnosis of myocardial infarction. J Am Coll Cardiol. 2014;63:2411–20.
- Wens SC, Schaaf GJ, Michels M, Kruijshaar ME, van Gestel TJ, In ‘t Groen S, et al. Elevated plasma cardiac troponin T levels caused by skeletal muscle damage in Pompe disease. Circ Cardiovasc Genet. 2016;9:6–13.
- Schmid J, Liesinger L, Birner-Gruenberger R, Stojakovic T, Scharnagl H, Dieplinger B, et al. Elevated cardiac troponin T in patients with skeletal myopathies. J Am Coll Cardiol. 2018;71:1540–9.
- Mach L, Konecny T, Helanova K, Jaffe AS, Sorenson EJ, Somers VK, et al. Elevation of cardiac troponin T in patients with amyotrophic lateral sclerosis. Acta Neurol Belg. 2016;116:557–64.
- Casmiro M, Graziani A. Serum troponin T in patients with amyotrophic lateral sclerosis. Acta Neurol Belg. 2019;119:285–8.
- Rosenbohm A, Schmid B, Buckert D, Rottbauer W, Kassubek J, Ludolph AC, et al. Cardiac findings in amyotrophic lateral sclerosis: a magnetic resonance imaging study. Front Neurol. 2017;8:479.
- Guo H, Lu M, Ma Y, Liu X. Myoglobin: a new biomarker for spinal and bulbar muscular atrophy? Int J Neurosci. 2020;1–6. doi: https://doi.org/10.1080/00207454.2020.1796660. Epub ahead of print.
- Rosengren LE, Karlsson JE, Karlsson JO, Persson LI, Wikkelsø C. Patients with amyotrophic lateral sclerosis and other neurodegenerative diseases have increased levels of neurofilament protein in CSF. J Neurochem. 2002;67:2013–8.
- Xu Z, Henderson RD, David M, McCombe PA. Neurofilaments as biomarkers for amyotrophic lateral sclerosis: a systematic review and meta-analysis. PLoS One. 2016;11:e0164625.
- Steinacker P, Feneberg E, Weishaupt J, Brettschneider J, Tumani H, Andersen PM, et al. Neurofilaments in the diagnosis of motoneuron diseases: a prospective study on 455 patients. J Neurol Neurosurg Psychiatry. 2016;87:12–20.
- Poesen K, De Schaepdryver M, Stubendorff B, Gille B, Muckova P, Wendler S, et al. Neurofilament markers for ALS correlate with extent of upper and lower motor neuron disease. Neurology. 2017;88:2302–9.
- Feneberg E, Oeckl P, Steinacker P, Verde F, Barro C, Van Damme P, et al. Multicenter evaluation of neurofilaments in early symptom onset amyotrophic lateral sclerosis. Neurology. 2018;90:e22–e30.
- Rossi D, Volanti P, Brambilla L, Colletti T, Spataro R, La Bella V. CSF neurofilament proteins as diagnostic and prognostic biomarkers for amyotrophic lateral sclerosis. J Neurol. 2018;265:510–21.
- Forgrave LM, Ma M, Best JR, DeMarco ML. The diagnostic performance of neurofilament light chain in CSF and blood for Alzheimer’s disease, frontotemporal dementia, and amyotrophic lateral sclerosis: a systematic review and meta-analysis. Alzheimers Dement. 2019;11:730–43.
- Abu-Rumeileh S, Vacchiano V, Zenesini C, Polischi B, de Pasqua S, Fileccia E, et al. Diagnostic-prognostic value and electrophysiological correlates of CSF biomarkers of neurodegeneration and neuroinflammation in amyotrophic lateral sclerosis. J Neurol. 2020;267:1699–708.
- Steinacker P, Feneberg E, Halbgebauer S, Witzel S, Verde F, Oeckl P, et al. Chitotriosidase as biomarker for early stage amyotrophic lateral sclerosis: a multicenter study. Amyotroph Lateral Scler Frontotemporal Degener. 2021;22:1–11.
- Brooks BR, Miller RG, Swash M, Munsat TL. El Escorial revisited: revised criteria for the diagnosis of amyotrophic lateral sclerosis. Amyotroph Lateral Scler Other Motor Neuron Disord. 2000;1:293–9.
- Labra J, Menon P, Byth K, Morrison S, Vucic S. Rate of disease progression: a prognostic biomarker in ALS. J Neurol Neurosurg Psychiatry. 2016;87:628–32.
- Cleves M. From the help desk: comparing areas under receiver operating characteristic curves from two or more probit or logit models. The Stata J. 2002;2:301–13.
- Westeneng HJ, Debray TPA, Visser AE, van Eijk RPA, Rooney JPK, Calvo A, et al. Prognosis for patients with amyotrophic lateral sclerosis: development and validation of a personalised prediction model. Lancet Neurol. 2018;17:423–33.
- Longinetti E, Fang F. Epidemiology of amyotrophic lateral sclerosis: an update of recent literature. Curr Opin Neurol. 2019;32:771–6.
- Benatar M, Wuu J, Andersen PM, Lombardi V, Malaspina A. Neurofilament light: a candidate biomarker of presymptomatic amyotrophic lateral sclerosis and phenoconversion. Ann Neurol. 2018;84:130–9.
- Benatar M, Wuu J, Lombardi V, Jeromin A, Bowser R, Andersen PM, et al. Neurofilaments in pre-symptomatic ALS and the impact of genotype. Amyotroph Lateral Scler Frontotemporal Degener. 2019;20:538–48.
- Gille B, De Schaepdryver M, Goossens J, Dedeene L, De Vocht J, Oldoni E, et al. Serum neurofilament light chain levels as a marker of upper motor neuron degeneration in patients with amyotrophic lateral sclerosis. Neuropathol Appl Neurobiol. 2019;45:291–304.
- Lu CH, Macdonald-Wallis C, Gray E, Pearce N, Petzold A, Norgren N, et al. Neurofilament light chain: a prognostic biomarker in amyotrophic lateral sclerosis. Neurology. 2015;84:2247–57.
- Benatar M, Zhang L, Wang L, Granit V, Statland J, Barohn R, et al. Validation of serum neurofilaments as prognostic and potential pharmacodynamic biomarkers for ALS. Neurology. 2020;95:e59–e69.
- Huang F, Zhu Y, Hsiao-Nakamoto J, Tang X, Dugas JC, Moscovitch-Lopatin M, et al. Longitudinal biomarkers in amyotrophic lateral sclerosis. Ann Clin Transl Neurol. 2020;7:1103–16.
- Asai H, Hirano M, Udaka F, Shimada K, Oda M, Kubori T, et al. Sympathetic disturbances increase risk of sudden cardiac arrest in sporadic ALS. J Neurol Sci. 2007;254:78–83.
- Pavlovic S, Stevic Z, Milovanovic B, Milicic B, Rakocevic-Stojanovic V, Lavrnic D, et al. Impairment of cardiac autonomic control in patients with amyotrophic lateral sclerosis. Amyotroph Lateral Scler. 2010;11:272–6.
- Pinto S, Pinto A, De Carvalho M. Decreased heart rate variability predicts death in amyotrophic lateral sclerosis. Muscle Nerve. 2012;46:341–5.
- Tanaka Y, Yamada M, Koumura A, Sakurai T, Hayashi Y, Kimura A, et al. Cardiac sympathetic function in the patients with amyotrophic lateral sclerosis: analysis using cardiac [123I] MIBG scintigraphy. J Neurol. 2013;260:2380–6.
- Gdynia HJ, Kurt A, Endruhn S, Ludolph AC, Sperfeld AD. Cardiomyopathy in motor neuron diseases. J Neurol Neurosurg Psychiatry. 2006;77:671–3.
- Choi SJ, Hong YH, Shin JY, Yoon BN, Sohn SY, Park CS, et al. Takotsubo cardiomyopathy in amyotrophic lateral sclerosis. J Neurol Sci. 2017;375:289–93.
- Lueder V, Melsom TG, Atar MN, Agewall D. S. Amyotrophic lateral sclerosis (ALS), a novel rare cause of elevated plasma troponin T levels. Clin Lab. 2011;57:615–8.