
Abstract
Objective: Amyotrophic lateral sclerosis (ALS) is a clinically heterogenous disease, typically presenting with focal motor weakness that eventually generalizes. Weather there is a correlation between focal motor weakness and metabolic alterations in specific areas of the brain has not been thoroughly explored. This study aims to systematically investigate this by using fluorodeoxyglucose-positron emission tomography (FDG-PET), including longitudinal imaging. Methods: This observational imaging study included 131 ALS patients diagnosed and examined with FDG-PET at the ALS Clinical Research Center at the Karolinska University Hospital in Stockholm, Sweden. Thirteen ALS patients had a second scan and were analyzed longitudinally. The findings were compared to 39 healthy controls examined at the University Medical Center of Gröningen, the Netherlands. Results: There was a general pattern of brain metabolic alterations consistent with previously reported findings in ALS, namely hypometabolism in frontal regions and hypermetabolism in posterior regions. A higher symptom burden was associated with increased hypometabolism and decreased hypermetabolism. However, there was no clear correlation between focal motor weakness and specific metabolic alterations, neither when analyzing focal motor weakness with concomitant upper motor neuron signs or when including all focal motor weakness. Longitudinal FDG-PET imaging showed inconsistent results with little correlation between progression of motor weakness and metabolic alterations. Conclusion: Our results support the disease model of ALS as a diffuse process since no clear correlation was seen between focal motor weakness and specific metabolic alterations. However, there is need for further research on a larger number of patients, particularly including longitudinal imaging.
Introduction
Amyotrophic lateral sclerosis (ALS) is a clinically heterogenous disease, typically presenting with extremity weakness or difficulty with speaking and swallowing, and rapidly generalizes to widespread motor dysfunction resulting in death within two to four years after symptom onset (Citation1,Citation2). In addition, almost 50% of patients develop cognitive impairment and up to 15% meet the criteria for frontotemporal dementia (Citation3). A unique feature of ALS is the simultaneous involvement of upper (cortical) motor neurons (UMN) and lower (spinal/brainstem) motor neurons (LMN). The diagnosis primarily relies on the clinical examination and neurophysiological studies. While imaging currently has an ancillary role in ALS diagnosis, various imaging modalities reveal structural and functional alterations in patients with ALS. For instance, MRI shows widespread white and grey matter involvement that progresses over time, including the motor, sensory, and premotor cortices as well as the thalamus and midbrain (Citation4–6). Moreover, functional imaging such as fMRI and EEG reveal alterations in multiple network systems, predominantly an increased functional connectivity, correlating with the structural changes observed on MRI (Citation7–9). Fluorodeoxyglucose-positron emission tomography (FDG-PET) offers a way of assessing alterations in brain metabolic activity, potentially as a measure of disease spread and severity. A characteristic pattern in ALS FDG-PET has emerged, including hypometabolism in the primary motor and premotor cortices as well as other areas of the frontal and parietal lobes whereas there is hypermetabolism in the occipital cortex, cerebellum, parts of the temporal cortex, and brainstem (Citation10–13). Using FDG-PET to distinguish ALS patients from controls has shown high accuracy (Citation13). However, while a characteristic metabolic signature might support a diagnosis of ALS, it is currently not recommended as a routine investigation (Citation14). The method needs to be better characterized in ALS before widespread clinical application. Most existing studies are small, with only a handful including more than 50 patients, and few studies have collected longitudinal data (Citation15). Also, the correlation of brain metabolic alterations with clinical symptoms and disease spread, including laterality, is not well described. This paper aims to explore metabolic alterations seen on FDG-PET imaging in relation to focal motor weakness in 131 ALS patients, including longitudinal imaging.
Methods
Study population
This observational imaging study included 131 patients diagnosed with ALS between 2008 and 2021 (10 patients before 2017) at the ALS Clinical Research Center (ALS CRC) at the Karolinska University Hospital in Stockholm, Sweden. The ALS CRC provides multidisciplinary ALS care and is the only tertiary center for ALS patients in the Stockholm region with a population of approximately 2 million inhabitants. The findings in the ALS patients were compared to 39 healthy controls recruited among spouses and friends of movement disorder patients as part of several studies at the University Medical Center of Gröningen, the Netherlands (Citation16–18). To assess representativeness, we compared the 131 patients of the present study to a larger cohort of 353 ALS patients diagnosed between 2016 and 2021 in Stockholm (Citation19), who were deemed as representative of all ALS patients in the source population (Supplementary Table 1).
Data
Clinical variables
Clinical data on the ALS patients were obtained from medical record review and complementary information was collected from the Swedish Motor Neuron Disease Quality Registry (SMNDR) (Citation20). There was complete information on all variables except for ALSFRS-R where there were missing data in 14 patients.
FDG-PET imaging and processing
In the patient cohort, FDG-PET imaging was performed within 2 months after diagnosis for 124 of the patients (after a median of 19 days [interquartile range (IQR 24)] for the whole cohort). Thirteen patients had a second scan a median of 572 (IQR 461) days after the first scan. FDG-PET imaging was acquired using a Siemens Biograph 128mCT (Siemens Healthcare Molecular Imaging USA, Inc.). Image acquisition was 10 min, 30–45 min after an intravenous injection of 2 MBq/kg weight (min 125MBq, max 250MBq) of 18F-FDG. For the healthy controls, Static FDG-PET scanning was performed on a Siemens Biograph mCT-64 PET/CT camera (Siemens, Munich, Germany) in a three-dimensional mode, 30 min after intravenous injection of 200 MBq of 18F-FDG. Both sets of PET images were reconstructed using an iterative method with 3 iterations and 21 subsets matrix 256 and smoothed with a Gaussian 8 mm full-width at half-maximum filter. Time of flight and point spread function correction was applied. The voxel size of the reconstructed images was 3.2 × 3.2 × 2.0 mm. Statistical Parametric Mapping (SPM) 12 implemented in Matlab R2018b (MathWorks, Natick, MA, USA) was used for image normalization. A customized brain [18F]FDG -PET template was utilized for spatial normalization (Citation21). Intensity normalization was performed using the 0.8 default SPM value of grey matter threshold, and images were smoothed with a 10 mm filter before submission for statistical analysis. Phantom measurements with a NEMA phantom were done to compare the two systems used in the two sites. The phantom was filled with approximately 30 MBq of [18F]FDG with a ratio of ten between the hot spheres and the background. PET data was acquired for 10 min. Prior to the PET-acquisition a CT was acquired to be used for attenuation correction. Phantom images were reconstructed using an iterative method with 3 iterations and 21 subsets matrix 256 and smoothed with a Gaussian 8 mm full-width at half-maximum filter. Attenuation correction, scatter correction, ToF and point spread function correction were applied. Preliminary unpublished results have shown that the deviation of contrast recovery between the two systems is minimal, allowing for a reliable comparison between the two datasets.
Measures and definitions
Motor symptom burden
The severity of motor symptoms (weakness) was documented in five separate areas: right upper extremity, left upper extremity, right lower extremity, left lower extremity, and in the bulbar area, using the following scoring system:
0. No symptoms.
1. Findings on clinical examination (e.g. hyperreflexia) but no effect on function.
2. Slight effect on function (e.g. slight foot drop).
3. Severe effect on function (e.g. considerable walking impairment).
4. Complete paralysis.
A total motor symptom severity score was calculated by adding the individual scores for all five areas (min 0, max 20).
A high motor symptom burden was defined as either of: (1) three areas with a motor symptom severity score of two, (2) one area with a score of three and one area with a score of two, or (3) one area with a score of four.
This scoring system was used instead of the more common ALSFRS-R because of the need to semi-quantitatively (on an ordinal scale) rate the grade of weakness in each extremity.
Clinical signs of upper motor dysfunction
UMN signs were defined as spasticity, hyperreflexia (in relation to weakness), a plantar extensor response, or a positive Hoffmann reflex. Since UMN signs are particularly difficult to appreciate in the bulbar region, this area was not included in the analyses that relied on the distinction between UMN and LMN dysfunction.
Statistical analysis
Analyses of patient characteristics
Categorical variables were summarized as proportions (percent) and bivariate analyses were performed using the χ2 test to assess for statistical significance of differences between groups. Continuous variables (e.g. age) were reported as median (IQR), except for the healthy controls where only compound data on mean age were available. The two-sample t-test (two-tailed) was used to assess for significance of differences between groups. The statistical significance level was set to p < 0.05.
Analyses of FDG-PET data
For the assessment of the general pattern of metabolic alterations as well as longitudinal evolution, we compared the findings on FDG-PET imaging in the ALS patient cohort to the healthy controls, after adjustment for age and sex. Also, we compared the findings directly in ALS patients with low versus high motor symptom burden. To provide a semi-quantitative measurement, we identified an area in the bilateral motor cortex with hypometabolism associated with increasing total motor symptom severity score. The relative metabolic activity, adjusted for sex and age, was normalized to that of the whole brain, yielding a relative score. Linear regression analysis was then performed using this score as dependent variable and total motor symptom severity score as independent variable.
To assess for correlation between focal motor weakness and specific brain metabolic alterations, regression analyses were performed using the FDG-PET findings as dependent variable, the focal motor symptom severity scores as independent variable, and age, sex, and the total motor symptom severity score as covariates. For each area, separate analyses were conducted (1) including motor weakness irrespective of the presence of UMN signs and (2) only including motor weakness where there was concomitant UMN signs. The bulbar region was only analyzed for motor weakness irrespective of the presence of UMN signs due to difficulty of reliably appreciating these signs on clinical examination in this region. Also, regression analyses were performed to assess for metabolic alterations associated specifically with UMN dysfunction. The number of limbs with motor weakness and concomitant UMN signs were used as the independent variable, while age, sex, and the total number of limbs with motor weakness were used as covariates. All imaging results were corrected for multiple comparisons using family-wise error (FWE) rate correction at the cluster level (p < 0.05). When such strict statistical level was not reached, we used a more liberal uncorrected threshold p < 0.001, which nevertheless protects from false positives in phantom simulations (Citation22). Only cluster exceeding 125 voxels were acceptable.
Ethical review board approval
The study of the ALS patient cohort was approved by the Regional Ethical Review Board in Stockholm, Sweden (DNRs 2014/1815-31/4 and 2017/1895-31/1). Written informed consent was obtained from all patients. For the healthy controls, approval was obtained in the separate studies where the individuals were recruited (Citation16–18).
Results
Patient characteristics
Patients with a low (n = 66 [50.4%]) and high (n = 65 [49.6%]) motor symptom burden were presented separately (). Overall, there was a slight predominance of male patients (55.3%) in the ALS patient cohort and a median age at the first FDG-PET scan of 63 years. These characteristics did not differ significantly between patients with a low versus high motor symptom burden. In total, approximately a third of the patients first presented with upper extremity, lower extremity, or bulbar symptoms, respectively. There was a lower proportion of bulbar-onset patients among the patients with a high motor symptom burden (13.8%), compared to patients with a low motor symptom burden (48.5%). The healthy controls were slightly younger (mean age of 58 years) but had a similar sex distribution (53.8% male patients) to the ALS cohort. Among the 13 patients with a second scan, there was similar age and sex distribution as compared to the study cohort as a whole: 46.2% versus 55.3% male patients and a median age of 58 versus 63 years (). A comparison between the study cohort and a larger cohort of ALS patients to assess for representativeness showed that patients in the present study were younger (median age 63 years versus 68) and had a higher proportion of limb onset (68.7% versus 57.2%) (Supplementary Table 2).
Table 1 Patient characteristics, shown separately for those with a low versus high motor symptom burden.
Table 2 Characteristics of 13 ALS patients with longitudinal FDG-PET imaging.
Distribution of motor symptoms
The median total motor symptom severity score at the time of the first FDG-PET scan was 6 (IQR 5) for the ALS cohort as a whole; 9 (IQR 4) for those with a high motor symptom burden and 4 (IQR 2) for those with a low motor symptom burden (). The distribution of motor symptom severity was similar across different affected areas: approximately half of the patients had no effect on function (a score of 0–1), one third had mild functional impairment (a score of 2), and the rest had more severe involvement (a score of 3–4) (Supplementary Table 1). The ALSFRS-R at the first scan was significantly lower in the high symptom burden group with a median of 35 versus 43 in the low motor symptom burden group ().
General pattern of metabolic alterations on FDG-PET imaging in ALS
In ALS patients, there was a common pattern of hypometabolism in the frontal lobe and hypermetabolism in the posterior regions, including the occipital lobe and cerebellum, compared with healthy controls, after adjustment for age and sex (, ). Patients with a high motor symptom burden demonstrated less hypermetabolism while there was more widespread hypometabolism, including involvement of the cingulate cortex and lentiform nuclei, compared with patients with a low motor symptom burden. A direct comparison of these groups revealed areas of significant hypometabolism in the insula and lingual gyrus on the left side specific for the high symptom burden group. To provide a semi-quantitative measurement, we identified an area of hypometabolism in the bilateral motor cortex (Brodmann area 6) where the degree of hypometabolism was strongly associated with an increasing total motor symptom severity score. Linear regression analysis adjusted for age and sex yielded a standardized beta coefficient of −0.303 and a p value of <0.001. No association was detected specifically between brain metabolic alterations and clinical signs of UMN dysfunction.
Figure 1 (A–B) General pattern of brain metabolic alterations on FDG-PET imaging in ALS. Distribution of brain metabolic alterations in 66 ALS patients with a low motor symptom burden (A) and 65 ALS patients with a high motor symptom burden (B), compared to a cohort of 39 healthy controls. Blue indicates areas of relative hypometabolism, and orange indicates areas of relative hypermetabolism (difference only appreciable in color version). FDG-PET: fluorodeoxyglucose-positron emission tomography; L: left; R: right.
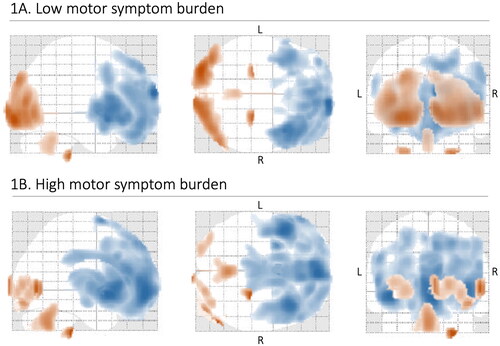
Table 3 Brain anatomical areas with significant metabolic alterations on FDG-PET imaging in 131 patients with ALS compared to healthy controls, shown separately for those with a low versus high motor symptom burden.
Right
Metabolic alterations on FDG-PET imaging in relation to focal motor weakness
We only found significant correlations between brain metabolic alterations and motor weakness in the bulbar region (irrespective of the presence of UMN signs) and in the right lower extremity (when only including weakness with concomitant UMN signs) (, ). For the bulbar region, the metabolic alterations were widespread, primarily including areas of relative hypometabolism in the lateral posterior frontal lobe bilaterally, whereas for the right lower extremity there was relative hypermetabolism in the right temporal lobe.
Figure 2 (A–B) Brain metabolic alterations on FDG-PET imaging in relation to focal weakness in ALS. Including focal weakness with and without upper motor neuron (UMN) signs (A) and only including focal weakness with concomitant UMN signs (B). Blue indicates areas of relative hypometabolism, and orange indicates relative hypermetabolism (difference only appreciable in color version). Regions that were not associated with specific alterations are shown to the left in both A and B and the regions that were associated with specific alterations (bulbar and right lower extremity, respectively) are shown to the right. The bulbar region was not included in B since UMN signs in this area are difficult to appreciate on clinical examination. FDG-PET: fluorodeoxyglucose-positron emission tomography; L: left; R: right.
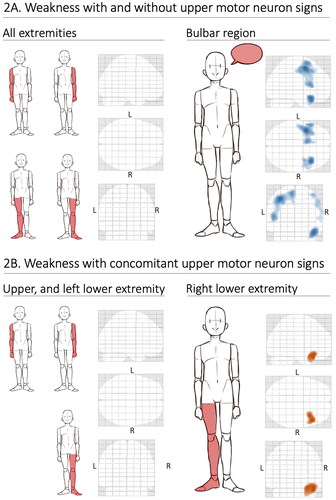
Table 4 Brain anatomical areas with significant metabolic alterations on FDG-PET imaging in relation to focal motor weakness in 131 patients with ALS.
Metabolic alterations on longitudinal FDG-PET imaging in relation to progression of motor weakness
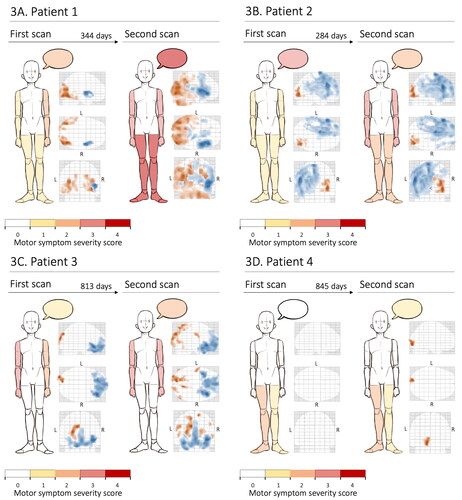
The first and second scan of 13 patients were compared to that of the 39 healthy controls, adjusted for age and sex. In five patients there were no significant brain metabolic alterations compared to the healthy controls neither at the first nor the second scan, and one patient showed very inconsistent results. In the remaining seven patients, there was great variation in findings of metabolic alterations between individuals, e.g. clear clinical and radiological progression (), radiological progression but little clinical progression (), clinical progression but little radiological progression (), and little progress clinically as well as on imaging (). Overall, there was no clear correlation between progress of motor symptoms and changes of metabolic alterations.
Figure 3 (A–D) Examples of brain metabolic alterations on longitudinal FDG-PET imaging in four patients with ALS. Compared to a cohort of 39 healthy controls. The findings are shown in relation to the severity of motor weakness, indicated by a color scheme, in several areas: right upper extremity, left upper extremity, right lower extremity, left lower extremity, and the bulbar region (represented by a speech bubble). In the FDG-PET imaging illustrations, blue indicates areas of relative hypometabolism whereas orange indicates relative hypermetabolism (difference only appreciable in color version). FDG-PET: fluorodeoxyglucose-positron emission tomography; L: left; R: right.
Discussion
The general pattern of brain metabolic alterations on FDG-PET observed in this study is consistent with previously reported findings in ALS, namely hypometabolism in frontal regions and hypermetabolism in posterior regions. An increased motor symptom burden was associated with increased hypometabolism and decreased hypermetabolism.
Motor symptoms in ALS typically present as asymmetric, focal weakness and intuitively, one might attribute this to a localized, contralateral lesion, akin to other neurologic conditions such as ischemic stroke. However, although previously thought of as an almost exclusively motor disease (Citation23), we now know that ALS is a diffuse degenerative process affecting multiple CNS network systems, which has been demonstrated on various imaging modalities (structural and functional MRI, EEG, and PET) (Citation4–13). Although the direct corticospinal projections almost exclusively originate in the primary motor and caudal premotor areas, the frontal motor cortex has extensive connections to most brain regions, primarily the parietal cortex, the prefrontal lobe, and cingulate cortex (Citation24). Disruption of these network systems at some level might be expected to manifest as motor weakness. Nevertheless, motor neuron degeneration is central in the pathogenesis of ALS and there is a clinicopathological correlation between specific parts of the motor system and motor symptoms in the corresponding limbs (Citation25). Thus, one might also expect metabolic alterations to correspond to the focal clinical manifestations of the disease. However, this could not be proven in our study. Despite a distinct metabolic profile in ALS patients compared to healthy controls, we found no clear correlation between a specific pattern of brain metabolic alterations and focal motor weakness, except for bulbar motor symptoms which were associated with an increased hypometabolism in the frontal region bilaterally. Interestingly, using longitudinal imaging data, we found no clear correlation between changes in metabolic alterations and progression of motor symptoms, corroborating findings reported previously in smaller studies (Citation15).
There might be several explanations for our results. For instance, the pathological process might already be diffusely spread throughout the brain, affecting several network systems, and effectively masking additional metabolic alterations. Also, FDG-PET imaging might simply not be sensitive enough to detect localized metabolic alterations compromising critical structures for motor control. Furthermore, although the number of patients in our study was relatively high for a rare disease like ALS, there may still be a lack of statistical power to detect real difference.
The characterization of UMN versus LMN involvement is vital to understanding and diagnosing ALS. It is currently unclear whether the disease starts at the LMN or UMN level but has been demonstrated to spread along neuroanatomical structures (Citation25). Since FDG-PET is a measure of UMN dysfunction, the distinction between symptoms resulting from UMN or LMN involvement is important. We conducted specific analyses aimed at exploring if brain metabolic alterations were more pronounced in patients with clinical signs of UMN dysfunction, without detecting significant differences. However, there is currently no reliable and widely used method to selectively assess UMN integrity. In the present study, we used the clinical examination to identify UMN dysfunction, which can be unreliable. The clinical appreciation of UMN signs is dependent on the skills of the examiner, they might be masked by profound lower motor dysfunction, they are more difficult to appreciate in the bulbar region, and although present, might have been inconsistently documented. Therefore, we excluded the bulbar region from analyses dependent on the distinction between UMN and LMN dysfunction.
A comparison with a larger cohort of ALS patients suggested that our study cohort may not be representative of the entire ALS population in Stockholm. Nevertheless, this is, to the best of our knowledge, the first FDG-PET study to systematically investigate the correlation between focal motor weakness and brain metabolic alterations in ALS and the largest to include longitudinal imaging. However, for PET to emerge as a reliable clinical tool, it needs to be studied in a larger number of patients, with longitudinal imaging of particular importance.
Conclusion
Our cohort of 131 ALS patients showed hypometabolism in frontal regions and hypermetabolism in posterior regions. A higher motor symptom burden was associated with increased hypometabolism and decreased hypermetabolism. There was little correlation between focal motor weakness and specific brain metabolic alterations and little correlation between progression of motor weakness and longitudinal changes of metabolic alterations. The study supports the model of ALS as a diffuse disease and suggests that FDG-PET might be effective as an assessment of global brain metabolic patterns in ALS but may be insensitive to more subtle and localized alterations. However, there is need for further research on a larger number of patients, particularly including longitudinal imaging.
Supplemental Material
Download PDF (122.4 KB)Acknowledgements
We are grateful for the generosity of Dr. Sanne K Meles, Dr Fransje Reesink, and Professor Klaus L. Leenders, (Department of Neurology and Nuclear Medicine at the University of Groningen, University Medical Center of Gröningen, Groningen (UMCG), The Netherlands) for sharing FDG-PET data in 39 healthy controls. We thank Mustafa Ismail and Jenny Hellqvist for data handling.
Declaration of interest
The authors report no conflicts of interest. The authors alone are responsible for the content and writing for this article.
Data availability statement
Data on patient characteristics and imaging can be obtained from the original data sources or from the authors with the appropriate approval from a research ethics board.
Additional information
Funding
References
- Brown RH Jr, Al-Chalabi A. Amyotrophic lateral sclerosis. N Engl J Med. 2017;377:1602.
- del Aguila MA, Longstreth WT Jr, McGuire V, Koepsell TD, van Belle G. Prognosis in amyotrophic lateral sclerosis: a population-based study. Neurology 2003;60:813–9.
- Ringholz GM, Appel SH, Bradshaw M, Cooke NA, Mosnik DM, Schulz PE. Prevalence and patterns of cognitive impairment in sporadic ALS. Neurology 2005;65:586–90.
- Chio A, Pagani M, Agosta F, Calvo A, Cistaro A, Filippi M. Neuroimaging in amyotrophic lateral sclerosis: insights into structural and functional changes. Lancet Neurol. 2014;13:1228–40.
- van der Burgh HK, Westeneng H-J, Walhout R, van Veenhuijzen K, Tan HHG, Meier JM, et al. Multimodal longitudinal study of structural brain involvement in amyotrophic lateral sclerosis. Neurology 2020;94:e2592–604.
- Menke RAL, Proudfoot M, Talbot K, Turner MR. The two-year progression of structural and functional cerebral MRI in amyotrophic lateral sclerosis. Neuroimage Clin. 2018;17:953–61.
- Schmidt R, Verstraete E, de Reus MA, Veldink JH, van den Berg LH, van den Heuvel MP. Correlation between structural and functional connectivity impairment in amyotrophic lateral sclerosis. Hum Brain Mapp. 2014;35:4386–95.
- Nasseroleslami B, Dukic S, Broderick M, Mohr K, Schuster C, Gavin B, et al. Characteristic increases in EEG connectivity correlate with changes of structural MRI in amyotrophic lateral sclerosis. Cereb Cortex. 2019;29:27–41.
- Schulthess I, Gorges M, Müller H-P, Lulé D, Del Tredici K, Ludolph AC, et al. Functional connectivity changes resemble patterns of pTDP-43 pathology in amyotrophic lateral sclerosis. Sci Rep. 2016;6:38391.
- Pagani M, Chiò A, Valentini MC, Öberg J, Nobili F, Calvo A, et al. Functional pattern of brain FDG-PET in amyotrophic lateral sclerosis. Neurology 2014;83:1067–74.
- Van Laere K, Vanhee A, Verschueren J, De Coster L, Driesen A, Dupont P, et al. Value of 18fluorodeoxyglucose-positron-emission tomography in amyotrophic lateral sclerosis: a prospective study. JAMA Neurol. 2014;71:553–61.
- Cistaro A, Pagani M, Montuschi A, Calvo A, Moglia C, Canosa A, et al. The metabolic signature of C9ORF72-related ALS: FDG PET comparison with nonmutated patients. Eur J Nucl Med Mol Imaging. 2014;41:844–52.
- Kassubek J, Pagani M. Imaging in amyotrophic lateral sclerosis: MRI and PET. Curr Opin Neurol. 2019;32:740–6.
- Agosta F, Altomare D, Festari C, Orini S, Gandolfo F, Boccardi M, et al. Clinical utility of FDG-PET in amyotrophic lateral sclerosis and Huntington’s disease. Eur J Nucl Med Mol Imaging. 2018;45:1546–56.
- Chew S, Atassi N. Positron emission tomography molecular imaging biomarkers for amyotrophic lateral sclerosis. Front Neurol. 2019;10:135.
- Peretti DE, Renken RJ, Reesink FE, de Jong BM, De Deyn PP, Dierckx RAJO, et al. Feasibility of pharmacokinetic parametric PET images in scaled subprofile modelling using principal component analysis. Neuroimage Clin. 2021;30:102625.
- Meles SK, Vadasz D, Renken RJ, Sittig-Wiegand E, Mayer G, Depboylu C, et al. FDG PET, dopamine transporter SPECT, and olfaction: combining biomarkers in REM sleep behavior disorder. Mov Disord. 2017;32:1482–6.
- Meles SK, Kok JG, De Jong BM, et al. The cerebral metabolic topography of spinocerebellar ataxia type 3. Neuroimage Clin 2018;19:90–7.
- Sennfalt S, Klappe U, Thams S, et al. The path to diagnosis in ALS: delay, referrals, alternate diagnoses, and clinical progression. Amyotroph Lateral Scler Frontotemporal Degener 2023;24(1-2):45–53.
- Longinetti E, Regodon Wallin A, Samuelsson K, et al. The Swedish motor neuron disease quality registry. Amyotroph Lateral Scler Frontotemporal Degener 2018;19:528–37.
- Della Rosa PA, Cerami C, Gallivanone F, Prestia A, Caroli A, Castiglioni I, et al. A standardized [18F]-FDG-PET template for spatial normalization in statistical parametric mapping of dementia. Neuroinformatics 2014;12:575–93.
- Signorini M, Paulesu E, Friston K, Perani D, Colleluori A, Lucignani G, et al. Rapid assessment of regional cerebral metabolic abnormalities in single subjects with quantitative and nonquantitative [18F]FDG PET: a clinical validation of statistical parametric mapping. Neuroimage. 1999;9:63–80.
- Katz JS, Dimachkie MM, Barohn RJ. Amyotrophic lateral sclerosis: a historical perspective. Neurol Clin. 2015;33:727–34.
- Rizzolatti G, Cattaneo L, Fabbri-Destro M, Rozzi S. Cortical mechanisms underlying the organization of goal-directed actions and mirror neuron-based action understanding. Physiol Rev. 2014;94:655–706.
- Ravits JM, La Spada AR. ALS motor phenotype heterogeneity, focality, and spread: deconstructing motor neuron degeneration. Neurology 2009;73:805–11.