
Abstract
Background: Cognitive impairment is observed in up to 50% of patients with amyotrophic lateral sclerosis (ALS). The Edinburgh Cognitive and Behavioral ALS Screen (ECAS) is an ALS-specific multi-domain screening tool. Few studies have examined the relationship between ECAS scores and [18F]fluorodeoxyglucose positron emission tomography ([18F]FDG-PET) findings. Objective: To assess the relationship between ECAS scores and glucose metabolism patterns on [18F]FDG -PET images in ALS. Methods: We collected [18F]FDG-PET images from 65 patients with ALS and 39 healthy controls. ECAS scores were collected on all patients and we calculated the correlation to [18F]FDG-PET in order to investigate the potential links between cognition and glucose metabolism. Results: We observed hypometabolism in the frontal cortex, insula, and limbic system, together with hypermetabolism in the cerebellum in patients with ALS compared to controls. A lower ECAS total score was associated with lower glucose metabolism in the right orbitofrontal gyrus and higher glucose metabolism in lateral occipital, medial occipital, and cerebellar regions, among patients with ALS. Similar results, although less widespread, were observed in the analyses of ECAS ALS-specific scores. Conclusions: The metabolic patterns in [18F]FDG -PET show that changes in the glucose metabolism of corresponding areas are related to cognitive dysfunction in ALS, and can be detected using the ECAS.
Introduction
Amyotrophic lateral sclerosis (ALS) is a rapidly progressing neurodegenerative disease, involving loss of motor neurons leading to death often within 2–3 years from initial symptoms (Citation1). Although ALS has long been considered a purely neuromuscular disease, it is now well established that up to half of people with ALS either present with cognitive impairment at the time of onset or develop cognitive impairment during the disease course. ALS and frontotemporal dementia (FTD) overlap in up to 15% of cases and these conditions are now described as being part of the same spectrum (Citation2–5). Patients can present with cognitive impairment (ALSci), behavioral impairment (ALSbi), or a combination of both (ALScbi) (Citation6). Cognitive deficits are generally observed in language, executive function, and social cognition (Citation7). Among the behavioral symptoms, apathy is regarded as the most common, but disinhibition, obsessiveness, and loss of empathy have also been described (Citation8,Citation9). Furthermore, neuropsychiatric disorders in patients with ALS or their family members have been described as a risk factor for ALSci and ALSbi (Citation10).
The Edinburgh Cognitive and Behavioral ALS Screen (ECAS) is a screening questionnaire evaluating both cognitive and behavioral changes in patients with ALS (Citation11). The ECAS was recently validated in Swedish and is now available in 24 languages (Citation12). While the ECAS may evaluate cognitive impairment clinically, there is currently no data on its correlation with neuroradiological biomarkers of ALS. Positron Emission Tomography (PET) with the 18F-Fluorodeoxyglucose ligand ([18F]FDG -PET) is used to detect metabolic alterations indicative of synaptic dysfunction and neurodegeneration in vivo (Citation13). [18F]FDG -PET imaging has led to an improved understanding of ALS by demonstrating specific metabolic correlates of the disease and specifically of cognitive impairment such as frontal hypometabolism and hypermetabolism in the corticospinal tract and the cerebellum of patients with ALS (Citation14–16). These patterns showed high accuracy in discriminating patients with ALS from healthy controls, confirming a glucose metabolism profile observed in ALS with hypometabolism in anterior parts of the brain, and posterior hypermetabolism (Citation14,Citation17–20). When investigating cognition and [18F]FDG -PET in ALS, patients with cognitive impairment exhibit greater hypometabolism in the frontal cortex compared to patients without cognitive impairment as assessed with the use of a selection of neuropsychological batteries, including the Mini Mental State Examination and Frontal Assessment Battery (Citation14). However, the relationship between glucose metabolism in ALS and cognitive impairment measured by the ECAS is currently unclear. To address this knowledge gap, we aimed to investigate [18F]FDG -PET within a cohort of Swedish ALS patients, compared to healthy controls. Furthermore, we aimed to characterize the relationship between metabolic alterations and ECAS scores in patients with ALS.
Methods
Study population
We included 65 patients diagnosed with ALS at The ALS Clinical Research Center at the Karolinska University Hospital in Stockholm, Sweden, between September 2017 and October 2021. The study was approved by the Swedish Ethical Review Authority (2014/1815-31/4, 2017/828-32, 2018/1605-31, 2021-06397-02), completed in accordance with Helsinki Declaration and in respect of Good Clinical Practice, with all participants giving written informed consent. All patients met the revised El Escorial criteria for clinically definite, probable, or possible ALS and had at least one available ECAS assessment and one [18F]FDG-PET scan around the time of diagnosis. Patients were excluded if they presented with symptoms of frontotemporal dementia (FTD). Clinical disability was assessed by the ALS functional rating scale (ALSFRS-R) (Citation21). To assess the difference between ALS patients and controls, we included as a control group 39 cognitively healthy adults, who were spouses or friends of patients with movement disorders collected at the University Medical Center of Groningen in the Netherlands were included. Controls were not eligible if they had a first-degree family member with a neurodegenerative diseases, cognitive impairment, or a Mini Mental State Examination (MMSE) score below 28. A description of this sample has previously been published (Citation22,Citation23).
Cognitive assessment
To assess cognitive function, we used the validated Swedish ECAS version A, evaluating both cognition and behavioral changes in patients with ALS and administered by a single study nurse throughout the study (Citation11,Citation12). Three different versions are available to avoid practice effect when administering the ECAS longitudinally (Citation24). The ECAS total score (maximum 136 points) includes two sections: an ALS-specific section (100 points) and a non-ALS-specific section (36 points) (Citation11). We used the Swedish cutoff for the ECAS total score which is 108 (Citation12). The ALS-specific section reflects domains that are most impacted in people living with ALS: executive functions (reverse digit span, social cognition, alternation, and inhibitory sentence completion), verbal fluency (free fluency and restricted fluency), and language (naming, comprehension, and spelling). The non-ALS-specific section reflects domains that are usually relatively well preserved in ALS and includes both memory (immediate recall, delayed recall, and delayed recognition) and visuospatial functions (dot counting, cube counting, and number location).
[18F]FDG -PET acquisition, reconstruction and pre-processing
For the 65 ALS patients, all [18F]FDG -PET-images were acquired on a Siemens Biograph 128mCT (Siemens Healthcare Molecular Imaging USA, Inc.). [18F]FDG -PET acquisition was done 30–45 min after intravenous injection of 2 MBq/kg weight (min 125MBq, max 250MBq) of [18F]FDG with a duration of approximately 10 min. Prior to the PET-acquisition, a computerized tomography (CT) scan was acquired to be used for attenuation correction. For the controls recruited in Groningen, Static [18F]FDG -PET scanning was performed on a Siemens Biograph mCT-64 PET/CT camera (Siemens, Munich, Germany) in a three-dimensional mode, 30 minutes after intravenous injection of 200 MBq of [18F]FDG. The image acquisition time for controls was of approximately 5 min.
Both scanner types used, for patients and for controls, were deemed comparable, as supported by the phantom measurements available in Supplementary Figure 1. Phantom measurements with a National Electrical Manufacturers Association (NEMA) phantom were done to compare the two systems used in the two sites. The phantom was filled with approximately 30 MBq of [18F]FDG with a ratio of ten between the hot spheres and the background. PET data was acquired for 10 minutes. Prior to the PET-acquisition a computed tomography (CT) was acquired to be used for attenuation correction. Phantom images were reconstructed using an iterative method with 3 iterations and 21 subsets matrix 256 and smoothed with a Gaussian 8 mm full-width at half-maximum filter. Attenuation correction, scatter correction, time of flight (ToF) and point spread function correction were applied. Preliminary unpublished results have shown that the deviation of contrast recovery between the two systems is minimal, allowing a reliable comparison between the two datasets. Nevertheless, to further minimize the potential bias of using different systems, the images were smoothed with a 10 mm filter before statistical analysis (see below).
PET images from both sites were reconstructed using an iterative method with 3 iterations and 21 subsets matrix 256 and smoothed with a Gaussian 8 mm full width at half-maximum filter. Attenuation correction, scatter correction, ToF, and point spread function correction were applied. The voxel size of the reconstructed images was 3.2 × 3.2 × 2.0 mm.
Statistical Parametric Mapping (SPM) 12 implemented in MATLAB R2018b (MathWorks, Natick, MA, USA) was used for image pre-processing. A customized brain [18F]FDG-PET template was utilized for spatial normalization (Citation25). Intensity normalization was performed using the 0.8 default SPM value of grey matter threshold, and images were smoothed with a 10 mm filter before statistical analysis. The reason for choosing a smoothing of 10mm is that it allows us to compensate for the potential slight differences in terms of spacial resolution between the two cameras used. To assess the specificity of glucose metabolism in ALS, the [18F]FDG -PET images of the 65 patients with ALS were compared to the 39 healthy controls using a two-sample t-test in SPM12, while controlling for age, sex, site of onset. ALSFRS-R score and C9orf72. We also performed a sensitivity analysis, including only patients without a C9orf72 mutation, as mutation carriers more often have cognitive impairment than non-carriers. Here, we re-run all analyses only including patients not carrying the C9of72 repeat expansion (n = 57).
Statistical analyses
Clinical data
Clinical information was collected on all ALS cases. The following variables were included in the regression models (see next section): age, sex, and site of ALS onset (spinal onset versus bulbar onset). In addition, we included ALSFRS-R score to adjust for functional clinical disability, as well as the presence of a C9orf72 repeat expansion. Differences in age between patients with ALS and controls were assessed with t-test. The assumption of normality was assessed with histograms and normality plots. A chi-sqare test was used when comparing sex between the groups. All analyses on clinical data were performed using the open source software R version 4.3.1 and the package dplyr (Citation26).
PET analyses
To assess the relationship between glucose metabolism and cognition among ALS patients, multiple regression analyses were performed using [18F]FDG-PET images as the dependent variable, and the ECAS total score, ECAS ALS-specific score, or each ECAS subscore (executive function, verbal fluency, language, memory, visuospatial function) as the independent variables. The models were adjusted for age, sex, site of onset (spinal versus bulbar onset), ALSFRS-R score, and presence of C9orf72 repeat expansion, considering mutation carriers more often have cognitive impairment than non-carriers. All results were adjusted for multiple comparisons using family-wise error (FWE) corrections at the cluster level (p < 0.001).
Results
Patient characteristics
In total, [18F]FDG -PET images from 65 patients with ALS and 39 controls were included in the study. Demographic results and patient characteristics are presented in . The sex distribution was similar between ALS and controls (p = 0.24). Patients with ALS was slightly older compared to controls (mean age in ALS 62.9 years and in controls 58.1 years, p = 0.05), but the difference was not statistically significant. Eleven patients were carriers of a known ALS-causing mutation (8 C9orf72, 1 TBK1 and 2 SOD1).
Table 1. Characteristics of patients with ALS and healthy controls.
ECAS scores
The total ECAS scores ranged from 51 to 129 (the maximum score on the test is 136) with a mean score of 107, and 27 patients (42%) had a total score below 108, which is the cutoff for cognitive impairment (Citation12). The ALS specific and nonspecific scores ranged from 32 to 94 (mean 80) and 10 to 36 (mean 28), respectively.
Glucose metabolism in ALS patients compared to controls
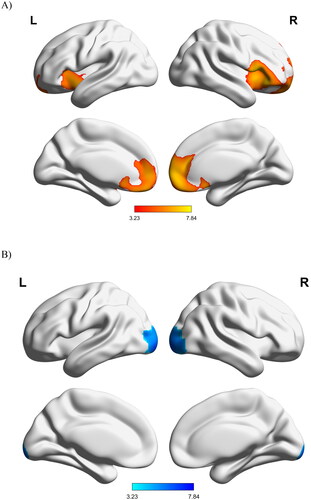
In comparison to healthy controls, patients with ALS displayed a large area of decreased metabolism in the bilateral frontal and prefrontal cortices, insula, and midbrain, as well as increased metabolism in the bilateral occipital cortex and the right cerebellum ().
Figure 1. Changes in glucose metabolism in patients with ALS compared to controls: (A) hypermetabolism and (B) hypometabolism. L: left; R: right.
Glucose metabolism and cognition
Regression analyses among patients with ALS showed a positive correlation between ECAS total score and glucose metabolism in the cingulate cortex, right inferior frontal cortex, and right insula, meaning that a lower ECAS total score was associated with decreased metabolism in these areas. Negative correlations were found in the occipital cortex, and the fusiform gyri, i.e. lower ECAS were associated to increased metabolism in these regions (, ). We found similar results regarding the negative correlations for ECAS ALS-specific scores. However, we did not find any significant positive correlations with ECAS ALS-specific scores. When investigating correlations between brain glucose metabolism and the ECAS sub-domain scores, we found positive correlations with executive scores in the anterior cingulum cortex bilaterally, with language scores in the right interior frontal cortex, and with visuospatial scores in the left middle and inferior frontal regions. In addition, we found negative correlations with executive scores in the left inferior temporal cortex, left fusiform gyrus, and right inferior occipital cortex as well as with verbal fluency scores in the left cuneus and left fusiform gyrus (Supplementary Table 1, Supplementary Figure 2).
Figure 2. Relationship between ECAS scores with glucose metabolism in patients with ALS (corrected for age, sex, ALSFRS-R and C9orf72 mutation status). All results were corrected at the cluster level with family-wise error rate corrections (p < 0.05). (A) Negative correlation between ECAS total scores and FDG-PET, (B) Negative correlation between ECAS ALS-specific scores and FDG-PET, (C) Positive correlation between ECAS total score and FDG-PET. L: left; R: right.
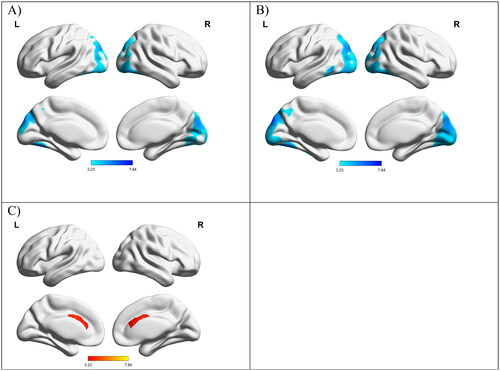
Table 2. Correlations between glucose metabolism with ECAS total, and ECAS ALS-specific in patients with ALS.
Considering that our cohort included eight patients carrying the C9orf72 mutation, we conducted a sentivity analysis on the 57 patients who were not C9orf72 carriers (Supplementary Table 2). Similar to our full cohort (), we found a negative correlation with ECAS total score in the left fusiform, right fusiform and left cuneus. Overall, we found similar correlations which led us to include the C9orf72 carriers in our full analysis.
Discussion
In this study, we assessed glucose metabolism using [18F]FDG-PET imaging in patients with ALS, and investigated its association with cognitive impairment as evaluated by the validated Swedish ECAS version A.
We observed hypometabolism in the frontal cortex, insula, and as well as in limbic system, together with hypermetabolism in the cerebellum in ALS patients compared to controls, which is in line with previous findings. We also observed hypermetabolism in the occipital cortices. Earlier studies present contradictory results where some showed occipital hypometabolism (Citation15,Citation18,Citation27), whereas others found hypermetabilism in occipital lobes, i.e. similar observation to ours (Citation28,Citation29). In addition, occipital lobe hypermetabolism has been described in the early stages of dementia, probably representing a compensatory mechanism for other brain regions displaying reduced function (Citation29–32). The frontal and occipital lobes are connected through long-distance white matter tracts essential for cognitive functions including visual perception, facial recognition, complex behavioral tasks, and language comprehension (Citation32,Citation33). One could speculate that during the early development of cognitive dysfunction in ALS, characterized by reduced metabolism mainly in frontal areas, the brain aims to adapt to the disease by recruiting other regions. Our sample of 65 ALS patients presented a mean time-window between diagnosis and PET acquisition of 110.4 d (SD: 236.6), a mean of 179.7 d (SD: 320.5) between diagnosis and ECAS data collection, and a mean of 111.6 days (SD: 141.8) between PET and ECAS collection (Supplementary Table 3). We conducted an additional sensitivity analysis removing 6 outliers from our sample, for 6 patients which presented a time window between diagnosis and ECAS collection above 700 d (Supplementary Table 3). This revised analysis on 59 ALS patients showed a mean time-window between diagnosis and PET acquisition of 52.9 d (SD: 63.5), a mean of 87.0 d (SD: 81.1) between diagnosis and ECAS data collection, and a mean of 80.6 d (SD: 86.3) between PET and ECAS collection. Considering this revised sample (excluding patients with an out of the ordinary delay between diagnosis and data collection), patients do indeed appear to be in the early stages of their disease, which could support a time-dependent hypermetabolism.
Furthermore, the ECAS scores were negatively correlated with occipital metabolism supporting the hypothesis that the more severe cognitive impairment, the higher the compensatory occipital glucose metabolism. Also, in patients with ALS, we found that lower ECAS scores were correlated with a decreased metabolism in the orbitofrontal cortex, and an increased metabolism in the cerebellar cortex. Previous studies have described a similar pattern of frontal lobe metabolism in ALS-FTD, i.e. further decreased metabolism with more impaired cognition (Citation14,Citation34). The aforementioned studies have used comprehensive neuropsychological evaluations, but here we show that one cognitive screening tool is sufficient and sensitive enough to identify impairments associated with abnormal metabolism. The pattern of hyper- and hypometabolism seem to be driven mainly by the executive and verbal fluency ECAS sub scores.
The observations of potential compensatory mechanisms might suggest that the patients included in our study have a rather preserved cognitive function, and thus are not representative of the general ALS population. Even if the proportion of patients below the ECAS cutoff of cognitive impairment (41%) is in line with previous reports, it is possible that our cohort have a high overall cognitive performance. Recently, the concept of cognitive reserve has been discussed in ALS (Citation35). Cognitive reserve seems to act as a protection for cognitive decline where individuals with high cognitive reserve seem to be more resilient to brain changes than others (Citation36,Citation37). This could support the idea that patients with a higher cognitive reserve perform well on ECAS leading to a stronger compensatory mechanism, ultimately being reflected by greater brain glucose mechanisms. Following these speculations, our sample might represent patients in the upper range of ECAS performance in ALS.
Our study was conducted in a well characterized Swedish cohort with a fairly large sample size. In our knowledge, this is the first study looking at [18F]FDG-PET and cognition in an ALS cohort from Sweden. We acknowledge several limitations. First, the patient cohort was collected at Karolinska University Hospital (with all PET scans performed using the same camera) and healthy controls had performed their PET scans at a different center. However, a sensitivity analysis was done prior to the analysis showing the technical results are comparable (see Methods section). Furthemore, unlike other neurodegenerative disorders characterized by diffuse hypometabolism, the FDG distribution in ALS shows in almost all cortical and subcortical regions either hypo or hyperfixation of the tracer. Therefore, in ALS the choice to normalize by the brain intensity average stems from the above pathophysiological characteristics in the attempt to reduce possible bias and resulting, in the worst of the cases, in a minimal discrepancy from the “real/quantitative” data. Second, despite speculations regarding the concept of cognitive reserve, we did not assess this specifically in the analysis. In follow up studies, one could consider assessing cognitive reserve (by using a proxy measure such as education) in the statistical models. Third, patients with ALS in our cohort were older than controls (mean age in ALS 62.9 years and in controls 58.1 years, p = 0.05). However, as our main observation were within the patient group (correlation between ECAS and glucose metabolism), we do not consider this to impact our results. Finally, we did not assess behavioral symptoms or classified the patients into different cognitive/behavioral categories as proposed by Strong et al. (Citation38). Different network systems are involved in cognitive versus motor dysfunction in ALS (Citation39,Citation40). However, previous research has not shown a discrepancy in metabolic patterns between cognitive versus motor impairment, instead showing alterations in cognitively impaired patients more in line with the general pattern seen in ALS (Citation15). Future studies should explore metabolic patterns correlated to different behavioral symptoms in ALS.
Conclusion
This study confirms previous findings of metabolic alterations seen on [18F]FDG-PET imaging in ALS with hypometabolism primarily observed in the frontal cortex and hypermetabolism in the occipital cortex and cerebellum. We also see hypometabolism located in the limbic system. The metabolic patterns in [18F]FDG -PET show that changes in the glucose metabolism of corresponding areas are related to cognitive impairment in ALS supporting the disease continuum of cognitive function in ALS ranging from pure motoric impairment in one end, and frontotemporal dementia in the other. Future studies are needed to elucidate the predictive value of both of these modalities as well as their role in presymptomatic individuals.
Supplemental Material
Download MS Word (339.2 KB)Acknowledgment
We would like to thank Jenny Hellqvist for her precious help during the data collection process.
We also would like to thank Sanne K Meles (Department of Neurology, University of Groningen, University Medical Center Groningen, Groningen, The Netherlands), Fransje Reesink (Department of Neurology, University of Groningen, University Medical Center Groningen, the Netherlands) and Professor Klaus L. Leenders (Department of Nuclear Medicine, University of Groningen, University Medical Center Groningen, Groningen (UMCG), in the Netherlands, for providing data on healthy controls for the PET section. More importantly, we would like to thank the patients and healthy controls who contributed to this study.
Disclosure statement
C. Ingre has consulted for Cytokinetics, Pfizer, BioArctic, Novartis, Tikomed, Ferrer, Amylyx and Mitsubishi and was a DMC member for Appelis Pharmaceutical. She is also a board member of Tobii Dynavox and of the Stiching TRICALS Foundation; all outside the submitted work. All other authors declare no conflict of interest.
Additional information
Funding
References
- del Aguila MA, Longstreth WT, McGuire V, Koepsell TD, van Belle G. Prognosis in amyotrophic lateral sclerosis: a population-based study. Neurology 2003;60:813–9. PMID: 12629239.
- Katz JS, Katzberg HD, Woolley SC, Marklund SL, Andersen PM. Combined fulminant frontotemporal dementia and amyotrophic lateral sclerosis associated with an I113T SOD1 mutation. Amyotroph Lateral Scler. 2012;13:567–9.
- Ng ASL, Rademakers R, Miller BL. Frontotemporal dementia: a bridge between dementia and neuromuscular disease. Ann N Y Acad Sci. 2015;1338:71–93.
- van Es MA, Hardiman O, Chio A, Al-Chalabi A, Pasterkamp RJ, Veldink JH, et al. Amyotrophic lateral sclerosis. Lancet. 2017;390:2084–98.
- Chì A, Moglia C, Canosa A, Manera U, Vasta R, Brunetti M, et al. Cognitive impairment across ALS clinical stages in a population-based cohort. Neurology. 2019;93(10):e984–e994.
- Strong MJ, Abrahams S, Goldstein LH, Woolley S, Mclaughlin P, Snowden J, et al. Amyotrophic lateral sclerosis – frontotemporal spectrum disorder (ALS-FTSD): Revised diagnostic criteria. Amyotroph Lateral Scler Frontotemporal Degener. 2017;18:153–74.
- Beeldman E, Raaphorst J, Klein Twennaar M, de Visser M, Schmand BA, de Haan RJ. The cognitive profile of ALS: a systematic review and meta-analysis update. J Neurol Neurosurg Psychiatry. 2016;87:611–9.
- Grossman AB, Woolley-Levine S, Bradley WG, Miller RG. Detecting neurobehavioral changes in amyotrophic lateral sclerosis. Amyotroph Lateral Scler. 2007;8:56–61.
- Lillo P, Mioshi E, Zoing MC, Kiernan MC, Hodges JR. How common are behavioural changes in amyotrophic lateral sclerosis? Amyotroph Lateral Scler. 2011;12:45–51.
- McHutchison CA, Leighton DJ, McIntosh A, Cleary E, Warner J, Porteous M, et al. Relationship between neuropsychiatric disorders and cognitive and behavioural change in MND. J Neurol Neurosurg Psychiatry. 2020;91:245–53.
- Abrahams S, Newton J, Niven E, Foley J, Thomas H, Abrahams, S, et al. Screening for cognition and behaviour changes in ALS. 8421. Amyotroph Lateral Scler Frontotemporal Degener. 2014;15:9–14.
- Foucher J, Winroth I, Lovik A, Sennfält S, Pereira JB, Fang F, et al. Validity and reliability measures of the Swedish Karolinska version of the Edinburgh cognitive and behavioral ALS screen (SK-ECAS). Amyotroph Lateral Scler Frontotemporal Degener. 2023;24(7–8):713–18.
- Jack CR, Bennett DA, Blennow K, Carrillo MC, Feldman HH, Frisoni GB, et al. A/T/N: An unbiased descriptive classification scheme for Alzheimer disease biomarkers. Neurology 2016;87:539–47.
- Canosa A, Pagani M, Cistaro A, Montuschi A, Iazzolino B, Fania P, et al. 18F-FDG-PET correlates of cognitive impairment in ALS. Neurology 2016;86:44–9.
- Canosa A, Moglia C, Manera U, Vasta R, Torrieri MC, Arena V, et al. Metabolic brain changes across different levels of cognitive impairment in ALS: a 18 F-FDG-PET study. J Neurol Neurosurg Psychiatry 2021;92:357–63.
- Kassubek J, Pagani M. Imaging in amyotrophic lateral sclerosis: MRI and PET. Curr Opin Neurol. 2019;32:740–6.
- Cistaro A, Pagani M, Montuschi A, Calvo A, Moglia C, Canosa A, et al. The metabolic signature of C9ORF72-related ALS: FDG PET comparison with nonmutated patients. Eur J Nucl Med Mol Imaging. 2014;41:844–52.
- Pagani M, Chiò A, Valentini MC, Öberg J, Nobili F, Calvo A, et al. Functional pattern of brain FDG-PET in amyotrophic lateral sclerosis. Neurology 2014;83:1067–74.
- Matías-Guiu JA, Pytel V, Cabrera-Martín MN, Galán L, Valles-Salgado M, Guerrero A, et al. Amyloid- and FDG-PET imaging in amyotrophic lateral sclerosis. Eur J Nucl Med Mol Imaging. 2016;43:2050–60.
- Canosa A, Calvo A, Moglia C, Manera U, Vasta R, Di Pede F, et al. Brain metabolic changes across King’s stages in amyotrophic lateral sclerosis: a 18F-2-fluoro-2-deoxy-d-glucose-positron emission tomography study. Eur J Nucl Med Mol Imaging. 2021;48:1124–33.
- Cedarbaum JM, Stambler N, Malta E, Fuller C, Hilt D, Thurmond B, et al. The ALSFRS-R: a revised ALS functional rating scale that incorporates assessments of respiratory function. BDNF ALS Study Group (Phase III). J Neurol Sci. 1999;169:13–21.
- Meles SK, Vadasz D, Renken RJ, Sittig‐Wiegand E, Mayer G, Depboylu C, et al. FDG PET, dopamine transporter SPECT, and olfaction: combining biomarkers in REM sleep behavior disorder. Movement Disorders. 2017;32:1482–6.
- Peretti DE, Renken RJ, Reesink FE, de Jong BM, De Deyn PP, Dierckx RAJO, et al. Feasibility of pharmacokinetic parametric PET images in scaled subprofile modelling using principal component analysis. Neuroimage Clin. 2021;30:102625.
- Crockford CJ, Kleynhans M, Wilton E, Radakovic R, Newton J, Niven EH, et al. ECAS A-B-C: alternate forms of the Edinburgh cognitive and behavioural ALS Screen. Amyotroph Lateral Scler Frontotemporal Degener. 2018;19:57–64.
- Della Rosa PA, Cerami C, Gallivanone F, Prestia A, Caroli A, Castiglioni I, et al. A standardized [18F]-FDG-PET template for spatial normalization in statistical parametric mapping of dementia. Neuroinformatics 2014;12:575–93.
- R Core Team. R: a language and environment for statistical computing. R Foundation for Statistical Computing. 2020. Vienna, Austria. Available at: https://www.r-project.org.
- De Vocht J, Van Weehaeghe D, Ombelet F, Masrori P, Lamaire N, Devrome M, et al. Differences in cerebral glucose metabolism in ALS patients with and without C9orf72 and SOD1 mutations. Cells 2023;12:933.
- Van Laere K, Vanhee A, Verschueren J, De Coster L, Driesen A, Dupont P, et al. Value of 18fluorodeoxyglucose-positron-emission tomography in amyotrophic lateral sclerosis: a prospective study. JAMA Neurol. 2014;71:553–61.
- Van Weehaeghe D, Ceccarini J, Delva A, Robberecht W, Van Damme P, Van Laere K. Prospective validation of 18F-FDG brain PET discriminant analysis methods in the diagnosis of amyotrophic lateral sclerosis. J Nucl Med. 2016;57:1238–43. Epub 2016 Mar 3. PMID: 26940764.
- Ashraf A, Fan Z, Brooks DJ, Edison P. Cortical hypermetabolism in MCI subjects: a compensatory mechanism? Eur J Nucl Med Mol Imaging. 2015;42:447–58.
- Wang J, Liu J, Wang Z, Sun P, Li K, Liang P. Dysfunctional interactions between the default mode network and the dorsal attention network in subtypes of amnestic mild cognitive impairment. Aging. 2019;11:9147–66.
- Turken AU, Dronkers NF. The neural architecture of the language comprehension network: converging evidence from lesion and connectivity analyses. Front Syst Neurosci. 2011;5:1.
- Shekari E, Nozari N. A narrative review of the anatomy and function of the white matter tracts in language production and comprehension. Front Hum Neurosci. 2023;17:1139292.
- Rajagopalan V, Pioro EP. Longitudinal 18F-FDG PET and MRI reveal evolving imaging pathology that corresponds to disease progression in a patient with ALS-FTD. Front Neurol. 2019;10:234.
- Canosa A, Palumbo F, Iazzolino B, Peotta L, Di Pede F, Manera U, et al. The interplay among education, brain metabolism, and cognitive impairment suggests a role of cognitive reserve in amyotrophic lateral sclerosis. Neurobiol Aging. 2021;98:205–13.
- Stern Y. Cognitive reserve in ageing and Alzheimer’s disease. Lancet Neurol. 2012;11:1006–12.
- Temp AGM, Kasper E, Machts J, Vielhaber S, Teipel S, Hermann A, et al. Cognitive reserve protects ALS-typical cognitive domains: a longitudinal study. Ann Clin Transl Neurol. 2022;9:1212–23.
- Strong MJ, Grace GM, Freedman M, Lomen-Hoerth C, Woolley S, Goldstein LH, et al. Consensus criteria for the diagnosis of frontotemporal cognitive and behavioural syndromes in amyotrophic lateral sclerosis. Amyotroph Lateral Scler. 2009;10:131–46.
- Agosta F, Canu E, Valsasina P, Riva N, Prelle A, Comi G, et al. Divergent brain network connectivity in amyotrophic lateral sclerosis. Neurobiol Aging. 2013;34:419–27.
- Trojsi F, Di Nardo F, D'Alvano G, Passaniti C, Sharbafshaaer M, Canale F, et al. Cognitive, behavioral, and brain functional connectivity correlates of fatigue in amyotrophic lateral sclerosis. Brain Behav. 2023;13:e2931.