
Abstract
Aim
The purpose of this study was to investigate the psychometric properties of the EQ-5D-3L and the EQ-5D-5L in patients with back and neck pain.
Materials and methods
Participants from two independent clinical survey studies was included in this study. In total 164 participants were answering either the EQ-5D-3L or the EQ-5D-5L after their visit to a physiotherapist in primary care for back and neck pain. Rasch analysis was performed to measure the psychometric properties of the two instruments.
Main findings
Overall, the EQ-5D-5L showed preliminary evidence of good psychometric properties. The items in both the EQ-5D-5L and the EQ-5D-3L showed acceptable goodness-of-fit indicating unidimensionality for both instruments measuring the concept health-related quality of life. All test persons fit the model, but the person separation reliability and person separation index were only barely acceptable for the EQ-5D-5L.
Conclusions
The results indicate that the EQ-5D-5L should be the preferred option when evaluating health-related quality of life with the EQ-5D, especially for patients with back and neck pain.
Introduction
Back and neck pain are common and often leads to an intervention period in a physiotherapy clinic. Persons experiencing back and neck pain are diverse and of various ages, but most commonly are between 18 and 65 years old [Citation1,Citation2]. Most people experience back and neck pain at some time in their life with back pain being more common with an incidence of 1.5–36% compared to 0.6–21% for neck pain. The prevalence for both back and neck pain is higher for women [Citation3,Citation4].
Back and neck pain are also correlated with impact on health-related quality of life (HRQoL) [Citation5,Citation6]. HRQoL is defined as how well a person functions in their life and how this person experience health in domains such as physically, mentally and socially [Citation7]. Therefore, it is important to determine the effectiveness of HRQoL measures so that they actually capture the aspects that the intervention is likely to affect.
The EQ-5D is a questionnaire used to evaluate HRQoL in terms of valuing one’s health [Citation8], and is the preferred measure of quality of life for health technology assessment in many European countries [Citation9]. The EQ-5D is widely used in Sweden in clinical practice, public health surveys, and in health economic evaluations [Citation10,Citation11]. The instrument is generic and is constructed for self-assessment and has been used globally in research since its development in the 1990s by the EuroQol Group [Citation8,Citation12]. The EQ-5D was developed to be applicable to a wide range of client groups and interventions in research, health care, and public health [Citation8]. The instrument is easy to administer, takes a short time to implement, and has been translated into many different languages [Citation12,Citation13]. However, it has been found that the EQ-5D might not be sufficiently sensitive to detect changes in self-rated health for persons with less severe health states, and it has also shown problems with ceiling effects [Citation14,Citation15]. To address these problems, the EuroQol Group further developed the instrument resulting in a new version in which each domain is described with a five-level rating scale instead of only a three-level rating scale. The new version was named EQ-5D-5L, where L means level, and at the same time the previous version was named EQ-5D-3L [Citation16]. The psychometric properties of the EQ-5D-5L have been compared with the EQ-5D-3L in studies conducted in different countries and with different groups of clients [Citation14,Citation17–21]. However, there is limited research including persons with back and neck pain.
A review by Coons et al. [Citation12] concluded that the construct validity and test–retest reliability were good for the EQ-5D-3L when testing patients in general, and Solberg et al. [Citation13] found good results for reliability and validity when testing patients having undergone surgery for back pain. Studies evaluating the EQ-5D-5L show better results in terms of face validity [Citation11,Citation13], convergent validity [Citation11,Citation13,Citation22], test–retest reliability [Citation11,Citation13], and ceiling effect [Citation11,Citation13,Citation22] in comparison with the EQ-5D-3L when testing several patient groups in different parts of the world. Most previous studies on the EQ-5D-3L and EQ-5D-5L have applied classical test theory (CTT) in which the statistical analysis is based on a summary of scores. Only a few studies have applied modern test theory, including Rasch analysis [Citation23,Citation24]. To our knowledge, no studies, either with CTT or modern test theory, have evaluated either of the two versions of the EQ-5D for persons with back or neck pain.
The benefit of applying Rasch analysis is that it allows for examination of the unidimensionality of the concept being measured, the hierarchical structure of items, and the persons taking the test [Citation25]. The results of a Rasch analysis can therefore indicate how well the EQ-5D works, on either of the two versions, when evaluating HRQoL in persons with back and neck pain.
The purpose of this study was to use Rasch analysis to evaluate the psychometric properties of the EQ-5D-3L and the EQ-5D-5L for persons with back or neck pain.
The following were the specific research questions for both the EQ-5D-3L and the EQ-5D-5L:
Do the rating scales of the EQ-5D-3L and the EQ-5D-5L demonstrate sound psychometric properties in terms of ordering of category measures, acceptable goodness-of-fit of the rating scale categories to the Rasch model, and ordering of the calibration thresholds between the rating scale categories?
Do the items show unidimensionality as determined by acceptable goodness-of-fit to the Rasch rating scale model and principal component analysis (PCA)?
Do the persons with back and neck pain show valid patterns of responses as determined by acceptable goodness-of-fit to the Rasch rating scale model?
Does the scale show acceptable reliability as determined by person and item separation?
Materials and methods
This study used Rasch analysis to explore the psychometric properties of the EQ-5D-3L and the EQ-5D-5L. The basis for Rasch analysis is that the data are analysed based on a mathematical model in which the probability for an answer depends upon the ability of the person and the level of difficulty of the items. Thus, in the case of the EQ-5D, persons with problems related to their back and neck are expected to generate lower scores on all items if they experience lower levels of problems, whereas it is expected that experiences of higher levels of problems will generate higher scores. Accordingly, items will be hierarchically ordered with more severe items ranked at the top. This order then allows for an analysis how well the EQ-5D targets varying levels of problems in persons taking the test [Citation25].
The survey data used in this study were collected in Västerbotten county council in northern Sweden and consisted of two independent samples (Group 3L and Group 5L), both including patients seeking primary health care due to back and neck pain. In the first sample (Group 3L), retrospective data were used from a comprehensive questionnaire with questions considered relevant for patients with back and neck pain, including, among other things, the EQ-5D-3L [Citation26]. The data concerned 114 patients from 15 primary healthcare physiotherapy clinics during two time periods – between March 2009 and December 2010 and between May 2011 and December 2011 [Citation26]. In the second sample (Group 5L), survey data from the EQ-5D-5L were collected from 10 primary health care physiotherapy clinics between October 2014 and May 2015 and between October 2015 and January 2016. Information and an invitation to participate were given to 86 patients (Group 5L). In total, 50 patients agreed to participate and completed the EQ-5D-5L questionnaire. Sample characteristics for Group 3L and Group 5L are shown in .
Table 1. Sample characteristics by group (n = 164).
This study was approved by the ethics committee of the Medical Faculty of Umeå University (Dnr 08-117M; 2014/297-32). All participants in this study were asked for written informed consent. Inclusion criteria were back and/or neck pain, age between 18 and 65 years, and absence of cancer, rheumatoid arthritis, or other systemic diseases. Patients with a first episode of pain, concurrent pain, or chronic pain were invited to participate in conjunction with the first visit to an ordinary treatment period in a physiotherapy clinic. No specialist or general practitioner referral for physiotherapy treatment was required during the time of data collection. Participants were assured that declining to participate in the study would not affect their physiotherapy treatment.
The EQ-5D is intended for self-completion and consists of two parts. The first part is a questionnaire with five items concerning mobility, self-care, usual activities, pain/discomfort and anxiety/depression. The second part is a visual analogue scale (EQ-VAS), but this was not addressed in this study. In the EQ-5D-3L, the responses record three levels of problems (no problems, some or moderate problems and extreme problems) within each item [Citation8]. In the EQ-5D-5L, each item can take one of five responses (no problems, slight problems, moderate problems, severe problems and extreme problems) [Citation16]. The different responses are given a number of 1–3 or 1–5, respectively, where the first response, no problem corresponds to number 1 and the last response, extreme problems, corresponds to number 3 or 5, respectively. The responses from all items can then be used to calculate a health index for HRQoL [Citation24]. This health index was not used in this study.
Data analysis
Descriptive data for the two groups were analysed using the Statistical Package for Social Sciences 23 (SPSS) [Citation27]. Rasch analysis was performed using the WINSTEPS Rasch computer software programme, version 3.92.1 [Citation28], and raw scores for both groups were analysed separately. The software generates statistics that can be used to test how well the data fit a chosen model as well as aspects of reliability of the estimated measures. In the present study, the Rasch rating scale model was used to examine the psychometric properties of the EQ-5D-3L and the EQ-5D-5L [Citation29]. Both the rating scale structure and aspects of validity and reliability were examined. The detailed procedures for performing Rasch analysis have been described elsewhere [Citation25,Citation29].
To determine if the response scales of the EQ-5D-3L and the EQ-5D-5L have sound psychometric properties, we first examined the functioning of the rating scale by analysing the frequency distribution, category measures and threshold calibrations. We anticipated that >95% of persons and items would meet the requirement for fit to the Rasch rating scale model. Fit to the model was measured by infit and outfit mean square (MnSq) [Citation25,Citation30].
We examined the frequency distribution of each response by evaluating how often each response was used. Following the guidelines from Linacre [Citation31], at least 10 responses for each response option are needed for stable category measures. The response options for the EQ-5D-3L and the EQ-5D-5L both ranged from no problems to extreme problems, and we anticipated that the frequency distribution would gradually decrease.
Second, average category measures were calculated for each response option. These measures should advance [Citation25], thus indicating that persons experiencing lower levels of problems generate low measures but high levels of HRQoL, likewise higher measures represent persons experiencing higher levels of problems that correspond to lower HRQoL. Similarly, the person-item map showed that items at the higher end of the scale targeted persons with less back and neck pain, and items at the lower end targeted persons with more back and neck pain. Along with the average measure, the threshold calibrations were also evaluated through examination of the step calibrations in the probability characteristic curves. The threshold calibrations should advance with the scale categories by at least 1.0 logit [Citation31]. Disordered thresholds can appear when a category in the response scale has low frequency counts, is underused, or if the number of categories exceeds the distinguished levels of problem [Citation32].
To determine if the items in the EQ-5D-3L and the EQ-5D-5L form one unidimensional construct and thereby measure one latent variable – in this case, HRQoL – the internal validity of the scale was examined by looking for misfitting items using a combined consideration of both the MnSq and z goodness-of-fit statistics [Citation33]. It was anticipated that 95% of the items would reach the recommended values for infit and outfit MnSq and standardised z-values. Recommended values for acceptable goodness-of-fit are MnSq 0.6–1.4 logits and z < 2.0 logits [Citation25,Citation30,Citation34]. According to Linacre [Citation32], MnSq > 2.0 logits and z > 2.0 logits are more misleading than informative and therefore threaten the internal validity of the scale. In this step, we also performed a PCA to evaluate the unidimensionality of the residuals [Citation35]. It was anticipated that the proportion of variance explained by the Rasch dimension would be ≥50% and that the proportion of unexplained variance by the first contrast would be <5%.
Last, the aspects of reliability for both persons and items were analysed using the person and item separation index. The separation index for persons indicates how well targeted the items are to the sample taking the test, thus demonstrating a hierarchy of ability. A high person reliability means that some items are more difficult and some are easier. The Rasch reliability coefficient is equivalent to Cronbach’s alpha [Citation25]. In order to obtain the desired reliability coefficient of 0.80 or more, the separation index should be at least 2.0 [Citation36]. A separation index of 2.0 is preferred because it indicates that persons can be separated into at least three groups and that items can be separated into at least three levels of ability. Correlation coefficients between 0.70 and 0.90 are considered to be high estimates of reliability [Citation37], and the limit for acceptable reliability in this study would need to be at least 0.70. The results of the EQ-5D-3L and the EQ-5D-5L are rarely if ever used in isolation from other available information and are interpreted in collaboration with other professionals. We anticipated that items in the EQ-5D would be well distributed so as to target all persons regardless of level of problems for this population of persons with back and neck pain [Citation25].
Results
The sample of this study consisted of 164 persons represented by two independent groups (Group 3L and Group 5L) depending on when data were collected and which version of the EQ-5D was used (). The majority of participants were women, and back pain was more common than neck pain in both groups.
The response frequency showed more than 10 ratings for all response options in the EQ-5D-3L and for four out of five response options in the EQ-5D-5L. The fifth response option, extreme problems, was never used by any person in the sample. The analysis of the response structure showed that there was no disordering of the categories in the scale. Both the average category measures and the threshold structures increased for both the EQ-5D-3L and the EQ-5D-5L. The infit and outfit MnSq were within acceptable limits, with a MnSq <2.0 logits for both the EQ-5D-3L and the EQ-5D-5L (see ).
Table 2. Category structure based on all persons who took EQ-5D-3L and EQ-5D-5LTable Footnote*.
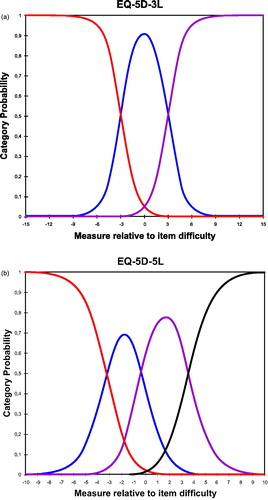
The probability curves for both the EQ-5D-3L and the EQ-5D-5L showed the categories’ location parameters and thresholds describing the points of intersection (see ). Thresholds were ordered with increasing values of at least 1.4 logits indicating that each step defined a distinct position for each category (see and ). However, there was a gap of >5.0 logits between threshold one and threshold two for the EQ-5D-3L, indicating that more categories are probably needed.
Figure 1. (a) Visual description of the category probability curves of the EQ-5D-3L rating scale. (b) Visual description of the category probability curves of the EQ-5D-5L rating scale.
Items in both the EQ-5D-3L and the EQ-5D-5L showed acceptable goodness-of-fit to the Rasch rating scale model. The EQ-5D-3L showed infit MnSq ranging from 0.71 to 1.38 logits and outfit MnSq ranging from 0.21 to 1.10 logits. The one item showing outfit MnSq of 0.21 logits was outside the recommended interval, but, considered together with a z < 2.0, an acceptable goodness-of-fit to the Rasch model was assumed. Items in the EQ-5D-5L showed infit MnSq ranging from 0.73 to 1.33 logits and outfit MnSq ranging from 0.78 to 1.15 logits indicating that the items define a single unidimensional construct.
Persons in both Group 3L and Group 5L showed acceptable goodness-of-fit, indicating acceptable person response validity for Group 3L with infit MnSq of 0.10–3.24 and z-values of 0.7–1.7 and outfit MnSq of 0.05–3.83 and z-values −0.9 to 1.9 and for Group 5L with infit MnSq 0.17–2.32 and z-values −1.8 to 1.8 and outfit MnSq 0.08–2.97 and z-values –1.8 to 1.7.
The item separation index for the EQ-5D-3L was 9.30 with an associated reliability coefficient of 0.99, and the item separation index for the EQ-5D-5L was 6.95 with an associated reliability coefficient of 0.98.
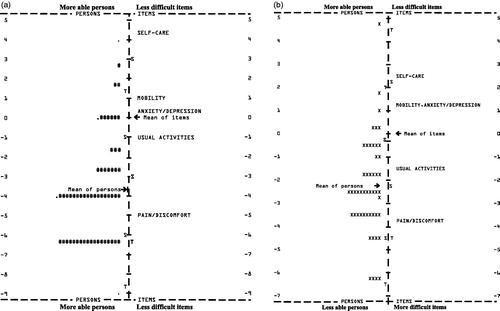
The hierarchical ordering of item difficulties appeared to be logical in both the EQ-5D-3L and the EQ-5D-5L, but, as shown in , 32 participants (28%) in the EQ-5D-3L were off target at the lower end of the continuum and there were no items matching their perceived level of problems. For the EQ-5D-5L, there were nine participants (18%) at the higher end of the continua with no items matching their level of problems (). Eight of those nine participants estimated a high level of HRQoL, and the other participant estimated a low HRQoL, thus none of the items targeted their abilities.
Figure 2. (a) Item-person map indicating the targeting of the persons to the items in EQ-5D-3L. Each “#” is 2 persons and each “.” is 1 person. (b) Item-person map indicating the targeting of the persons to the items in EQ-5D-5L. Each “X” is 1 person.
When measuring reliability, the analysis revealed that the person separation index for the EQ-5D-3L was 1.17 with an associated reliability coefficient of 0.58, indicating the inability to separate the sample into different levels of HRQoL. The person separation index for the EQ-5D-5L was 1.67 with an associated reliability coefficient of 0.74 indicating that the sample could be separated into at least two levels of HRQoL .
Table 3. Summary of results.
The final step was to perform a PCA for the EQ-5D-3L and the EQ-5D-5L. The Rasch dimension explained 70.6% of the variance in the data for the EQ-5D-3L, and the largest secondary dimension explained 9.2% of the variance. The variance explained by the items was 40.1%, which was almost five times the variance explained by the first contrast (9.2%), thus there was a noticeable secondary dimension in the items. The eigenvalue of the first contrast was 1.5, which indicated that it had the strength of about two items (1.5 rounded to 2, out of 5) (see ()). The PCA for the EQ-5D-5L showed that the Rasch dimension explained 72.4% of the variance and that the largest secondary dimension explained 9.0% of the variance. The variance explained by the items was 42.9%, which was almost five times the variance explained by the first contrast (9.0%), thus there was a noticeable secondary dimension in the items. The eigenvalue of the first contrast was 1.6, which indicated that it had the strength of about two items (1.6 rounded to 2, out of 5) (see ()).
Discussion
The purpose of this study was to use Rasch analysis to measure the psychometric properties of the two versions of the EQ-5D. The EQ-5D-5L showed good psychometric properties [Citation31], and the items in both the EQ-5D-5L and the EQ-5D-3L showed acceptable goodness-of-fit, which indicated unidimensionality for HRQoL [Citation33]. All test persons fit the model, but the person separation reliability and person separation index were only barely acceptable for the EQ-5D-5L separating two levels of discomfort while the EQ-5D-3L only separated one level.
For the EQ-5D-5L there were no responses for the fifth category of extreme problems, but this did not affect the analysis. According to Linacre [Citation31], there are strategies to use when categories are not observed in a dataset, including renumbering the categories. This was not necessary here because it was the last category that was not observed. The last category of extreme problems means that the person is unable to do things or has extreme levels of discomfort, and the group of test persons with pain in the back and neck in this study did not have that level of discomfort and were not affected to such a degree in terms of HRQoL. Another aspect that confirms this is that the average measure decreased for each category, and even the fourth category was used less than the other three. The probability curves for the EQ-5D-5L showed that the thresholds were within recommendations, unlike the EQ-5D-3L, and this indicated that the four categories were sufficient for this target group. Similar results by Craig et al. [Citation38] showed that categories four and five are hard to separate.
The fit statistics indicate that the items are unidimensional, which means that HRQoL is the latent variable, a construct. In Rasch analysis, the goodness-of-fit is not enough for assessing the unidimensionality, thus PCA is an additional requirement [Citation25]. A PCA analyses of the residuals accounts for the difference between the expected result of the Rasch analysis and the actual result of the collected data and is a control analysis to determine if there are underlying variables, additional dimensions in the test [Citation25]. The smallest amount that could be considered a “dimension” is an eigenvalue of 2. Thus, the eigenvalue size of unexplained variance explained by the first contrast for both the EQ-5D-3L and the EQ-5D-5L was <2 (eigenvalue sizes of 1.5 and 1.6, respectively), indicating that the unexpected variance was of an expected size. To get reliable results from a PCA, it is recommended to have data for at least 100 test persons [Citation35], but as few as 20 persons for a PCA of individual items can still give useful findings. Thus, we recommend further studies of the EQ-5D-5L with a larger study sample [Citation39].
A weakness with the results is that the person separation reliability and the person separation index were low for the test persons taking the EQ-5D-3L but acceptable for the test persons taking the EQ-5D-5L, indicating adding more test persons would not change that [Citation25]. If the size of the study group had affected the reliability, this would most likely have been seen in this study because Group 3L had 114 test persons and Group 5L just had 50. The person separation reliability did, however, increase for the EQ-5D-5L compared to the EQ-5D-3L, which might have been the result of the change from a three-degree to a five-degree rating scale. Such an increase, in the person separation reliability was also seen in the study by Pickard et al. [Citation24]. According to Linacre, a low value for the person separation index and person separation reliability is an indication that the assessment instrument needs more items [Citation40]. The EQ-5D-5L currently contains five items that measure HRQoL, and if more items were to be added, the person separation index would likely increase. This would mean that by adding items the EQ-5D-5L should be able to catch more levels of discomfort and thereby provide better precision in evaluations and investigations for this patient group.
An encouraging result from this study is that none of the test persons had floor or ceiling effects through the answers they selected, despite the fact that the Rasch analysis did not cover all of the test persons (). A strength with Rasch analysis is the possibility to visualise the opportunity for the instrument to capture the test persons rather than just calculating the ceiling and floor effects. Unfortunately, that meant that neither the EQ-5D-3L nor the EQ-5D-5L have optimal items for capturing the persons for whom back and neck pain have only a mild impact on their HRQoL. Still, the EQ-5D is a generic assessment instrument and thus it should be understood that all levels of discomfort and symptoms are not completely captured suggesting professionals to combine EQ-5D with other assessments or methods. However, the Rasch analysis of this study made it possible to analyse more aspects of the EQ-5D, and it was possible to both show the improved characteristics of the rating scale and to investigate the test persons. Thus, future Rasch analysis would benefit the investigation of what item or items would be most suitable to add in development of the EQ-5D.
A limitation of this study was the unequal sample size, where EQ-5D-5L was answered by 50 persons while 114 persons answered EQ-5D-3L. Thus, the sample was considered appropriate for performing Rasch analysis [Citation41]. Participant characteristics in both groups were similar, they had pain and discomfort in their back and neck and they did not report that their HRQoL was severely affected. Another limitation was that the two versions of EQ-5D were administered in different time periods and for group 3L the data were retrospective. This design does not severely impact the results or the conclusions of this study. However, we would recommend future research to be conducted on a common sample, aiming for at least 100 persons in each group. The population of persons with back and neck pain is common among the patients that physiotherapists meet daily in primary care [Citation42], In Sweden EQ-5D is also commonly used to measure the quality of care at private health care providers. Thus, it is important that the EQ-5D works as well as possible for all patients, even patients with back and neck pain. The advantage for the EQ-5D-5L in this study was that it separated more levels than the EQ-5D-3L, which indicates that the improvements and enhanced sensitivity in the EQ-5D-5L are useful to measure HRQoL for persons with back and neck pain. This result is in line with results of previous studies with other kinds of patients [Citation14,Citation43,Citation44].
In future research, it would also be interesting to study the rating scale more closely and to include patient groups with other more severe difficulties in order to determine if the five category rating scale are needed or if four are more optimal. Including other patient groups with larger sample sizes will also enable to investigate for differential item functioning and differential test functioning. An important clinical aspect is that the EQ-5D retains its properties of being easy to answer and to only require limited administration and rather, if needed, combine or supplement EQ-5D with other methods or assessment instruments that are more extensive.
Conclusions
The results indicate that compared to EQ-5D-3L the 5L version is more sensitive as there were a larger proportion of participants that were targeted to the items than in EQ-5D-3L. Back and neck pain is considered a less severe health state and earlier studies on EQ-5D have shown not to be sufficiently sensitive to detect changes, however, the sample in EQ-5D-5L could be separated into at least two levels of HRQoL instead of one suggesting the 5L version to distinguish between high and low perceived levels of problems. However, further testing is needed. With EQ-5D-5L showing slightly better psychometric properties than the EQ-5D-3L, the results from this study suggest that the EQ-5D-5L should be the first option when HRQoL is to be evaluated with the EQ-5D for patients with back and neck pain.
Ethical approval
Ethical approval by the ethics committee of the Medical Faculty of Umeå University, Dnr 08-117M and 2014/297-32.
Disclosure statement
The authors report no declarations of interest. All authors have made substantial contributions to all different sections of the paper. All authors have been involved in drafting and the manuscript and taking active part in revising it critically for important intellectual content, and have given final approval of this version to be published. Each author have participated sufficiently in the work and are able to take public responsibility for the content; and have agreed to be accountable for all aspects of the work in ensuring that questions related to the accuracy or integrity of any part of the work are appropriately investigated and resolved. Before submitting the article all authors have agreed on the order in which their names are listed.
References
- Fejer R, Kyvik K, Hartvigsen J. The prevalence of neck pain in the world population: a systematic critical review of the literature. Eur Spine J. 2006;15:834–848.
- Wändell P, Carlsson AC, Wettermark B, et al. Most common diseases diagnosed in primary care in Stockholm, Sweden, in 2011. Fam Pract. 2013;30:506–513.
- Hoy DG, Protani M, De R, et al. The epidemiology of neck pain. Best Pract Res Clin Rheumatol. 2010;24:783–792.
- Hoy D, Brooks P, Blyth F, et al. The epidemiology of low back pain. Best Pract Res Clin Rheumatol. 2010;24:769–781.
- Ferrer-Pena R, Calvo-Lobo C, Aiguade R, et al. Which seems to be worst? Pain severity and quality of life between patients with lateral hip pain and low back pain. Pain Res Manag. 2018;2018:9156247.
- Corniola MV, Stienen MN, Joswig H, et al. Correlation of pain, functional impairment, and health-related quality of life with radiological grading scales of lumbar degenerative disc disease. Acta Neurochir. 2016;158:499–505.
- Karimi M, Brazier J. Health, health-related quality of life, and quality of life: what is the difference? Pharmacoeconomics. 2016;34:645–649.
- Brooks R. EuroQol: the current state of play. Health Policy. 1996;37:53–72.
- Rowen D, Zouraq IA, Chevrou-Severac H, et al. International regulations and recommendations for utility data for health technology assessment. Pharmacoeconomics. 2017;35:11–19.
- Burström K, Johannesson M, Diderichsen F. Health-related quality of life by disease and socio-economic group in the general population in Sweden. Health Policy. 2001;55:51–69.
- Hansson E, Hansson T. The cost-utility of lumbar disc herniation surgery. Eur Spine J. 2007;16:329–337.
- Coons SJ, Rao S, Keininger DL, et al. A comparative review of generic quality-of-life instruments. Pharmacoeconomics. 2000;17:13–35.
- Solberg TK, Olsen JA, Ingebrigtsen T, et al. Health-related quality of life assessment by the EuroQol-5D can provide cost-utility data in the field of low-back surgery. Eur Spine J. 2005;14:1000–1007.
- Janssen MF, Pickard AS, Golicki D, et al. Measurement properties of the EQ-5D-5L compared to the EQ-5D-3L across eight patient groups: a multi-country study. Qual Life Res. 2013;22:1717–1727.
- Sullivan PW, Lawrence WF, Ghushchyan VA. National catalog of preference-based scores for chronic conditions in the United States. Med Care. 2005;43:736–749.
- Herdman M, Gudex C, Lloyd A, et al. Development and preliminary testing of the new five-level version of EQ-5D (EQ-5D-5L). Qual Life Res. 2011;20:1727–1736.
- Kim SH, Kim HJ, Lee SI, et al. Comparing the psychometric properties of the EQ-5D-3L and EQ-5D-5L in cancer patients in Korea. Qual Life Res. 2012;21:1065–1073.
- Craig BM, Pickard AS, Lubetkin EI. Health problems are more common, but less severe when measured using newer EQ-5D versions. J Clin Epidemiol. 2014;67:93–99.
- Greene ME, Rader KA, Garellick G, et al. The EQ-5D-5L Improves on the EQ-5D-3L for health-related quality-of-life assessment in patients undergoing total hip arthroplasty. Clin Orthop Relat Res. 2015;473:3383–3390.
- Rencz F, Lakatos PL, Gulacsi L, et al. Validity of the EQ-5D-5L and EQ-5D-3L in patients with Crohn's disease. Qual Life Res. 2019;28:141–152.
- Poor AK, Rencz F, Brodszky V, et al. Measurement properties of the EQ-5D-5L compared to the EQ-5D-3L in psoriasis patients. Qual Life Res. 2017;26:3409–3419.
- Janssen MF, Birnie E, Haagsma JA, et al. Comparing the standard EQ-5D three-level system with a five-level version. Value Health. 2008;11:275–284.
- Pickard AS, De Leon MC, Kohlmann T, et al. Psychometric comparison of the standard EQ-5D to a 5 level version in cancer patients. Med Care. 2007;45:259–263.
- Pickard AS, Kohlmann T, Janssen MF, et al. Evaluating equivalency between response systems: application of the Rasch model to a 3-level and 5-level EQ-5D. Med Care. 2007;45:812–819.
- Bond TG, Fox CM. Applying the Rasch model: fundamental measurement in the human sciences. 2nd ed. Mahwah (NJ); London: Lawrence Erlbaum; 2007.
- Stenberg G, Lundquist A, Fjellman-Wiklund A, et al. Patterns of reported problems in women and men with back and neck pain: similarities and differences. J Rehabil Med. 2014;46:668–675.
- IBM Corp. IBM SPSS statistics for windows, version 23.0. Armonk (NY): IBM Corp. Released; 2015.
- Linacre JM. Winsteps® Rasch measurement computer program. Beaverton, Oregon: Winsteps.com; 2016.
- Wright B, Masters GN. Rating scale analysis. Chicago (IL): MESA Press; 1982.
- Wright B, Linarce J. Reasonable mean-square fit values. Rasch Meas Trans. 1994;8:370.
- Linacre JM. Optimizing rating scale category effectiveness. J Appl Meas. 2002;3:85–106.
- Andrich DA. Category ordering and their utility. Rasch Meas Trans. 1996;9:464–465.
- Linacre JM. What do infit and outfit. Mean-square and standardized mean? Rasch Meas Trans. 2002;16:878.
- Tennant A, Conaghan PG. The Rasch measurement model in rheumatology: what is it and why use it? When should it be applied, and what should one look for in a Rasch paper? Arthritis Rheum. 2007;57:1358–1362.
- Linacre JM. A user´s guide to Winsteps® Ministep Rasch-model computer programs. 1991–2006. [cited 2018 Nov 3]. Available from: https://archive.org/details/B-001-003-730/page/n1
- Fisher W. Reliability, separation, strata statistics. Rasch Meas Trans. 1992;6:238.
- Cohen R, Swerdlik M. Psychological testing and assessment. An introduction to tests and measurement. 7 ed. New York (NY): McGraw-Hill; 2010.
- Craig BM, Pickard AS, Rand-Hendriksen K. Do health preferences contradict ordering of EQ-5D labels? Qual Life Res. 2015;24:1759–1765.
- Arrindell W, van der Ende J. An empirical test of the utility of the observations-to-variables ratio in factor and components analysis. Appl Psychol Meas. 1985;9:165–178.
- Linacre M. Winsteps Rasch Tutorial 3. [Internet]. 2012. [cited 2018 Nov 3]. Available from: http://www.winsteps.com/a/winsteps-tutorial-3.pdf.
- Linarce J. Sample size and item calibration stability. Rasch Meas Trans. 1994;7:370.
- Stenberg G. Physiotherapy in Västerbotten county. a survey study. Umeå: Västerbotten County Council; 2006.
- Feng Y, Devlin N, Herdman M. Assessing the health of the general population in England: how do the three- and five-level versions of EQ-5D compare? Health Qual Life Outcomes. 2015;13:171.
- Buchholz I, Janssen MF, Kohlmann T, et al. A systematic review of studies comparing the measurement properties of the three-level and five-level versions of the EQ-5D. Pharmacoeconomics. 2018;36:645–661.