
 ?Mathematical formulae have been encoded as MathML and are displayed in this HTML version using MathJax in order to improve their display. Uncheck the box to turn MathJax off. This feature requires Javascript. Click on a formula to zoom.
Abstract
This paper presents an integrated framework for the optimal planning of public charging stations for plug-in electric vehicles (PEVs) in urban areas. The framework consists of two main components: (i) an out-of-home charging demand model based on an activity-based travel demand model, and (ii) a public charging station location-allocation model using a scenario-based stochastic programming (SP) approach. In order to capture the dynamic charging behaviour of PEV users, a chi-squared automatic interaction detector (CHAID)-based mixed effects decision tree is induced from multi-day activity diaries. Moreover, because the stochastic error of the micro-simulation approach brings about uncertainty, we adopted a two-stage stochastic mixed-integer programming (TSMIP) model, which measures uncertainty by means of a finite set of scenarios obtained from the derived decision rules underlying PEV charging. The proposed approach is demonstrated for the City of Eindhoven, The Netherlands, and benefits of the stochastic solution are discussed.
1. Introduction
Research on charging behaviour (Kim et al. Citation2017; Kuby Citation2019) suggests substantial heterogeneity in the charging demand of plug-in electric vehicle (PEV) users. Some people only charge at home, while others more frequently charge at public charging stations. Some people take every opportunity to recharge their vehicle, while others witness a more regular pattern of low frequency-high duration charging episodes. Ignoring the variables and constraints set by PEV users’ activity-travel patterns and heterogeneity in charging patterns will severely limit the ability of the model to predict charging demand. For these reasons, we argue that a model of the optimal location of charging stations should ideally be based on an activity-based model of travel demand linked to a module predicting the charging behaviour of PEV users. The activity-based approach seems particularly suitable to model PEV users’ charging patterns due to its ability to depict complex decision-making processes. However, although activity-based models have been significantly improved over the past decades, and have reached maturity, their cross-sectional nature limits their capability of simulating dynamics in behaviour. Cross-sectional models rely on a one-day activity-travel diary, which is problematic when modelling activity-travel patterns that are defined for time periods longer than a day (e.g. charging patterns). The growing interest in developing dynamic models of activity-travel behaviour (e.g. Arentze and Timmermans Citation2009; Cirillo and Axhausen Citation2010; Auld et al. Citation2011) and the increasing availability of multi-day, even multi-week activity-diary data, call for considering longitudinal effects.
Moreover, because most activity-based models use an agent-based micro-simulation approach, they introduce uncertainty stemming from heterogeneity among individuals and their inherent random error (Rasouli and Timmermans Citation2012). In facility location problems, such uncertainty is remedied by the introduction of a stochastic programming (SP) or a robust optimization (RO) approach (Snyder Citation2006; Correia and da Gama Citation2019). SP is relevant to use when the uncertainty can be described by any probabilistic information, while RO uses a robustness measure, such as minmax cost or minmax regret.
In a scenario-based SP, the random variables in question are represented by a set of scenarios, each of which specifies a full realization of a (set of) random variable(s) and a corresponding probability of occurrence. It is assumed that the stochastic process is realized according to a sequence of discrete decision stages. Owing to the two-stage nature of the facility location problem (i.e. location and allocation), two-stage SP is typically applied in practice. The idea is to make partial decisions on location in the first stage (here-and-now decision) and later to decide on a second-stage strategy on allocation (recourse decision) after the realization of uncertain situations. The objective is to minimize the cost (or maximize the profit) in the first stage in addition to the expected cost (or the expected profit) in the second stage. However, if there is a lack of information on the sources of uncertainty and their likelihood of occurrences, decision-makers may rely on poor approximations. In addition, the number of discrete realizations of uncertainty may be very large in a real-world problem. In a model formulation, a good balance between realism and solvability is needed because the quality of the approximation is directly related to the quality of outcomes. Thus, generating scenarios is an active research area in its own right (Di Domenica et al. Citation2007; Kaut and Wallace Citation2007). Previous studies on the charging station location problem using a scenario-based approach usually focused on costs, demand, travel times and other inputs to classical facility location models that may be highly uncertain. However, to the best of our knowledge, there have been no reports of inherent random error due to individual heterogeneity in charging demand.
In this paper, to fill the discussed gap in the literature, we present an integrated framework for the optimal planning of public charging stations for PEVs in urban areas. The framework consists of two main components: (i) an out-of-home charging demand model based on an activity-based travel demand model, and (ii) a public charging station location-allocation model using a scenario-based SP approach. For the first component, we use a fully operational activity-based travel demand model system, named Albatross (Arentze and Timmermans Citation2004, Citation2005; Rasouli, Kim, and Yang Citation2018). Albatross generates and schedules activity episodes using probabilistic decision rules for 27 sequential decision steps. The rules are extracted from activity-travel diary data using a chi-squared automatic interaction detector (CHAID)-based induction method. Recently, the original approach based on cross-sectional data has been replaced with a CHAID-based mixed effects decision tree that accounts for the longitudinal structure of multi-day data (Kim et al. Citation2018) to explain dynamic aspects of charging behaviour, coined dynamic decision tree in this paper. The dynamic decision tree is estimated using multi-day activity diary data of PEV users, and is added as the last decision step, once all other activities have been simulated. The estimated charging demand is used as input for the second component.
The use of the dynamic decision tree in a micro-simulation context may, however, cause an immediate problem. The uncertainty stems from the probabilistic decision rules underlying heterogeneous PEV charging demand present in the form of random (non-systematic) errors in the leaf nodes in the dynamic decision tree. The optimal solution for a deterministic version of the model may be suboptimal in the presence of the uncertainty. In order to address the uncertainty, for the second component, we propose a two-stage stochastic mixed-integer programming (TSMIP) model. The uncertainty is modelled by a finite number of scenarios from the leaf nodes, and the occurrence probability of scenarios is calculated from the simulated daily activity-travel patterns of PEV users.
The remainder of this paper is organized as follows. In Section 2, we present related work on the PEV charging station location-allocation and demand forecasting methods. In Section 3, the dynamic decision tree is extracted to estimate out-of-home charging demand. The validation of this model is also discussed in this section. In Section 4, the proposed TSMIP is formulated. Section 5 demonstrates the application of the TSMIP for the city of Eindhoven, the Netherlands. The case study design, model input, generated scenarios, and the results of the optimal PEV charging stations locations are presented. Section 6 concludes the paper with a discussion of the main contributions of this study and a reflection on the limitations of the suggested approach.
2. Related work
2.1. Charging/refuelling station location-allocation
Existing studies about the PEV, or alternative fuel vehicle (AFV), charging/refuelling station location-allocation problem can be broadly classified on the basis of their representation of charging demand. First, the node-based (or point-based) approach finds the optimal location of a set of facilities and allocates demand to those facilities given the assumption that demand occurs at a set of nodes and that a special-purpose trip is made between the demand node and the facility. Examples are the p-median algorithm, which minimizes the average demand-facility distance to locate p facilities (Ghamami, Nie, and Zockaie Citation2016), the maximal covering model, which seeks to maximize the amount of demand covered by a specified number of facilities (Frade et al. Citation2011; Giménez-gaydou et al. Citation2016; Ko et al. Citation2017), and other mixed-integer programming solutions (Chen, Kockelman, and Khan Citation2013; Brandstätter, Kahr, and Leitner Citation2017; Faridimehr, Venkatachalam, and Chinnam Citation2018). The node-based location-allocation requires predictions of charging demand at nodes. Frade et al. (Citation2011) and Chen, Kockelman, and Khan (Citation2013) used regression analysis to estimate charging demand for each census block in the study area, represented as a node. Ghamami, Nie, and Zockaie (Citation2016), Giménez-gaydou et al. (Citation2016), Brandstätter, Kahr, and Leitner (Citation2017), and Faridimehr, Venkatachalam, and Chinnam (Citation2018) estimated charging demand based on PEV adoption rates.
Second, the flow-based approach, though its structural similarity to the node-based maximal covering location problem, poses that demand occurs along the paths between nodes. This approach is based on a flow-capturing model which locates a specified number of facilities to capture the maximum demand (flow) (Hodgson Citation1990; Berman, Larson, and Fouska Citation1992). Kuby and Lim (Citation2005) proposed a flow-refuelling location model which maximizes the total vehicle flows refuelled under the constraints imposed by the driving range of an AFV. The model can handle the situation where multiple refuelings are needed to travel a given path if the driving range is less than the path length. Thus, it is a more suitable approach for locating charging facilities along nation-wide highways to account for inter-regional travel, when the remaining battery status must be considered. Soon the flow-refuelling model had many variants and relevant extensions to accommodate different needs of the applications, including a capacitated (Upchurch, Kuby, and Lim Citation2009), multi-period (Chung and Kwon Citation2015; Zhang, Kang, and Kwon Citation2017), network equilibrium (He, Yin, and Lawphongpanich Citation2014), stochastic user equilibrium (Riemann, Wang, and Busch Citation2015) and stochastic (uncertain demand) version (Wu and Sioshansi Citation2017; Yıldız, Olcaytu, and Şen Citation2019). Wang and Wang (Citation2010) proposed an integrated model, combining the node-based and flow-based approach for locating refuelling stations along provincial highways for inter-city travel and along city roads for intra-city travel, respectively, for AFV with a limited driving range. Most flow-based approaches assign OD flow demand to the shortest path.
2.2. Charging station location problem under uncertain demand
Recognizing the presence of uncertainty in decision-making, stochastic variants of the facility location problem have been widely studied in the literature. In this section, we review the literature on the charging station location problem with a two-stage SP approach. The goal of the two-stage SP approach for facility location is to find an optimal solution minimizing the expected cost (or maximizing the expected profit) of the system that is feasible for (almost) all possible realizations of the randomness. The source of the randomness has usually included demand, supply cost, price (of commodity), travel time, location of customers, and behaviour of customers. In SP, it is assumed that such randomness is known to the decision-maker with probabilistic information.Footnote1
The scenario-based SP for the charging station location problem has recently emerged. It is assumed that the uncertain demand is characterized by a number of scenarios, where each scenario represents a specific hypothetical situation with a given chance of occurrence. Based on the node-based approach, Ghamami, Nie, and Zockaie (Citation2016) assumed that charging demand at nodes depends on three different levels of the PEV’s market penetration ratio. Faridimehr, Venkatachalam, and Chinnam (Citation2018) constructed a large number of scenarios to describe type of vehicles (battery electric vehicle, plug-in hybrid vehicle or ICEV), PEV users’ charging preferences, dwell durations, battery’s state-of-charge (SOC) and arrival time, based on the assumption that these attributes follow certain parametric distributions. For locating charging stations of an electric car-sharing system, Brandstätter, Kahr, and Leitner (Citation2017) formulated seven scenarios representing fluctuation in demand by day of the week based on taxi trip data, given the assumption that a taxi trip can be substituted by a car-sharing service. Each scenario is given as a set of estimated trips, which contains information about origins, destinations, start times and end times. Çalık and Fortz (Citation2019) estimated stochastic car sharing service demand from a probability distribution, also based on taxi trip data. They tested various number of scenarios ranging from 100 to 500 and developed a Benders decomposition algorithm to solve the problem, in which each scenario represents a certain number of individual customer requests and each request is associated with an origin node, a destination node, and a start time. An (Citation2020) proposed a two-stage SP approach for battery electric bus charging station location and bust fleet size under random charging demand. A normal distribution is used to generate 50 scenarios describing the charging demand fluctuation incurred by the weather and traffic conditions. The SP is approximated by a sample approximation method and is solved by a Lagrangian relaxation approach. Similarly, in An, Jing, and Kim (Citation2020), 50 scenarios are generated from lognormal distribution to represent the random demand in designing battery-swapping facility for electric buses.
Based on the flow-based approach, Wu and Sioshansi (Citation2017) generated numerous PEV-flow scenarios by bootstrapping from non-PEV tour data with the assumed penetration rate of PEVs being uniformly distributed among the vehicles in the data. The data was provided by a tour-based travel demand model, Mid-Ohio Regional Planning Commission (MORPC). In their case study, an exponential number of PEV flow scenarios lead to an intractable model. Therefore, a sample-average approximation method was introduced which reduces the number of scenarios based on random sampling. Yıldız, Olcaytu, and Şen (Citation2019) modelled annual charging demand, in which each scenario represents daily PEV flows. All scenarios considered were summed to 1461 (from 2013 to 2016). Scaling factors were used to define the proportion of PEV flows from taxi trip data.
2.3. Our approach and contribution
From the perspective of identifying error and uncertainty in modelling and computational simulation, two types of uncertainty exist: inherent (or irreducible, aleatory, stochastic) uncertainty and epistemic (or reducible, subjective, model form) uncertainty (Der Kiureghian and Ditlevsen Citation2009). Inherent uncertainty consists of random fluctuations that are intrinsic to the problem being studied (e.g. taste heterogeneity); this type of uncertainty is irreducible and is usually characterized with a given probabilistic information. Epistemic uncertainty results from a lack of knowledge of fundamental phenomena (e.g. choice behaviour); this type of uncertainty can be reduced when the relevant knowledge becomes available through further study or measurement.
Charging demand uncertainty is made up of both inherent uncertainty, due to pure randomness, and epistemic uncertainty, due to lack of information or knowledge about charging behaviour. Both kinds of uncertainties are explicitly addressed in this paper. To cope with epistemic uncertainty, charging behaviour is modelled based on a rule-based approach, where charging activities are predicted using decision rules derived by CHAID-based decision tree induction. The inherent uncertainty is the focus of this paper. This paper deals with the public charging station location allocation problem in urban areas under uncertain charging demand caused from heterogeneous decision rules and their probabilistic properties in a decision tree. The inherent uncertainty is to be considered by the use of SP.
A two-stage stochastic mixed-integer programming (TSMIP) is proposed in this paper. We argue that PEV charging at public charging stations (Level-2)Footnote2 in an urban area does not strictly rely on the remaining driving range but relates to the utilities constrained by the activity schedule and environment as well as the battery constraint. More specifically, our objective is to find the optimal location and the number of the charging stations such as to minimize total access cost, while satisfying PEV users’ charging demand as much as possible, among the candidate locations with limited capacity, within a given budget constraint. The charging demand is estimated on the basis of PEV users’ multi-day activity-travel patterns. It is assumed that charging demand only occurs at the activity location. From a modelling perspective, this study belongs to a class of node-based and capacitated facility location problems with stochastic demand, which results in a TSMIP formulation which will be introduced in Section 4.1.
The purpose and method of scenario construction of the current study differ from the previous studies based on the SP approach for solving the charging station location problem. In the prior studies, scenarios were applied to describe uncertain charging demand (or PEV flows) in terms of seasonal, daily, and time-of-day fluctuation, generated on the basis of arbitrary assumptions or proxy data (e.g. taxi trip data, ICEV tour data). Moreover, the types of uncertainty are mixed and cannot be disentangled. In this study, scenarios are constructed to capture the inherent uncertainty associated with heterogeneity among individuals in their charging behaviour, based on a powerful activity travel demand forecasting model. This empowers one to assess the impact of external and internal stimulates on the changes of charging behaviour and therefore the demand. If facility location is advised based on observed data (current situation), there is no guarantee that the future (for which the additional charging stations is planned) entails similar demand pattern. That is the main shortcoming of all previously conducted studies. An explicit model (dynamic decision tree) for predicting PEV charging demand is developed, and the scenarios for SP are derived from the estimated model results. Thus, the decision tree describing charging behaviour is linked to the latest version of a large-scale, state of the art activity-based model of travel demand, which mimics the decision heuristics that people apply when scheduling their activities and associated travel on a day-by-day basis, rather than on arbitrary assumptions or proxy data. Then, the simulated values and probabilities of the random variables are used as input to a two-stage SP model to determine the optimal number and locations of charging stations. The details of the scenario generation method will be described in Section 4.2.
3. Out-of-home charging demand forecasting
Predicting charging demand is an essential part of the PEV charging station location-allocation problem. Since charging behaviour itself is a complex process constrained by driving range, daily activity agenda, the layout of charging infrastructure, etc., it may not be appropriate to assume that refuelling behaviour of ICEV users is equal to the recharging behaviour of PEV users. Not using an activity-based model of activity-travel and charging behaviour is even more crude and at some stage becomes irrelevant and invalid.
In this study, out-of-home charging demand is estimated in conjunction with Albatross, an activity-based travel demand forecasting model (Arentze and Timmermans Citation2004; Rasouli, Kim, and Yang Citation2018). Albatross is a fully operational computational process model based on the decision tree formalism. It starts with an empty schedule and sequentially generates and schedules activities and simulates the associated travel patterns.
3.1. Dynamic decision tree
Albatross consists of 27 decision trees to predict which activities are conducted when, where, for how long, with whom, and the transport mode involved, eventually simulating a household’s activity-travel schedule on a daily basis. The decision trees consist of a series of nodes (root, internal and leaf nodes) and branches specifying the condition states and personal profile of individual i that lead to the choice of j. The CHAID algorithm in Albatross grows a decision tree by finding the optimal split determined by the chi-squared test, starting at a root node until ending at leaf nodes. A branch (path from the root to a leaf node) corresponds to a decision rule, where internal nodes in between represent the associated condition attributes. Each leaf node defines a partition of the data, where the choice probability distribution is obtained by calculating the relative frequency distribution of choices in the partition. When deriving decisions from decision trees, a probabilistic action-assignment rule is used instead of a deterministic assignment rule (or a plurality rule) in order to reproduce non-systematic variance at leaf nodes in predictions.
Once Albatross produces a daily activity schedule with ordinary activities (e.g. home, work, shopping), a decision tree is added to determine whether or not a charging activity is added to each activity episode so that the dynamic charging behaviour of PEV users is taken into consideration (e.g. delaying charging under a high SOC). The duration of the charging activity is then determined by stay time at the corresponding activity location recognizing that PEV charging is a process simultaneously occurring with another activity. It is to be noted that PEV charging can also be a separate process but mostly for fast charging which takes less than 30 min for a full charge. In this study, we only consider the simultaneously occurring process of charging since our interest is to estimate the demand at public charging stations equipped with Level 2 charging.
Whereas other decision trees are based on one day observations, given the heterogeneous nature of charging behaviour in terms of timing, duration, and regularity (i.e. random vs regular) (Kim et al. Citation2017), multi-day activity diary data were used to derive a dynamic version of the CHAID-based decision tree representing decision rules for out-of-home charging. The dynamic decision tree allows accounting for between-individual variances (random effects) and within-individual variances (autocorrelations) underlying repeated measurements. It is constructed using an iterative estimation procedure between CHAID-based probabilistic tree induction and Bayesian generalized linear mixture modelling (GLMM). For longitudinal (clustered) data with a multinomial response, pairing each response category with a baseline category, J – 1 non-redundant logits can be written as follows (Kim et al. Citation2018).
(1)
(1) where
is the linear predictor of alternative
in choice situation
faced by individual
,
is the response probability,
is a complete set of derived decision rules satisfying given observed attributes
,
denotes the choice made at
previous state by individual
associated with current choice
, and
is the effect of the past choice
time period ago on the current choice. We postulate a first-order autoregressive (AR-1) process, which is the most common form of autocorrelation (i.e. k = 1).
is the individual-specific random intercept, which is normally distributed within individuals and choice alternatives with zero mean and variance
.
Then, the probability of choosing alternative j by an individual i at choice situation t can be obtained using the estimated linear predictor , as follows.
(2)
(2)
(3)
(3)
In the current study, the concern is whether or not the individuals charge their PEV(s) during the corresponding out-of-home activity episodes. Therefore, Equations (1)–(3) are reduced to the binary case. Recently, Speiser et al. (Citation2019, Citation2020) proposed a similar approach, but combined classification and regression trees (CART) and Bayesian GLMM.
3.2. Data used
We used multi-day activity diary data which covered out-of-home charging activities of PEV users as well as other daily activities such as work, shopping, leisure, etc. Besides the activity diary data, sociodemographic characteristics of PEV users and urban environment characteristics describing their residential settings were included. The data was used to train the dynamic decision tree and as input to the Albatross model system predicting activity-travel patterns of PEV users.
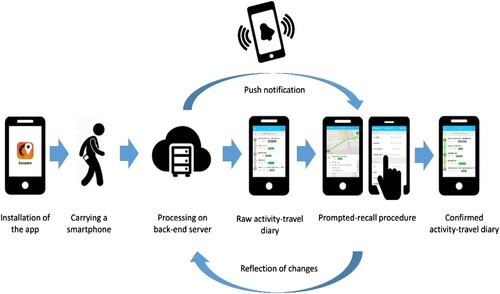
A smartphone-based prompted-recall survey was used to collect these data. An overview of the survey is illustrated in Figure . The survey process consists of several steps. First, respondents were asked to download and install the Sesamo app (Mobidot B.V. Citation2017). Second, the app traced the respondents. Basic travel attributes, such as travel time, activity duration, origin/destination location, and travel speed, were detected and recorded using available sensors in the smartphone (GPS, Wi-Fi, Accelerometer, and GSM cell ID information). Third, the collected basic data were then uploaded (automatically at each trip end) to a database on a back-end server to enhance the quality of the data by means of data cleaning, map-matching and transportation mode/travel purpose imputation (Thomas et al. Citation2018). Outliers in the raw data were cleaned and the missing traces at the trip start were imputed. Fourth, transportation mode and travel purpose imputation may have resulted in bias possibly due to both the failure of sensors and the imperfect nature of the applied learning algorithms. Therefore, respondents were asked to check and confirm whether the generated activity-travel diary was correct or not. In order to remind respondents to check the generated diary and correct them, a push notification was sent on a daily basis. More precisely, the following statement ‘We kindly ask you to make your travel diary “Green”!’ appeared on respondents’ mobile phone screen once every 24 h. In addition, to guarantee that charging activities were all fully reported, the following question was posed to respondents when their smartphone app detected their car was parked (detected by the transition of travel mode from car to walk); ‘Did you plug in your EV when you arrived at {TripArrivalTime} on {TripDestinationPlace}?’. Respondents had the following answer categories: (1) ‘Yes, I charged my PEV at a private charging station’, (2) ‘Yes, I charged my PEV at a semi-public charging station’, (3) ‘Yes, I charged my PEV at a public charging station’, (4) ‘Yes, I charged my PEV at a fast charging station’, (5) No, I did not charge my PEV. If a respondent answered that he/she charged their PEV, the following question was sent; ‘Can you estimate how full your battery was at {TripArrivalTime} on {TripDestinationPlace}?’. Possible answer options were: (1) High (66–100%), (2) Medium (33–66%), (3) Low (0–33%).
Figure 1. Overview of the survey process.
The survey was administered among 100 PEV users, who provided their activity-travel data for a period of 3 months (from 27 January to 28 April 2017) in the Netherlands, which resulted in observations pertaining to 4438 person-days and 23,998 person-trips after data cleaning (see Kim et al. [Citation2018] for more details). Table provides the list of variables used for training the dynamic decision tree. Four broad sets of variables were considered, which constitutes the attributes : Individual and household characteristics, urban environment characteristics, activity-schedule related characteristics, and charging related characteristics.
Table 1. Variables specifications for out-of-home charging decision tree.
Individual and household characteristics consist of a dummy variable for gender and ordinal categorical variables for age, work hours per week, number of cars in the household. Urban environment characteristics include several spatial accessibility measures which describe the availability of opportunities as moderated by the distance from home. The activity diary data were fused with the physical environment data provided by national databases, which includes sector-specific employment and population data. Attributes of the spatial settings of the home address were considered to account for the opportunities and constraints set by the environment for the concerned individuals. Activity schedule related characteristics reflect attributes of the activity under consideration and of before and after activities. Travel time to activity location, transport mode used, activity duration, and start time of the activity are considered. Charging related characteristics include PEV type, state-of-charge level, walking distance from the activity location to the nearest charging station, and the number of charging stations within a certain distance from the activity location. The threshold distance was set to 3.1 km given the spatial distribution of existing charging stations, which is consistent with the proximity scale used for the urban environment characteristics. The dependent variable is whether out-of-home charging took place or not. Out of 8249 out-of-home charging cases collected, 75% was used for training, while the remaining 25% was used for model validation.
3.3. Model estimation
The dynamic decision tree for charging activity was trained using the above-mentioned data, which included 6187 cases. Table provides the derived decision tree, which has 19 internal nodes and 31 leaf nodes. As expected, out-of-home charging activity is mostly governed by SOC, and therefore the first split was made on SOC. Obviously, the lower the SOC, the higher the charging rate (Nodes 3–20 in Table ). However, there are several conditions under which the probability of charging varies when SOC is high (SOC = 2). The last three columns of the table show leaf node information, including the number of cases at each leaf node and probabilistic action states. The probabilistic action states are rather deterministic, which implies the method significantly reduces the impurity of the leaf nodes. A possible explanation is the reduction of between-individual and within-individual variance during the iterative estimation of random and fixed effects. This is evidenced by the out-of-home charging probability obtained for each iteration. Compared with the probability at the first iteration (Figure (a)), the probability at convergence is more robust and stable (Figure (b)). Moreover, during the iterations, the variance of the random intercept is reduced from 3.421 with the 95% highest posterior density (HPD) interval [2.079, 4.759] at the first iteration to 0.276 with the 95% HPD interval [0.137, 0.418] at convergence, suggesting that the variance at the between-individual level is explained.
Figure 2. The relationship between the predicted probability and the linear predictor (a) at the first iteration and (b) at convergence.
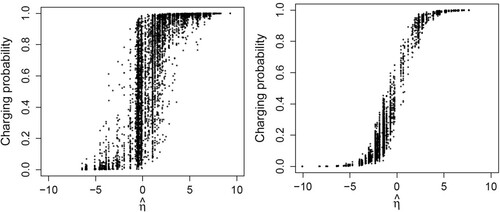
Table 2. Estimated out-of-home charging decision tree in table format.
3.4. Model validation
The estimated decision tree was tested on the 25% holdout sample (N = 2062) by comparing the observed and predicted charging incidence rates for each case. For predicting observations of out-of-sample individuals, there is no basis for estimating the random intercept and the autocorrelation parameter
. Thus, these parameters were set to their expected value of zero, yielding the value
. Table presents the confusion matrix for the training and validation set. Each cell in this matrix represents the relative frequency of the predicted class (absolute numbers are in parentheses). The marginals of the matrix show the frequency distributions across choice alternatives as observed (column) and as predicted (row). It is to be noted that, for the training set, the overall predicted distribution is equal to the overall observed distribution because the probabilistic assignment rule is used. That is to say, the predictions are based on the probabilities derived from the frequencies of partitioned cases at each leaf node. The diagonal entries represent the probability of hits (i.e. true negative rate and true positive rate, also called specificity and sensitivity), while the off-diagonal entries indicate the probability of misclassification (i.e. false negative rate and false positive rate). Comparing the training and test set shows only marginal decreases in the hit probabilities, which indicates that the model is transferable to the test set.
Table 3. Confusion matrix.
4. Two-stage stochastic mixed-integer programming
In this section, we formulate a TSMIP model for locating public charging stations. The nature of the stochastic facility location problem can be demonstrated in the following two-stage procedures: (1) choosing facility location and size before the uncertain demand is realized, and (2) assigning the demand to facilities after the uncertainty has been revealed. In the proposed model, the objective of TSMIP in the first-stage is to find the location of charging stations and their sizes such that the expected generalized cost of the second-stage decisions (recourse decisions) is minimized. In other words, the first-stage decisions are made based on the expected value of the second-stage variables that are acquired from a set of scenarios describing the uncertainty (Birge and Louveaux Citation2011). The uncertainty is assumed to lie in the probabilistic decision rules in out-of-home charging decisions. Moreover, facilities with different capacities can be allocated to any potential location, and the demand can be satisfied by facilities at multiple locations.
4.1. Problem statement and model formulation
The formal definition of the TSMIP is based on the following settings and assumptions.
An out-of-home charging demand forecast is available for different scenarios representing heterogeneous decision rules for PEV charging. Decision rules are in fact ‘If-then’ conjunctive rules that can represent as a decision tree. Internal nodes in a decision tree correspond to the antecedents of a possible rule, which accounts for PEV user’s personal profile, spatial, temporal and contextual aspects of charging demand. Leaf nodes, or action states, are the consequent conditions, and the choice probability distribution is obtained by calculating the relative frequency distribution of choices at a leaf node. Each scenario is given as a single day of charging demand, which is a realization of each decision rule in a tree.
The occurrence probability of each scenario is known and obtained from the simulated daily activity-travel pattern of PEV users.
Charging station is a set of charging slots.
The candidate locations for charging stations have an individual maximum capacity subject to available parking space.
The number of charging slots at any existing charging station is known and fixed.
Daily capacity of a charging slot is assumed to exist.
There are no other costs (like maintenance costs) apart from the installation cost.
We define the following sets and indices, parameters and decision variables for the model: A unit vehicle-minutes is introduced to quantitatively describe charging demand and capacity of charging stations. It is calculated as the sum of the number of minutes of charging per PEV per demand point (or charging station).
Indices and sets
Table
Parameters
Table
First-stage decision variables
Table
Second-stage decision variables
Table
The TSMIP is formulated as follows.
First-stage model
(4)
(4) s.t.
(5)
(5)
(6)
(6)
Equations (4)–(6) represent the first-stage model regarding the number and locations of charging stations. The objective function (4) aims to minimize the expected (second-stage) cost representing , where
is the occurrence probability of scenario
, and
. The budget constraint (5) is introduced to consider the number of charging slots by setting total budget
. Constraint (6) sets the domain of the first-stage decision variables.
Second-stage model
(7)
(7) s.t.
(8)
(8)
(9)
(9)
(10)
(10)
(11)
(11)
(12)
(12)
(13)
(13)
Equations (7)–(13) belong to the second-stage model where recourse decisions are made to assign PEV users to charging stations. Objective function (7) minimizes access cost incurred by PEV charging at both existing and new stations for a realization . Unsatisfied charging demand,
, is penalized by the unitary penalty cost denoted by
to avoid infeasible solutions in the second stage, for some first-stage feasible solution, caused by the inclusion of capacity constraints (Constraint (8) and (9)) (Correia and da Gama Citation2019, 196). Constraint (8) guarantees the amount of served charging demand at new charging station may not exceed its capacity, while Constraint (9) considers the capacity constraint for the charging demand served at existing charging stations. Equation (10) guarantees that the sum of served and unserved demands equals total demand. Nonnegativity constraints of the second-stage decision variables are considered in Constraints (11)–(13).
4.2. Scenario generation
SP is a particularly suited approach to support decision-making under uncertainty if the uncertain parameter can be presented by some form of probability distribution. The usual way to address such probability distributions is to implement a finite set of scenarios that we denote by to approximate the distributions. Each scenario,
, is a realization of the uncertainty and occurs with some probability,
, which we assume to know. The scenario set
and the corresponding occurrence probabilities
are of critical importance in SP. However, generating scenarios is not a trivial task and determines the quality of the solution (Dupačová, Consigli, and Wallace Citation2000).
In previous studies solving the charging station location problem with the SP approach, scenarios were constructed to describe using multiple sources of information (e.g. historical data (Brandstätter, Kahr, and Leitner [Citation2017]; Wu and Sioshansi [Citation2017]), expert opinion (Seddig, Jochem, and Fichtner [Citation2019]), or their combination (Faridimehr, Venkatachalam, and Chinnam [Citation2018])). In our TSMIP, we utilize the dynamic decision tree to generate a set of charging demand scenarios so that each leaf node reflects probabilistic decision rules of heterogeneous charging behaviour. Thus, those scenarios are generated to take into account heterogeneity in charging decisions at the leaf node level. Scenarios can also be generated at the individual level of heterogeneity (i.e. taste heterogeneity). However, given that the dynamic decision tree is capturing unobserved heterogeneity among individuals and panel effects (as revealed in Figure ), we resorted to generate scenarios at the leaf-node level for an affordable number of scenarios.
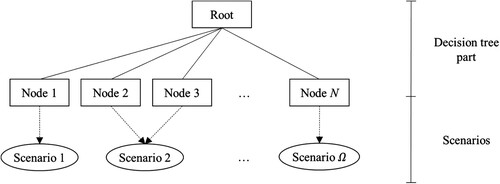
If scenarios are deterministic (i.e. when the charging probability of a scenario ,
, equals 0 or 1), they are merged into a single scenario, thus
is a proper subset of the power set of
, i.e.
. For example, as shown in Figure , scenario 2 consists of leaf node 2 and leaf node 3 if they have both a zero probability of charging (i.e.
).
Figure 3. Decision tree and scenarios.
The occurrence probability of each scenario, , is known since the chance of each leaf node is called can be obtained from the simulation (i.e. the proportion of instances belonging to each scenario among the total instances). The occurrence probability of the merged scenario is taken as the sum of the occurrence probability of each scenario before merging. Random charging demand can then be given an associated probability of scenario occurrence,
, using Equation (14), such that
.
(14)
(14) where
is the potential charging demand (i.e. parking demand in vehicle-minutes) at demand point
under scenario
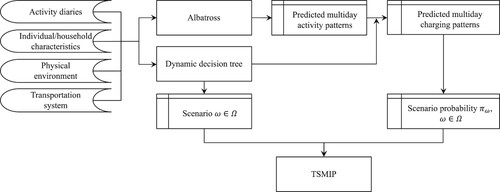
. The overall scenario generation process is schematically shown by Figure .
Figure 4. Scenario generation process.
4.3. Value of the stochastic solution (VSS)
One way to evaluate the value of using of SP for decision making under uncertainty is a measure to indicate the amount of cost (installation costs, access costs and unsatisfied demand costs) which can be saved implementing the solution proposed by SP method (as opposed to the use of deterministic method). The value of the stochastic solution (VSS) is defined by the difference between the expected result of using the expected value problem (EEV) and the stochastic solution (recourse problem, RP) (Birge Citation1982).
The expected value (EV) problem is obtained by replacing all random variables in scenarios with their expected values. Letting , where
for the demand parameter is
, and
, the EV problem represents deterministic solutions.
(15)
(15)
Let represent solutions for EV problem, then the EEV is given as:
(16)
(16)
Then the VSS can be defined as:
(17)
(17)
In the next section, this measure will be calculated for the study area to indicate the cost which can be potentially saved as a consequence of determining optimum locations of charging stations using SP.
5. Case study: city of Eindhoven
The proposed TSMIP is demonstrated for the city of Eindhoven, The Netherlands, which covers an area of 88.9 km2 and 5514 traffic analysis zones (TAZs). In our computational experiments, TAZ refers to a 6-digit postal code area (PCA), which is the most detailed data available with an average area of 0.016 km2 (Max: 1.581 km2, Min: 59 m2) and 15–20 addresses. All information needed for constructing TSMIP is aggregated by TAZ level. To estimate out-of-home charging demand across the city, PEV users’ activity schedules were simulated using activity-based travel demand forecasting model system, Albatross.
5.1. Creating a synthesized population
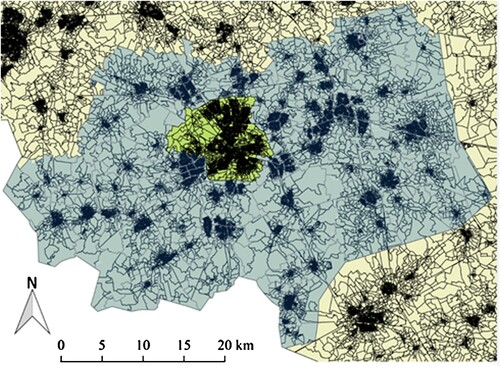
The first step of activity-based travel demand forecasting is to create a synthetic population. Iterative proportional fitting (IPF) is used to create a sample consistent with known statistics of a target population at the household level (Arentze, Timmermans, and Hofman Citation2007). In this study, the area of the target population is set to Eindhoven Metropolitan Area, as shown in Figure , because not only people living in the city, but also people who live nearby can use the charging infrastructure. IPF is an algorithm for constructing tables of numbers satisfying constraints on marginal distributions (referred to as multiway table). To set the initial frequency cross-table, we used the 2009 Dutch national travel survey data (Mobiliteitsonderzoek Nederland or MON). The sample is then fitted to the population of the Eindhoven metropolitan area, which resulted in 334,491 households. It should be noted that, due to data availability, the IPF is conducted for each subzone level which is the spatial unit of the national modelling system used by the Dutch Ministry of Transport and Environment. However, the spatial resolution of subzone (roughly 32.0 km2) is too low for this study. Using the available data source, such as land use and population data, the synthesized households are allocated at the TAZ level.
Figure 5. Eindhoven metropolitan area and the city of Eindhoven.
The synthesized population is input to a logistic regression model to estimate the number of households with PEV in the generated population. Both the MON sample (N = 33,298) and our survey among PEV users (N = 260) constitute the basis of the model estimation for non-PEV users and PEV users, respectively. It is assumed that only one PEV is allowed for each household, and the type of PEV (i.e. BEV, PHEV) is randomly distributed among households following the share of PEVs in the Netherlands.
The results of the logistic regression model are shown in Table . Only significant results are discussed here. The estimation results reveal that age, gender, income level, work status, and the number of cars in the household are significant predictors of PEV ownership. Males have a higher tendency to have a PEV than females. Regarding age, the proportion of PEV users is particularly high in the age groups 1: 35–54, 2: 55–64, and 3: 65–75 compared to age group 0: 0–35. In addition, people with high income, more working hours, and multiple cars in the household are more likely to own a PEV. These results are in line with a German sample (Plötz et al. Citation2014). In terms of the accessibility measure, people who are residing in less accessible places are less likely to own a PEV. Figure shows the synthesized household with PEV allocated at the TAZ level. The visualization tool is implemented using R shiny application (Chang et al. Citation2018).
Figure 6. Synthesized PEV population.
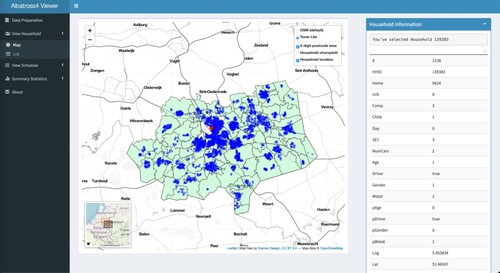
Table 4. PEV population logistic regression results.
5.2. Forecasting out-of-home charging demand
Once the synthesized PEV population is created, Albatross generates activity schedules and travel patterns of each member of the synthesized households (maximally two members including household head and his/her partner, if any) at the 4-digit PCA level. The simulated activity schedules consist of 22,970 person-trips among 3269 households with PEV and 5675 household members, as shown in Table . As with the household allocation, land use data is used to allocate activity to TAZ with the corresponding land use type within the chosen 4-digit PCA. Figure shows the generated activities and their locations.
Figure 7. Generated activities and activity locations.
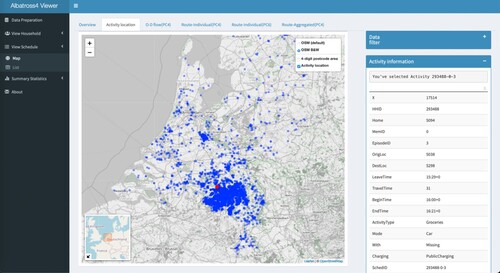
Table 5. Summary statistics of the generated activities.
Next, the charging decision tree is applied to the activity schedules to identify whether a charging activity occurs in parallel with the activity episode under concern. Out of all variables listed in Table , a set of charging related variables (SOC, L2Dist, and L2N) is not a part of Albatross. Therefore, the values of these variables are obtained through extra tasks. SOC was randomly assigned (between 0% and 100%) at the first trip, and then it is calculated based on the distance travelled using the specifications of PEV and Level-2 charging stations as shown in Table . In order to stabilize the initial randomly assigned SOC, the final charging demand is predicted for a normal weekday, followed by 7 days of burn-in period. Moreover, it is to be noted that at-home charging is also modelled with an extra decision tree and taken into account for the calculation of SOC. Charging rates vary based on the type of PEV but different battery performance attributed to varying weather conditions is not taken into account. Spatial proximity variables of Level-2 charging stations (L2Dist and L2N) are derived from the current layout of charging infrastructures in the city of Eindhoven. Total expected out-of-home charging demand is estimated as 321,583 vehicle-minutes, which equals approximately 98 min per PEV per day.
Table 6. Specifications of PEV and Level-2 charging station for simulation.
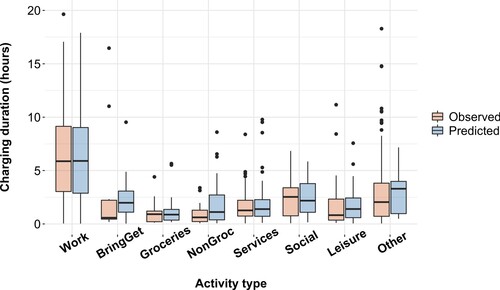
The predicted out-of-home charging activities are verified in comparison with the observed data regarding activity generation dimensions (frequency, start time and duration) by activity type. Figure shows that the trend of frequency distribution between observed and predicted results is not much different. For both, it is shown that more than half of out-of-home charging occurs at work. The dynamic decision tree slightly underpredicts out-of-home charging during work and service activities, while there is a slight overprediction for other activities. As shown in Figure , the temporal distribution of charging start times shows, in general, similar patterns by activity type. However, it is observed there is a distinct difference for grocery shopping and other activities. We suppose that this discrepancy comes from the limited observations of specific activity types. Figure depicts box plots of charging duration per activity type. The median values are displayed as the band inside the box, the mean values are represented by the triangle points, and the dots are the outliers defined as outside 1.5 times the interquartile range. In general, there is a similar trend for overall activity types with a few exceptions.
Figure 8. Charging frequency distribution.
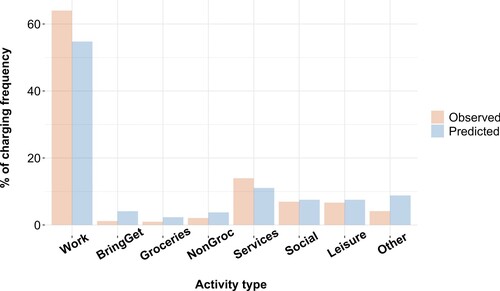
Figure 9. Charging start time distribution.
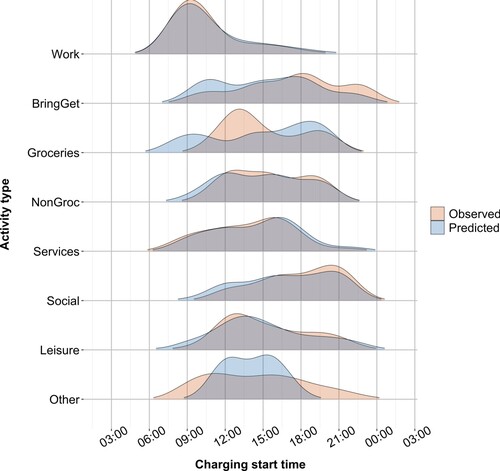
Figure 10. Box plots of charging duration.
5.3. Charging station location-allocation
5.3.1. Model input parameters
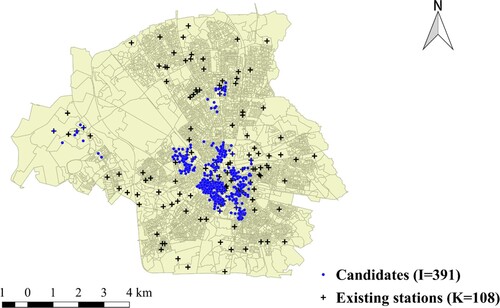
In this section, we introduce the inputs used to provide the parameter values for TSMIP. The TSMIP is applied to define the optimal location of public charging stations and the number of charging slots across the area of the city of Eindhoven, as shown in Figure . The study area includes 106 existing charging stations (K = 106) with 193 charging slots, and 391 candidate locations (i.e. public parking lots) (U = 391) with 2303 available charging slots ( = 2303) (Gemeente Eindhoven Citation2019). The maximum number of charging slots at any candidate location
is limited to 30 (i.e. max(
) = 30). It should be noted that candidate places are confined to the public parking space of Eindhoven. Forecasted charging demands are aggregated by TAZ level, which results in 308 demand points (
= 308). The unit setup cost,
, is set to €2500 based on Level-2 charger slot cost (40A, 9.6 kW) (Smith and Castellano Citation2015). Moreover, it is assumed there are no costs of converting public parking lots to charging stations. The number of charging slots will be constrained by budget
. The total available budget B is set to €250,000, and therefore the total number of charging slots to be built is limited to 100. Sensitivity analysis on the effect of varying constraints is discussed in Section 5.4. The capacities of both existing and new charging stations to be built (
and
) are calculated based on a collection of daily capacities of charging slots (720 vehicle-minutes per charging slot).
Figure 11. Map of the city of Eindhoven.
For unitary access cost,, we consider the average hourly wage in 2016 in the Netherlands, which is 23.8 €/hour, and assume the average walking speed is 5 km/hour. Thus, the unit access cost is set to 0.079 €/km·vehicle-minutes. Unitary penalty cost for unsatisfied demand,
, is set to a large enough value, 3 €/vehicle-minute, to prevent an infeasible solution caused by the capacitated TSMIP (Correia and da Gama Citation2019, 196). Two distance matrices,
and
, are derived by computing the shortest path distance using GIS. The data for the stochastic demand parameter,
, is obtained from the combination of scenario
, demand point v, and leaf node n.
5.3.2. Generated scenario
As the leaf nodes of the decision tree are identified as shown in Table , possible scenarios for describing charging demand can be drawn. Given the decision tree of two choice alternatives (i.e. charging or not charging), according to the number of leaf nodes, 31 scenarios are considered. As mentioned in Section 4.2., deterministic scenarios (with 0 or 1 charging probability) can be reduced into a single scenario (,
), resulting in reduced 18 scenarios. For example, scenario 1 consists of multiple leaf nodes mostly governed by their first split (SOC = 0), except Node 9, which constructs its own scenario 2. The occurrence probability of each scenario
is derived from Equation (15) and is shown in Table .
Table 7. Scenario and scenario probability.
5.3.3. Location-allocation results
Based on the inputs specified above, the number of charging slots and locations of charging stations are determined. Given that the number of scenarios is moderate, the proposed TSMIP with recourse is solved for its deterministic equivalent form using CPLEX MIP solver based on the branch-and-bound algorithm. The extensive form of deterministic equivalent of the TSMIP can be taken by replacing the expectations by probability weighted summation over the finite number of scenarios and setting deterministic constraints for each scenario. As a result, the second stage objective function can be rewritten as follows:
(18)
(18)
The TSMIP is implemented using the AIMMS mathematical modelling-language (Bisschop Citation2006), and is solved using the Benders decomposition algorithm of CPLEX 12.8. All computational experiments were performed on a system with an Intel 3.40 GHz CPU, and 16 GB RAM. All optimizations were performed with a 10−5% MIP relative optimality tolerance which means the solver stops when the best solution is within 10−5% of the global optimum. Other options were set to default values. The size of TSMIP is shown in Table .
Table 8. Property of the TSMIP.
Table 9. The result of stochastic measures (B = 100*€2,500).
Table 10. VSS by budget constraints.
As shown in Figure , the optimal location of charging stations and the corresponding number of charging slots are found. In this case study, we consider the budget of €250,000 which is equivalent to the cost of installing 100 charging slots. The results show that all charging slots were built and distributed among 58 candidate places, minimizing both the access cost and unsatisfied charging demand. The number of built charging slots varies from 1 to 8 for each chosen location. The performance of the SP algorithm is examined using the measures introduced in Section 4.3. RP, EEV and VSS values are calculated based on Equations (15)–(17).
Figure 12. Expected charging demand and optimal charging station locations (B = 100*€2500).
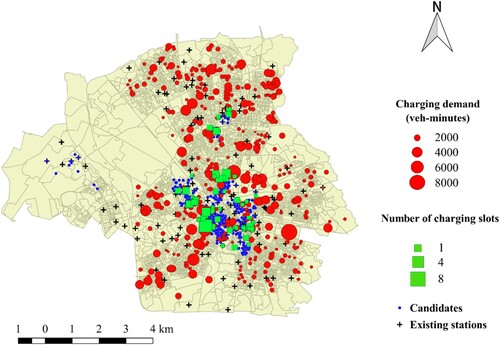
Table 9 shows the results. The value of VSS indicates that the use of the stochastic approach is beneficial as the cost of ignoring uncertainty is €8347. These results highlight the importance of considering uncertainty in the location-allocation problem using the dynamic decision tree.
5.4. Sensitivity analysis
This section highlights the impact of the budget for the number of charging slots to be built on the outcomes of the TSMIP. By tuning the value of parameter B in Equation (5) in the first stage, the number of charging slots was varied from 0 up to 300. Figure shows the cost component of each solution for the varying budgets. The first column represents the status quo deterministic solution without installing any charging slots, and in this case the access cost indicates the cost incurred between demand points and the existing charging stations. As the budget increases, as expected, total access costs increase because more charging stations are built and used, but it eventually saturates at 200 charging slots. This result may help practitioners and policy makers in better allocating resources to optimize system performance with a limited budget. Table 10 shows the results of the stochastic measures. A notable result of the experiment is that, in general, VSS decreases as the budget increases, which implies that the stochastic approach is more useful when a decision-maker has a limited budget. Similar findings have been reported in other studies (Alfieri, Tolio, and Urgo Citation2012; Pantuso, Fagerholt, and Wallace Citation2016).
Figure 13. Cost component by varying budget constraints.

6. Conclusions
This paper proposed a TSMIP to solve the PEV charging station location problem in urban areas under uncertain charging demand caused by probabilistic decision rules of heterogeneous PEV charging. A CHAID-based dynamic decision tree is used to predict stochastic charging demand represented by a set of probabilistic action states in each leaf node of the decision tree. Multi-day activity-travel diary data of PEV users are used to impute the decision tree. A novel scenario-generation method that utilizing the dynamic decision tree is developed, which results in statistically well-defined and tractable models with a manageable number of scenarios. Given that the dynamic decision tree is capturing the unobserved heterogeneity among PEV users and panel effects, the proposed TSMIP uses scenarios constructed from the leaf nodes of the estimated dynamic decision tree, where the corresponding branches represent heterogeneous decision rules in charging activity. Furthermore, the TSMIP is a capacitated problem since the facilities that would be built have an upper and a lower bound of capacity. Moreover, it also considers the capacity of existing facilities.
The study contributes in a variety of ways to the state of the art in location-allocation modelling of PEV charging stations. First, it replaces simple behavioural principles, such as distance minimizing behaviour, with a full-fledged and state of the art behavioural model of activity-scheduling behaviour. Second, it replaces often used proxy data with a dedicated data set on charging behaviour. Third, it is the first study of its kind that uses multi-day activity diary data of PEV users, and it is also the first that uses newly developed dynamic decision trees. Finally, a novel scenario generation method is suggested for the SP approach to account for model uncertainty.
The proposed approach is demonstrated for the city of Eindhoven, The Netherlands. Optimal locations of the charging stations and their sizes (i.e. number of charging slots) are determined. Results show that the value of using TSMIP is significant compared to the deterministic counterpart. Sensitivity analysis on the effect of different budgets provides insightful information on the use of a limited resources to PEV charging station location-allocation problem. The result may help practitioners and policy makers in better allocating resources to optimize system performance. It is found that the benefits of using a stochastic approach are greater for a location-allocation problem with limited resources. For further analysis, it is recommended to explore the performance of the TSMIP for a larger urban network.
The study is not without its limitations. First, it focuses only on the planning of public slow (Level-2) charging stations in a city. However, as the technology matures, the availability of public fast charging stations will be increasing not only along major highways but also in urban areas, which will bring substantial changes to PEV users’ charging behaviour. Second, a critical assumption of the suggested approach is that charging is considered once the activity-travel scheduling decision has been made. We did examine a new decision tree predicting the location choice of an activity which included as a condition state whether or not charging infrastructure was available at that location, but it turned out not to be significant. The assumption does imply, however, that the activity-scheduling behaviour, including charging, is invariant of the configuration of charging locations. Relaxing this assumption would make the problem exponentially more difficult to solve in the sense that it would require much more computing time.
Disclosure statement
No potential conflict of interest was reported by the author(s).
Notes
1 In the literature, some authors point out the difference between decision making under ‘risk’ and decision making under ‘uncertainty’ (Knight Citation1921; Rosenhead, Elton, and Gupta Citation1972; Snyder Citation2006). ‘Risk’ refers to the situation where probabilistic information concerning the randomness is available to the decision-maker, whereas ‘uncertainty’ (or Knightian uncertainty) refers to the situation where the decision-maker has no quantitative information.
2 Level 2 charging refers to charging through 208/240-volt alternating-current charging equipment which is the most common type of charging considered for public charging stations. It takes 3 h for 16 kWh PHEV and 6 h for 60 kWh BEV, respectively.
References
- Alfieri, Arianna, Tullio Tolio, and Marcello Urgo. 2012. “A Two-Stage Stochastic Programming Project Scheduling Approach to Production Planning.” The International Journal of Advanced Manufacturing Technology 62: 279–290.
- An, Kun. 2020. “Battery Electric Bus Infrastructure Planning Under Demand Uncertainty.” Transportation Research Part C: Emerging Technologies 111: 572–587.
- An, Kun, Wentao Jing, and Inhi Kim. 2020. “Battery-Swapping Facility Planning for Electric Buses with Local Charging Systems.” International Journal of Sustainable Transportation 14 (7): 489–502.
- Arentze, Theo A., and Harry J. P. Timmermans. 2004. “A Learning-Based Transportation Oriented Simulation System.” Transportation Research Part B: Methodological 38 (7): 613–633.
- Arentze, Theo A., and Harry J. P. Timmermans. 2005. Albatross Version 2: A Learning-Based Transportation Oriented Simulation System. Eindhoven: European Institute of Retailing and Services Studies.
- Arentze, Theo A., and Harry J. P. Timmermans. 2009. “A Need-Based Model of Multi-Day, Multi-Person Activity Generation.” Transportation Research Part B: Methodological 43 (2): 251–265.
- Arentze, Theo A., Harry J. P. Timmermans, and Frank Hofman. 2007. “Creating Synthetic Household Populations: Problems and Approach.” Transportation Research Record 2014 (1): 85–91.
- Auld, Joshua, Taha Hossein Rashidi, Mahmoud Javanmardi, and Abolfazl Mohammadian. 2011. “Dynamic Activity Generation Model Using Competing Hazard Formulation.” Transportation Research Record 2254 (1): 28–35.
- Berman, Oded, Richard C. Larson, and Nikoletta Fouska. 1992. “Optimal Location of Discretionary Service Facilities.” Transportation Science 26 (3): 201–211.
- Birge, John R. 1982. “The Value of the Stochastic Solution in Stochastic Linear Programs with Fixed Recourse.” Mathematical Programming 24 (1): 314–325.
- Birge, John R., and Francois Louveaux. 2011. Introduction to Stochastic Programming. 2nd ed. New York: Springer-Verlag.
- Bisschop, Johannes. 2006. AIMMS Optimization Modeling. Morrisville, NC: Lulu.com.
- Brandstätter, Georg, Michael Kahr, and Markus Leitner. 2017. “Determining Optimal Locations for Charging Stations of Electric Car-Sharing Systems Under Stochastic Demand.” Transportation Research Part B: Methodological 104: 17–35.
- Çalık, Hatice, and Bernard Fortz. 2019. “A Benders Decomposition Method for Locating Stations in a One-Way Electric Car Sharing System Under Demand Uncertainty.” Transportation Research Part B: Methodological 125: 121–150.
- Chang, Winston, Joe Cheng, J. J. Allaire, Yihui Xie, and Jonathan McPherson. 2018. “Shiny: Web Application Framework for R.” R Package Version 1.1.0. https://CRAN.R-project.org/package=shiny.
- Chen, T. Donna, Kara M. Kockelman, and Moby Khan. 2013. “Locating Electric Vehicle Charging Stations: Parking-Based Assignment Method for Seattle, Washington.” Transportation Research Record 2385 (1): 28–36.
- Chung, Sung Hoon, and Changhyun Kwon. 2015. “Multi-Period Planning for Electric Car Charging Station Locations: A Case of Korean Expressways.” European Journal of Operational Research 242 (2): 677–687.
- Cirillo, Cinzia, and Kay W. Axhausen. 2010. “Dynamic Model of Activity-Type Choice and Scheduling.” Transportation 37: 15–38.
- Correia, Isabel, and Francisco Saldanha da Gama. 2019. “Facility Location Under Uncertainty.” In Location Science. 2nd ed., edited by Gilbert Laporte, Stefan Nickel, and Francisco Saldanha da Gama, 185–213. New York: Springer.
- Der Kiureghian, Armen, and Ove Ditlevsen. 2009. “Aleatory or Epistemic? Does It Matter?” Structural Safety 31 (2): 105–112.
- Di Domenica, Nico, Gautam Mitra, Patrick Valente, and George Birbilis. 2007. “Stochastic Programming and Scenario Generation Within a Simulation Framework: An Information Systems Perspective.” Decision Support Systems 42 (4): 2197–2218.
- Dupačová, Jitka, Giorgio Consigli, and Stein W. Wallace. 2000. “Scenarios for Multistage Stochastic Programs.” Annals of Operations Research 100: 25–53.
- Faridimehr, Sina, Saravanan Venkatachalam, and Ratna Babu Chinnam. 2018. “A Stochastic Programming Approach for Electric Vehicle Charging Network Design.” IEEE Transactions on Intelligent Transportation Systems 20 (5): 1870–1882.
- Frade, Inês, Anabela Ribeiro, Gonçalo Gonçalves, and António Pais Antunes. 2011. “Optimal Location of Charging Stations for Electric Vehicles in a Neighborhood in Lisbon, Portugal.” Transportation Research Record 2252 (1): 91–98.
- Gemeente Eindhoven. 2019. “Eindhoven Open Data – Oplaadpalen.” Accessed April 14, 2019. https://data.eindhoven.nl/explore/dataset/oplaadpalen/.
- Ghamami, Mehrnaz, Yu Nie, and Ali Zockaie. 2016. “Planning Charging Infrastructure for Plug-In Electric Vehicles in City Centers.” International Journal of Sustainable Transportation 10 (4): 343–353.
- Giménez-Gaydou, Diego A., Anabela Sn Ribeiro, Javier Gutiérrez, and António Pais Antunes. 2016. “Optimal Location of Battery Electric Vehicle Charging Stations in Urban Areas: A New Approach.” International Journal of Sustainable Transportation 10 (5): 393–405.
- He, Fang, Yafeng Yin, and Siriphong Lawphongpanich. 2014. “Network Equilibrium Models with Battery Electric Vehicles.” Transportation Research Part B: Methodological 67: 306–319.
- Hodgson, M. John. 1990. “A Flow-Capturing Location-Allocation Model.” Geographical Analysis 22 (3): 270–279.
- Kaut, Michal, and Stein W. Wallace. 2007. “Evaluation of Scenario-Generation Methods for Stochastic Programming.” Pacific Journal of Optimization 3 (2): 257–271.
- Kim, Seheon, Soora Rasouli, Harry J. P. Timmermans, and Dujuan Yang. 2018. “Estimating Panel Effects in Probabilistic Representations of Dynamic Decision Trees Using Bayesian Generalized Linear Mixture Models.” Transportation Research Part B: Methodological 111: 168–184.
- Kim, Seheon, Dujuan Yang, Soora Rasouli, and Harry J. P. Timmermans. 2017. “Heterogeneous Hazard Model of PEV Users Charging Intervals: Analysis of Four Year Charging Transactions Data.” Transportation Research Part C: Emerging Technologies 82: 248–260.
- Knight, Frank H. 1921. Uncertainty Risk, and Profit. New York: Hart, Schaffner & Marx.
- Ko, Joonho, Daejin Kim, Daisik Nam, and Taekyung Lee. 2017. “Determining Locations of Charging Stations for Electric Taxis Using Taxi Operation Data.” Transportation Planning and Technology 40 (4): 420–433.
- Kuby, Michael. 2019. “The Opposite of Ubiquitous: How Early Adopters of Fast-Filling Alt-Fuel Vehicles Adapt to the Sparsity of Stations.” Journal of Transport Geography 75: 46–57.
- Kuby, Michael, and Seow Lim. 2005. “The Flow-Refueling Location Problem for Alternative-Fuel Vehicles.” Socio-Economic Planning Sciences 39 (2): 125–145.
- Mobidot B.V. 2017. Sesamo (Version 1.3.4) [Mobile App]. Downloaded January 3, 2017. https://itunes.apple.com/.
- Pantuso, Giovanni, Kjetil Fagerholt, and Stein W. Wallace. 2016. “Uncertainty in Fleet Renewal: A Case from Maritime Transportation.” Transportation Science 50 (2): 390–407.
- Plötz, Patrick, Uta Schneider, Joachim Globisch, and Elisabeth Dütschke. 2014. “Who Will Buy Electric Vehicles? Identifying Early Adopters in Germany.” Transportation Research Part A: Policy and Practice 67: 96–109.
- Rasouli, Soora, Seheon Kim, and Dujuan Yang. 2018. “Albatross IV: From Single Day to Multi Time Horizon Travel Demand Forecasting.” Paper Presented at the Transportation Research Board 97th Annual Meeting, 18-00460, Washington, DC.
- Rasouli, Soora, and Harry J. P. Timmermans. 2012. “Uncertainty in Travel Demand Forecasting Models: Literature Review and Research Agenda.” Transportation Letters 4 (1): 55–73.
- Riemann, Raffaela, David Z. W. Wang, and Fritz Busch. 2015. “Optimal Location of Wireless Charging Facilities for Electric Vehicles: Flow-Capturing Location Model with Stochastic User Equilibrium.” Transportation Research Part C: Emerging Technologies 58: 1–12.
- Rosenhead, Jonathan, Martin Elton, and Shiv K. Gupta. 1972. “Robustness and Optimality as Criteria for Strategic Decisions.” Journal of the Operational Research Society 23 (4): 413–431.
- Seddig, Katrin, Patrick Jochem, and Wolf Fichtner. 2019. “Two-Stage Stochastic Optimization for Cost-Minimal Charging of Electric Vehicles at Public Charging Stations with Photovoltaics.” Applied Energy 242: 769–781.
- Smith, Margaret, and Jonathan Castellano. 2015. Costs Associated with Non-Residential Electric Vehicle Supply Equipment: Factors to Consider in the Implementation of Electric Vehicle Charging Stations. Technical Report DOE/EE-1289. US Department of Energy. https://afdc.energy.gov/files/u/publication/evse_cost_report_2015.pdf.
- Snyder, Lawrence V. 2006. “Facility Location Under Uncertainty: A Review.” IIE Transactions 38 (7): 547–564.
- Speiser, Jaime Lynn, Bethany J. Wolf, Dongjun Chung, Constantine J. Karvellas, David G. Koch, and Valerie L. Durkalski. 2019. “BIMM Forest: A Random Forest Method for Modeling Clustered and Longitudinal Binary Outcomes.” Chemometrics and Intelligent Laboratory Systems 185: 122–134.
- Speiser, Jaime Lynn, Bethany J. Wolf, Dongjun Chung, Constantine J. Karvellas, David G. Koch, and Valerie L. Durkalski. 2020. “BIMM Tree: A Decision Tree Method for Modeling Clustered and Longitudinal Binary Outcomes.” Communications in Statistics-Simulation and Computation 49 (4): 1004–1023.
- Thomas, Tom, Karst T. Geurs, Johan Koolwaaij, and Marcel Bijlsma. 2018. “Automatic Trip Detection with the Dutch Mobile Mobility Panel: Towards Reliable Multiple-Week Trip Registration for Large Samples.” Journal of Urban Technology 25 (2): 143–161.
- Upchurch, Christopher, Michael Kuby, and Seow Lim. 2009. “A Model for Location of Capacitated Alternative-Fuel Stations.” Geographical Analysis 41 (1): 85–106.
- Wang, Ying-wei, and Chuan-ren Wang. 2010. “Locating Passenger Vehicle Refueling Stations.” Transportation Research Part E: Logistics and Transportation Review 46 (5): 791–801.
- Wu, Fei, and Ramteen Sioshansi. 2017. “A Stochastic Flow-Capturing Model to Optimize the Location of Fast-Charging Stations with Uncertain Electric Vehicle Flows.” Transportation Research Part D: Transport and Environment 53: 354–376.
- Yıldız, Barış, Evren Olcaytu, and Ahmet Şen. 2019. “The Urban Recharging Infrastructure Design Problem with Stochastic Demands and Capacitated Charging Stations.” Transportation Research Part B: Methodological 119: 22–44.
- Zhang, Anpeng, Jee Eun Kang, and Changhyun Kwon. 2017. “Incorporating Demand Dynamics in Multi-Period Capacitated Fast-Charging Location Planning for Electric Vehicles.” Transportation Research Part B: Methodological 103: 5–29.