
 ?Mathematical formulae have been encoded as MathML and are displayed in this HTML version using MathJax in order to improve their display. Uncheck the box to turn MathJax off. This feature requires Javascript. Click on a formula to zoom.
ABSTRACT
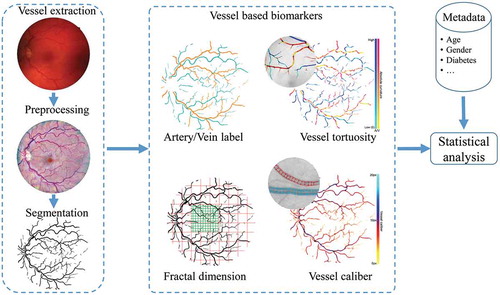
This paper presents an automated system for extracting retinal vascular biomarkers for early detection of diabetes. The proposed retinal vessel enhancement, segmentation, optic disc (OD) and fovea detection algorithms provide fundamental tools for extracting the vascular network within the predefined region of interest. Based on that, the artery/vein classification, vessel width, tortuosity and fractal dimension measurement tools are used to assess a large number of quantitative vascular biomarkers. We evaluate our pipeline module by module against human annotations. The results indicate that our automated system is robust to the localisation of OD and fovea, segmentation of vessels and classification of arteries/veins. The proposed pipeline helps to increase the effectiveness of the biomarkers extraction and analysis for the early diabetes, and therefore, has the large potential of being further incorporated into a computer-aided diagnosis system.
1. Introduction
Diabetes mellitus (DM) is a chronic disease in which the high blood sugar concentration is presented. The world diabetic population is reaching epidemic proportions worldwide, especially in Asia due to fast lifestyle changes and genetic factors. People with all types of diabetes (type 1, type 2 and gestational) are at risk for diabetic retinopathy (DR). The longer a person has diabetes, the higher the risk is. In the late stage of diabetes, medical treatment is no longer effective to cure the disease, while patients can still be controlled from the early diabetes in time (Tuso Citation2014). Early diabetes is the status of diabetes but before its complications (hypoglycaemia, heart disease, nerve damage and amputation, and vision problems) appear (Yang and Chan Citation2016). Many (Tuomilehto et al. Citation2001; World-Health Organization Citation2006) show that prevention of type 2 diabetes mellitus (T2DM) would eliminate a large proportion of the risk for visual loss from DR. Examination of retinas on patients diagnosed with T2DM is therefore performed in order to check if the disease has not yet lead to DR (damage to the retina due to T2DM). Thus, early detection is the key to prevention and successful treatment of these forms of blindness. However, the fact is that many cases still go unnoticed and are not treated in time, especially in rural areas where few medical experts are present.
Many ocular and systemic diseases including T2DM and DR can cause geometrical or pathological changes in the retina. A special property of the retina is that it is one of the only places in the human body where the vascular system can be directly observed. Clinical examination of the retina can be achieved via different techniques, in which the retinal imaging through fundus photography provides a non-invasive way to ophthalmologists for investigating different eye-related and systemic diseases (Abra`moff et al. Citation2010) including DR, age-related macular degeneration and glaucoma (Wong et al. Citation2008; Lim et al. Citation2012; Amerasinghe et al. Citation2008). The advantage of retinal imaging is that it provides direct access to the vascular abnormalities and enables further quantitative analysis of the retinal vasculature.
As a major component of the retina, retinal blood vessels include rich geometrical information and can provide important clinical biomarkers to assist ophthalmologists. Vessel calibre/width (Ikram et al. Citation2006), tortuosity (Han Citation2012; Bekkers et al. Citation2015) and fractal dimension (FD; Aliahmad et al. Citation2014) changes of the retinal arteries and veins have been shown to be important indicators for the assessment of diabetic disease. However, in the literature there is no general consensus about retinal vasculature changes. For example, in Cheung et al. (Citation2012) a positive, and in Sasongko et al. (Citation2011) a negative association of vessel tortuosity with progression towards diabetes is found. Sasongko et al. suggested that this inconsistency could be due to the duration of diabetes of the patients involved: it might be that an increase in tortuosity only occurs after long exposure (over 10 years) to diabetes.
Computer-aided diagnosis (CAD) systems (Doi Citation2007; Van Ginneken et al. Citation2001; Giger Citation2000; Tan et al. Citation2013, Tan et al. Citation2012; Kozegar et al. Citation2017; Tan et al. Citation2015; Somasundaram and Alli Citation2017; Niemeijer et al. Citation2010; Welikala et al. Citation2014; Sinthanayothin et al. Citation2002; Tavakoli et al. Citation2013; Antal and Hajdu Citation2014; Pourreza-Shahri et al. Citation2014) have been developed for different diagnosis purposes in medical imaging field. Due to the importance of the retinal vasculature, different computer-assisted platforms like the Integrative Vessel Analysis (IVAN) (Niemeijer et al. Citation2011), the Singapore I Vessel Assessment (Ng et al. Citation2014) and the RetinaCAD (Dashtbozorg et al. Citation2014a) were developed for the assessment of vascular changes. These softwares apply different retinal vessel analysis methods to identify the status of diabetes. Currently, the demands of early CAD systems for automatic screening programmes in different eye-related disease conditions are still growing. Thus, advanced retinal vessel analysis techniques need to be developed to set up more complete and reliable CAD infrastructures.
In this paper, our main focus is to set up a fully automatic system of processing retinal images and extracting retinal vascular biomarkers for further analysis on retina-related disease like type-2 diabetes and DR. The whole pipeline includes locating optic disc (OD) and fovea, vessel segmentation, artery/vein classification and biomarker extraction related to vessel width, tortuosity and FD measurements. This is the first time that all our proposed high-performance algorithms have been combined and adapted to a complete pipeline for retinal vessel analysis. In addition, this is also the first time that all the vessel biomarkers are calculated for arteries and veins separately using the proposed infrastructure. The proposed pipeline tools provide a comprehensive description about the automatic extraction of important geometric and topological biomarkers using our state-of-the-art vessel processing and analysis techniques. Hence, they can produce a large amount of retinal vascular biomarkers which reflect many of the possible vascular changes. The whole system implies high potential and reliability of being used to process and analyse large-scale clinical data sets. In Section 2, we introduce the infrastructure and the methodologies for retinal vessel analysis and biomarkers extraction. In Section 3.1, different data sets for evaluating our system will be described firstly. Afterwards, quantitative analysis will be separately performed on the automated results of each module, and we show that our automated pipeline tools are more effective compared to other state-of-the-art methods. We will discuss the results and finally conclude this paper in Section 4.
2. Methodology
In the framework of the RetintaCheck projectFootnote1 (Dashtbozorg et al. Citation2016a), we have developed several retinal image analysis tools including automatic retinal vessel enhancement (Zhang et al. Citation2016b; AbbasiSureshjani et al. Citation2015), segmentation (Zhang et al. Citation2015, Citation2016a), OD/fovea detection (Dashtbozorg et al. Citation2016b), artery/vein classification (Huang et al. Citation2017a, Citation2018), calibre calculation (Huang et al. Citation2017b), vessel curvature measurement (Bekkers et al. Citation2015) and fractal analysis (Huang et al. Citation2015, Citation2016) to obtain important vessel biomarkers like central retinal arterial equivalent (CRAE), central retinal venous equivalent (CRVE), the arterial-venous diameter ratio (AVR), vessel tortuosity and FD.
In , we illustrate how these modules interact with each other. All of these modules and the computed biomarkers are explained in the following subsections. With the availability of a large amount of biomarkers, we identify critical biomarkers with statistical analysis.
Figure 1. The pipeline for the analysis of retinal vascular biomarkers.
2.1. Vessel enhancement and segmentation
Retinal vascular analysis requires a well-extracted vessel tree from the original image . In the context of large-scale screening programmes, we need an efficient and accurate vessel segmentation algorithm to assist ophthalmologists. Here, we employ two different filters, i.e. the multi-scale left-invariant derivative (LID) filters and the locally adaptive derivative (LAD) filters in orientation scores for the enhancement and segmentation of blood vessels (Zhang et al. Citation2015, Citation2016a). The second-order multi-scale LID filters on the orientation score is denoted by
where the LID frame of reference is defined by
and the conversion factor with physical unit 1/length is also used here to balance the orientation and spatial direction that have different units, and where
and
provide the 2D-spatial scale
and 1D angular scale
of the Gaussian kernel. The rotating derivatives are taken in the
directions that are perpendicular to the vessel structures at their corresponding orientation planes
. Disentangled vessel segments in the 3D orientation scores
are enhanced by the rotating filters with proper scale samples
, and afterwards the 2D enhanced vessel map
is obtained by taking the maximum filter response over all orientations per position
. The final image reconstruction from the multi-scale filtered orientation scores is written as
where represents the number of orientations with
.
The LID frame is defined globally for each orientation plane rather than locally for each pixel in the score domain. Therefore, the LID filters are not always aligned perfectly with all local orientations. This inflexibility makes it difficult to achieve an optimal vessel enhancement with a limited number of orientation samplings . Following the theory of exponential curve fit as described in Zhang et al. (Citation2016a), we set up the LAD frame
which is adaptive to each position and orientation of the data. In our final vessel enhancement pipeline, the vessels are enhanced via second-order derivatives
(in the direction perpendicular to the vessels). An important efficiency consideration here is that, once the left-invariant Hessian
and the
frame are computed, the
derivatives can be efficiently computed by projecting the Hessian matrix onto the direction vector
via
where represents the Hessian matrix in the orientation score domain which is computed via the LID frame
:
Compared with the LID filter, the newly proposed LAD provides perfect alignment to local structures, and therefore it is more robust to local orientation changes, and even allows to use a small number of orientations. The scale-normalised LAD filter can be written as
The tubular structure enhancement via the locally adaptive frame is illustrated in Figure 2. The final image reconstruction from the multi-scale filtered orientation scores is given by
By defining a proper threshold value on the enhanced image, the binary vascular map is finally obtained. Both of the LID and LAD filters are validated on the DRIVE and STARE data sets (Staal et al. Citation2004; Hoover et al. Citation2000) with different image types, on which competitive segmentation performances are achieved.
2.2. OD and fovea detection
In retinal image analysis, the OD and fovea locations are important landmarks to decide the protocolised region of interest (ROI) for the measurement of vascular geometry changes, such as the FD, tortuosity, CRAE, CRVE and central AVR. A predefined special ROI is able to provide consistent and reliable measurements for later biomarker analysis. In this paper, we rely on the automatic OD and fovea detection technique proposed by Dashtbozorg et al. (Citation2016b), where a new convergence index operator, called super-elliptical filter (SEF) is presented. Furthermore, a set-up for the simultaneous localisation of the OD and fovea is introduced, in which the detection result of one landmark facilitates the detection of the other one. The response of the PSEF for pixel () can be formulated as
where , the
and the
are the pair of filters for the detection of OD and fovea centralis and
represents the width of the input image. If
, the fovea is on the left side of the OD; otherwise the fovea is on the right side. For the
filter, the inner and outer limits of the support region are set as
and
, while these limits for the
filter are set as
and
. The number of radial lines,
, is set to an optimal value of 32 for both filters and the band widths of
and
are used for the
and the
, respectively. Note that the
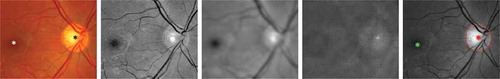
filter is applied on the inverted green channel since the fovea usually appears darker than the background in retinal fundus images. In , we show a typical example of accurate OD and fovea detection based on the above filtering-based approach. The paired SEF approach has been evaluated on the MESSIDOR data set (MESSIDOR Citation2014) and achieves success rates of 99.75
and 98.87
for the OD and fovea detection, respectively. The ROI is defined as ring sector centred on OD centre within 2–5 disc radius
from the OD margin.
Figure 2. The whole routine of achieving elongated structure enhancement operation via left-invariant operation
based on the locally adaptive frame
. The exponential curve fit provides the LAD frame with full alignment to local structures. An orientation score
can be constructed from a 2D image
to an orientation score
via wavelet-type transform
, where we choose cake wavelets (Bekkers et al. 2014b)) for
.
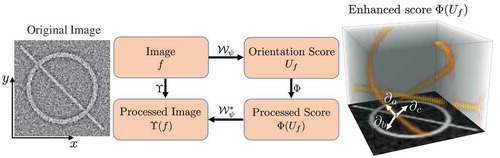
Figure 3. An example of the proposed optic disc (OD) and fovea detection. From Columns 1 to 5: original colour fundus image with manually annotated OD (black star) and fovea (white star), normalised green channel, Gaussian blurred image, PSEF response, and maximum response of PSEF indicating the OD location (red star) and the corresponding detected fovea (green star).
2.3. Artery/vein classification
The retinal vasculature can be categorised into arteries and veins while the retinal arteries and veins behave differently under pathological conditions. Their geometrical changes are respectively considered as signs of several diseases. Therefore it is important to define and study biomarkers separately for arteries and veins. In , we show the A/V pixel-wise classification results on an example image using different feature subsets based on our previously developed approach (Huang et al. Citation2017a) in the RetinaCheck group.
In our vessel analysis pipeline, a new supervised approach (Huang et al. Citation2018) is employed to classify the vessels into arteries and veins. In this method, we first obtain the segmented vessel pixels from the vessel segmentation method in Section 2.1. Then for each pixel, the vessel calibre is roughly measured in order to categorise them into small, medium or large vessel groups. We assign to each pixel a vessel calibre value based on the vessel calibre of the closest centreline point. Calibre of centreline pixels are found via thinning and a distance transform on the binary segmentation. The detection and parameterisation of the OD in Section 2.2 provides a binary mask which can be used to remove the vessels within the OD region. In addition, the centralis position is used in calculating some of the spatial features for the artery/vein classification. For each vessel centreline pixel, we extract in total 455 features including the local intensity of RGB and HSB colour channels; the mean, standard deviation, median, minimum and maximum of the intensities inside small, medium and large circular regions; the intensity values along each vessel centreline; and the intensity inside each vessel segment (as explained in ).
Table 1. The complete set of features extracted for each centreline pixel.
Table 2. Segmentation results on the DRIVE and STARE data sets.
Table 4. Comparisons of the success rate of the proposed framework for OD detection on all 1200 MESSIDOR images.
Table 5. Success rate of the proposed framework for fovea detection on the MESSIDOR data set compared with other methods.
The extracted feature vector with 455 features will result in an extremely high-dimensional feature space. Therefore, a genetic search-based feature selection approach is used to select a subset of features giving the highest classification accuracy. In the training phase, a linear discriminate analysis (LDA) classifier using a 10-fold cross-validation is trained with the optimal subset of features and validated on the testing sets. More details about the experimental settings and the validation results are given in the Section 3.4.
2.4. Vessel width measurement
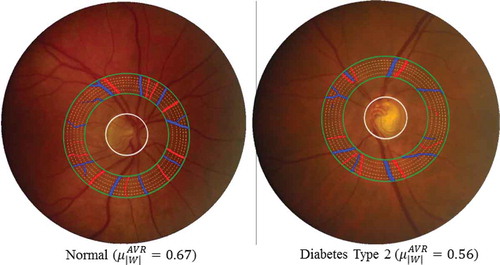
Vessel width is very important in the clinical study. The changes in vessel calibre directly reflect the change of blood flow viscosity and blood pressure in the vessels. In , we provide examples of a healthy subject and a diabetes type 2 subject to show the vessel width-based AVR difference in a specific ROI.
Figure 4. Examples of A/V pixel-wise classifications by using different feature subsets. The last column shows the classifications using total 45 features including all the normalised intensities and the reflection features (Huang et al. (Citation2017a)). Blue indicates veins and red indicates arteries.
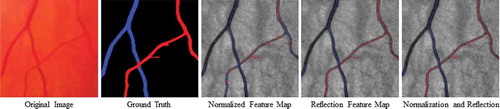
Figure 5. Two typical examples to show the vessel width-based artery and vein diameter ratio (AVR) difference in a specific ROI between one healthy subject and one diabetes type 2 subject. Blue indicates veins and red indicates arteries.
In this paper, we measure the CRAE, CRVE and AVR of the retinal vasculature in a specific ROI. An automatic multi-scale active contour technique (Huang et al. Citation2017b) is used to compute the retinal vessel calibre in fundus images. The full vessel calibre map is calculated based on the vessel segmentation results obtained from Section 2.1. Afterwards, an approach similar to the one described in Dashtbozorg et al. (Citation2014b) is applied for the estimation of the three biomarkers within predefined ROIs.
The proposed method for automatic vessel calibre measurement uses the centreline of a segmented blood vessel to initialise a deformable enclosed contour. Then the contour is evolved iteratively to find the best fit to the vessel boundaries. Finally, the vessel calibre is measured by computing the distance from one detected vessel edge to the other one. All the stages are summarised in .
Figure 6. The stages of the proposed automatic width measurement technique: (a) centreline detection; (b) contour initialisation; (c) active contour segmentation; (d) obtaining the left and right edges; (e) Euclidean distance calculation; and (f) vessel calibre estimation.
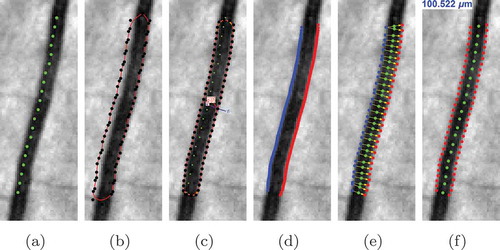
In the vessel calibre measurement step, the geodesic active contour model proposed in Caselles et al. (Citation1997) for solving a global optimisation problem is exploited to locate the left and right edges of each vessel segment. An enclosed and deformable contour is initialised using the extracted centreline pixels. Afterwards, the surface is iteratively deformed to minimise the energy function:
where (internal energy) represents the force of the interaction between adjacent control points, which preserves the smoothness of the surface. While
(external energy) indicates the image gradient which pulls the contour towards vessel boundary, and
(constraint energy) is used as a constraint for the external force. Therefore, at each iteration, the control points follow the contour evolution equation which is written as
where is the image and
gives the first-order Gaussian derivative of
,
and
are the Euclidean curvature and the unit normal vector of x(t), respectively.
is the speed function given
and
,
,
and
are weighting parameters. Smooth vessel boundaries are obtained after a certain number of iterations for contour evolution.
After removing the control points at the endings of vessel segment after contour evolution, vessel calibre is estimated using the left and right vessel boundaries. For each control point of one boundary, a corresponding nearest point is found on a B-spline interpolated curve of two nearest points on the other boundary. The Euclidean distance between each two points is computed and converted to micrometre (µm) using the physical pixel size of each image. The vessel calibre is measured by averaging the distances after removing outliers with extreme values.
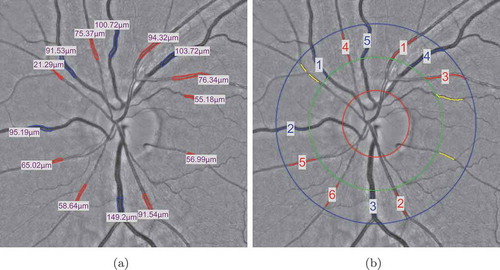
The vessel width-based biomarkers including the CRAE and the CRVE (see ) are calculated based on the vessel calibres within a specific ROI. The OD centre and diameter are obtained using the technique in Section 2.2. The vessels within the ROIs of 0.5–1.0 disc diameter around the OD centre are selected and the width-based biomarkers are calculated using the Knudtson’s revised formulas (Knudtson et al. Citation2003). Finally, the AVR value is defined as the ratio between the CRAE and CRVE.
Figure 7. The vessels within the ROIs are used to compute the CRAE and CRVE values: (a) the widths of selected vessel are measured by the proposed method; (b) the six largest arteries and veins are then selected for the calculation of CRAE, CRVE and AVR values.
2.5. Vessel tortuosity measurement
The vessel tortuosity is measured based on the local tortuosity (curvature) of blood vessels, which indicates the rate of change in orientation, and which might be increased because of diseases. The common practice for measuring the vessel curvature is based on an initial vessel segmentation. By finding the vascular skeleton, splitting the skeleton at junction positions, fitting a curve to each segment and parameterisation of these curves, the local curvatures of these segments are obtained. Then we obtain the curvature at each vessel centreline pixel. The vessel tortuosity degree is defined by the ratio between the actual length of a vessel travelling from position to
, and the straight/shortest distance between
and
(Patton et al. Citation2006).
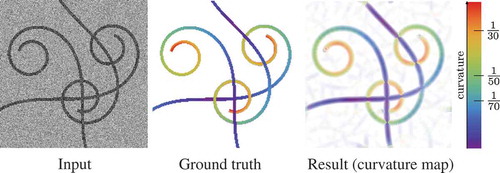
However, the above technique is limited for accurate tortuosity measurement due to accumulated errors associated with retinal vessel segmentation and imperfect skeletonisation. To avoid propagation of errors in each step of such pipelines, a new alternative local curvature extraction method was proposed (Bekkers et al. Citation2015). The tortuosity of vascular structure is computed to study its association with type 2 diabetes. For each retinal image, a corresponding curvature map, where the pixel intensity indicates the local curvature value at each pixel, is obtained by using the exponential curvature estimation technique which relies on the theory of exponential curve fits in orientation scores (Bekkers et al. Citation2015; Zhang et al. Citation2016a). In orientation scores, exponential curves are circular spirals, which are essentially straight lines with respect to the curved geometry of the rotation and translation space. The best fit is obtained by eigensystem analysis of the Gaussian Hessian in the lifted space and their spatial projections directly define the curvature at each pixel. The curvature values are computed directly from tangent vectors of exponential curves that locally best fit the data:
where the coefficients of the tangent vector ,
and
are expressed in the moving frame of reference
(see Section 2.1). shows an example of using our method to calculate the curvature map of an image with curvilinear structures. The visual comparison shows a remarkable agreement of curvature estimation between our
curvature estimation technique and the ground truth.
Figure 8. Validation of the exponential curvature estimation on a typical synthetic image. From left to right: input image (SNR = 1), ground truth colour-coded curvature map, measured curvature map with resp.
After obtaining the curvature map, the curvature-related biomarkers are defined as the average () and the standard deviation (
) of all the centreline pixels of large size vessels (
pixels), medium size vessels (4–6.5 pixels), small size vessels (
pixels) and all vessels on the conventional curvature map (
) and the exponential curvature map (
). In addition, the biomarkers are extracted from the arterial tree, venous tree and both type of vessels.
2.6. FD measurement
The concept of FD was initially defined and developed in mathematics. It measures the complexity of self-similar objects that have the same patterns across different scales, e.g. trees, snowflakes and vessel networks. The self-similar property can be described as
where represents some measurements applied on the complicated pattern of the object at a scale
, and
is the FD that implies how many new similar patterns are observed as the scale changes. For the calculation of the FD, we use the method proposed by Huang et al. (Citation2016). The FD is computed on the binary segmented images using three classic FD measurements that are widely used in the literature. These three measurements are the box dimension (BD), information dimension (ID) and correlation dimension (CD), which measure different properties of the self-similar pattern of the retinal vessel structures, respectively.
In this paper, we extensively estimate the FD of a vascular network by using the BD, ID, CD (Huang et al. Citation2016), Renyi FD spectrum, Mandelbrot singularity spectrum and the lacunarity (Kinsner Citation2008). BD is the direct implementation of the Hausdorff dimension in mathematics. The BD is defined as the real number , such that the number
of balls with radius r that is needed to cover an object grows with
as
:
So in the image domain, the measurement is the number of boxes with side length r that overlap with the vessel segmentation. ID is defined as:
where is the number of boxes with size
overlapped with the object, the numerator
is the first-order Shannon entropy,
=
is the probability for finding a part of the object in the ith box, M is the total mass of it and
is the part of the object in the box. The limit of Equation (15) is estimated as the slope of the regression line of the logarithmic points.
The CD estimates the FD via the relationship between two pixels inside a region. A correlation integral can be approximately expressed in terms of the probability density
where is the Heaviside step function,
is the ith pixel belonging to an object,
is the probability density of the object with mass M in the jth box with size
. The CD
is defined via the relationship between
and
as
.
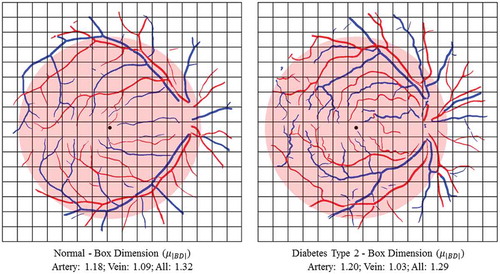
The related biomarkers are computed using FDs on the full vascular network and also on the arterial and venous network separately, using the result of artery/vein separation. We also consider the different ROIs as defined in Subsections 2.2 and 2.4 for the statistical analysis. In , two examples of a healthy subject and a diabetes type 2 subject are shown and the BD is calculated using box-counting technique on the arterial tree, venous tree and both.
Figure 9. Examples to show the calculation of box dimension (BD) in a specific ROI between one healthy subject and one diabetes type 2 subject. Blue indicates veins and red indicates arteries.
3. Validation and experimental results
3.1. Material
In this work, in total seven (including four established publicly available and three private) colour retinal fundus data sets, MESSIDOR (MESSIDOR Citation2014), DRIVE (Staal et al. Citation2004), STARE (Hoover et al. Citation2000), INSPIRE-AVR (Niemeijer et al. Citation2011), NIDEK, CANON and TOPCON, are used for evaluating different modules of our proposed pipeline. The best performance of each measurement is labeled as boldface in all tables.
3.1.1. MESSIDOR data set
MESSIDOR data set (MESSIDOR Citation2014) is the only data set with publicly available ground truth for both the OD and the fovea centres. This data set includes 1200 retinal fundus colour images acquired from a Topcon non-mydriatic retinograph with field of view (FOV). The images have resolutions of
,
or
pixels. The manually delimited OD boundaries for all 1200 images and the annotations of fovea centres for 1136 images are provided by the University of Huelva which are publicly available (MESSIDOR Citation2014)
3.1.2. DRIVE data set
DRIVE data set is a public data set provided by Staal et al. (Citation2004). The images are fovea-centred and were acquired by a Canon CR5 non-mydriatic 3CCD camera with a 45° FOV at resolution of 768 584 pixels. The data set is originally split into a training set and a testing set, each of which contains 20 images. The binary mask of the FOV is provided by the authors of this data set. The ground truth of vessel segmentations and A/V labels of the DRIVE images, provided by Hu et al. named RITE data set (Hu et al. Citation2013), are used for validation.
3.1.3. STARE data set
STARE data set (Hoover et al. Citation2000) includes 20 colour fundus images with a resolution of pixels, in which 10 images contain pathologies. Two groups of manually segmented binary maps are provided by two observers. The FOV masks of the STARE data sets are created manually in our work since the FOV boundary in the retinal image is obvious.
3.1.4. INSPIRE-AVR data set
INSPIRE-AVR data set (referred as INSPIRE) is a public data set provided by Niemeijer et al. (Citation2011). It contains 40 OD-centred images at resolution 2392 2048, where the vessel centrelines and the vessel types are labelled by Dashtbozorg et al. (Citation2014a).
3.1.5. NIDEK data set
NIDEK data set consists of 200 retinal images, where 100 are fovea-centred and 100 are OD-centred images, with size of 3744 3744 acquired in the Ophthalmology Department of the Academic Hospital Maastricht (AZM) the Maastriche Study (Schram et al. Citation2014) in the Netherlands. These images were captured using a NIDEK AFC-230 non-mydriatic fundus camera. The blood vessels are segmented by the automatic vessel segmentation described in previous section and the vessel types were labelled by experts using the manual annotation tool in ‘RHINO’ software developed by Dashtbozorg et al. (Citation2017).
3.1.6. CANON data set and TOPCON data set
CANON and TOPCON data sets both contain 60 fovea-centred and 60 OD-centred retinal images. The images were captured by a Topcon NW300 on 12 healthy subjects, and each subject received five acquisitions. The images of Topcon camera have size of 2048 1536 pixels. The A/V labels are obtained using the manual annotation tool in ‘RHINO’ software (Dashtbozorg et al. Citation2017).
3.2. Vessel segmentation
We exploit the following performance measurements: the vessel pixels in the ground truth that are correctly classified as vessels in the segmentation results are denoted as true positives (TP). If they are labelled as non-vessels, they are considered as false negatives (FN). The non-vessel pixels in the ground truth that are correctly classified as non-vessels in the segmentation results are denoted as true negatives (TN). If they are predicted as vessels, they are counted as false positives (FP). To make a global performance comparison of the proposed algorithm with state-of-the-art vessel segmentation methods, we evaluate the performance measures: (
),
(
),
(
) given by
where . To evaluate the quality of our vessel enhancement, the receiving operator characteristics (ROC) curve is computed with the TP ratio (
) versus the FP ratio (
) with respect to the varying threshold value
. The area under the ROC curve (AUC) is calculated to quantify the segmentation performance, where the AUC value 1 represents a perfect segmentation.
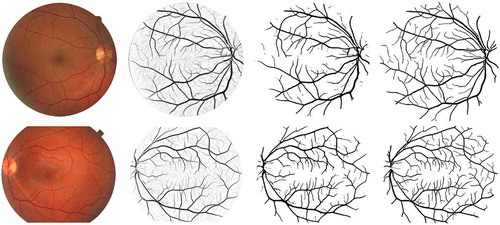
shows examples of vessel segmentation results of the DRIVE and STARE data sets. We also show the ground truth images that were annotated by the first human observer as references. We can see that our LAD filter-based segmentation approach is able to preserve most of the small vessel structures, which has great clinical significance for the assessment of biomarkers like FD (complexity of the vasculature) (Patton et al. Citation2006) and detection of neovascularisation (formation of new microvasculature) (Lee et al. Citation2013). To compare with the state-of-the-art vessel segmentation algorithms, we evaluate the proposed methods with the performance metrics ,
,
and AUC for the DRIVE and STARE data sets as shown in . The performance measurements, particularly,
and AUC values demonstrate that the proposed LAD-OS method outperforms most of the unsupervised and supervised methods on both of the colour fundus image data sets. More detailed comparisons and discussions about the segmentation performance are given in Section 4.
Figure 10. Examples of vessel segmentation by the proposed algorithm on images from the DRIVE and STARE data sets. Row 1: an image from the DRIVE data set (,
,
and
). Row 2: an image from the STARE data set (
,
,
and
). From Columns 1 to 4: original colour images, vessel enhancement result, hard segmentation result and ground truth.
3.3. OD and fovea detection
For the evaluation of the OD localisation technique, a detected position is considered correct if it is inside the manually annotated OD boundary. summarises the results for the OD detection, where the PSEF approach provides similar or better performance than most of the state-of-the-art methods. Our results are comparable to those obtained by the OD detection methods presented by Marin et al. (Citation2015), Mendonc¸a et al. (Citation2013) and Lu (Citation2011). These methods as well as our approach fail to detect the OD in only 3 cases out of 1200 images, while the method proposed by Dashtbozorg et al. (Citation2015) fails in only 2 images.
For the evaluation of the fovea detection, an obtained fovea location is considered correct if the Euclidean distance to the location of the manually annotated fovea is less than the OD radius (). For further evaluation, three additional distances are also included as criteria. These distances are
,
and
which are also used by Gegundez-Arias et al. (Citation2013) and Aquino (Citation2014) We analyse the performance of our fovea detection results on 1136 images to compare with the results reported in Aquino (Citation2014), Giachetti et al. (Citation2013) and Gegundez-Arias et al. (Citation2013), and we also repeat the experiment for the whole set to compare with other methods where all the 1200 images have been used (Kao et al. Citation2014; Yu et al. Citation2011; Niemeijer et al. Citation2009). As shown in , the PSEF approach achieves a success rate of 98.87% for the distance less than
which is higher than ones reported by Kao et al. (Citation2014), Niemeijer et al. (Citation2009) and Gegundez-Arias et al. (Citation2013) for all 1200 images. For the set of 1136 images, we obtain a success rate of 99.65% which is relevantly higher than those achieved by Aquino (Citation2014), Giachetti et al. (Citation2013) and Gegundez-Arias et al. (Citation2013). The results presented in demonstrate that better performance is achieved by the proposed approach for fovea detection compared to other methods.
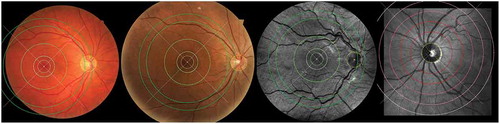
demonstrates example results of OD and fovea detection on images which are acquired using different type of fundus cameras. In order to standardise the biomarkers, all values are calculated from the vessels inside specified ROI around the fovea or OD centres (). For the fovea-centred images, the regions are defined by discs centred at the fovea location with the radii of 3, 5 and 6 times the OD radius (), while for the OD-centred images, the regions are specified as the standard ring areas within 2 to 3, 5 or 6
from the OD centre. The
is set in accordance to the average of OD radius in the human eye.
Figure 11. OD and fovea detection results and defined region of interest around OD or fovea centre.
3.4. Artery/vein classification
Retinal images from the DRIVE, INSPIRE, NIDEK, Canon and Topcon data sets are used to evaluate the artery/vein classification method. Each data set is trained and tested individually. Half of the images are used for feature selection and classifier training, and the rest are used for testing. Vessel centrelines including large, medium and tiny size of vessels are extracted, and the features are obtained as described in Section 2.3. Afterwards, the optimal feature subset is found via the genetic-search feature selection technique and a final LDA classifier is trained using all training data with the optimal features. For the test phase, the trained classifier assigns a probability value (between 0 (vein) and 1 (artery)) to each centreline pixel, and a threshold value of 0.5 is used for the A/V label decision. The performance of classification is evaluated by computing the sensitivity (arteries classified correctly), the specificity (veins classified correctly) and the accuracy (the average of sensitivity and specificity).
In , we show the quantitative evaluations of the classification performance on different data sets. We categorise the data sets into fovea-centred images and OD-centred images, where the DRIVE data set contains only fovea-centred images, the INSPIRE data set contains only OD centred and the rest contain both types. The results are shown in terms of accuracy (), sensitivity (
), specificity (
) and
. shows the example of A/V classification results for the DRIVE and INSPIRE data sets separately using the proposed framework. At each row, we show the original retinal image, the A/V ground truth for the vessel centreline, pixel-wise classification and segment-wise classification results. The vessels with red and blue colour represent the correctly classified artery and vein, while the yellow colour represents the wrongly classified vessels.
Table 3. The performance of the proposed framework on the DRIVE, INSPIRE, NIDEK, and Topcon data sets.
3.5. Vessel width measurement
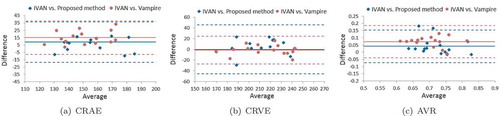
For the vessel width-based biomarkers measurement, we take the system error as a metric to show the robustness of each tool by using the same vasculature acquired in multiple acquisitions. Here, we employ five acquisitions on 15 subjects to compute the errors by taking the average of the relative errors (REs) (mean/standard deviation) of them. The results are shown in . We can see that the Vampire annotation tool produces the largest variation as expected among the three tools, which is two times larger than the other two tools. The calibres obtained by manual vessel annotation are clearly prone to human error.
In , the Bland–Altman plots are provided to show the comparison between our method and the Vampire annotation tool by taking the IVAN software as a reference. The CRAE values measured using our method show better agreement with the values obtained from the IVAN software, where it presents a lower bias than the Vampire. Both of the tools achieve similar performance with approximately zero bias for the CRVE measurement, though the error of the Vampire is lower than our method. For measuring AVR, which is an important clinical relevant biomarker in large-scale setting, our fully automatic method produces much accurate results than the human annotation tool, with lower bias and variation. For more details about the validation, we refer to Huang et al. (Citation2017b).
Figure 12. A/V classification results from the DRIVE and INSPIRE data sets. From left to right: the original images, the A/V label of the vessel centrelines, the pixel-wise classification and the segment-wise classification. Correctly classified arteries are in red, correctly classified veins are in blue and the wrongly classified vessels are in yellow.
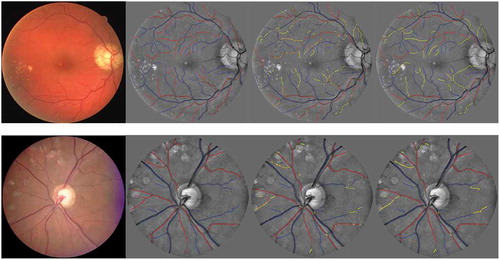
Figure 13. The Bland–Altman plots for comparing the (a) CRAE, (b) CRVE and (c) AVR values obtained by our method and the Vampire tool with the IVAN.
3.6. Curvature measurement
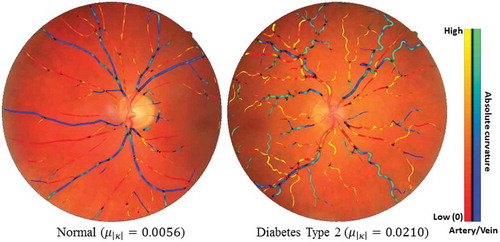
In , we provide two typical cases to show the curvature-based vessel tortuosity difference between a healthy subject and a diabetes type 2 subject.
Figure 14. Two typical examples of showing the tortuosity (mean curvature) difference between one healthy subject and one diabetes type 2 subject. Blue indicates veins and red indicates arteries.
Tortuosity measures and
were computed on images of the MESSIDOR data set (MESSIDOR Citation2014), consisting of 1200 images of diabetes patients which are graded for DR: R0 (no retinopathy), R1, R2 and R3 (severe retinopathy). All images are made with 45° FOV cameras, however, with varying image resolutions. In order to have approximately the same physical pixel size in all images, they are cropped and resized such that the FOV area spans a width of 1024 pixels. shows the distribution of feature values for different subgroups of the MESSIDOR data set. We observe an increase in both
and
with increasing severity grading of DR. Based on a Mann–Whitney U test (p-values reported in ), we conclude that all subgroups show a significant increase in
and
in comparison to the corresponding base groups (R0). For more details and validations, we refer Bekkers et al. (Citation2015).
Table 8. The relative error of the CRAE, CRVE and AVR values obtained by the proposed method, IVAN and Vampire tools.
Table 6. Tortuosity measures and
in the MESSIDOR data set.
3.7. FD measurement
To validate our measurements, we perform stability analysis of our fractal methods in terms of the choice of manual annotations, various ROI and different imaging modalities. The RE with respect to the binary images annotated by Observer 1 as the reference is used to investigate the variation of FDs.
The obtained FD values are compared with the coefficient of variation (relative standard deviations (RSD)) of all subjects in the DRIVE data set, which are 2.3%, 2.1% and 2.0% for ,
and
, respectively. We computed variations of the inter-group and intra-group FD (
) for the different groups of DR in the MESSIDOR data set. For images with different DR grades, the BD is calculated on the full image and also inside the ROI around the fovea. The averages and RSD of FD values for each separate DR group are shown in . We can see that the differences between the mean of FD values for different DR groups are small compared to the RSD of each DR group. The average of RSD in the different groups is higher than 2.5%.
Table 7. The mean and standard deviation of FD values () for different DR grades.
The results of multiple one-way ANOVA tests are shown in . With this test, we study whether a pair of sub-groups have different distributions. In the case of using the full FOV as ROI, there are no significant mean differences between any two groups, except in group pairs R0-R2 and R2-R3. For the circle ROI around the fovea, the mean difference is significant between the R0 and R2 and between the R1 and R2 groups. To validate our FD computation, we compared the FD values that were calculated from reference standards given by two experts within the circular ROI with . We used the FDs of Observer 1 as reference (Staal et al. Citation2004). The result is shown in .
Table 9. Comparison between FD values in different DR groups.
Table 10. The comparison of FD between two human observers and the automated vessel segmentation method.
Table 11. The comparison of values using different region of interest.
To investigate the associations of different ROIs with the fractal calculation, we also calculate the FD in various circular regions around the fovea centre of the DRIVE ground truth images annotated by Observer 1. The ROI radii are considered as (ROI1),
(ROI2) and
(ROI3), and ROI3 is used as reference for the RE calculation. The REs of changing the ROI are shown in . When FDs are calculated in ROI1, the maximum error of the BD is 3.8%, and the average error is 2.4%. If we use ROI2, the REs were smaller, with a maximum 1.0% and average 0.4% error.
4. Discussion and conclusion
In the vessel segmentation module explained in Section 2.1, considering the performance of the LAD filter-based segmentation method on the DRIVE and STARE data sets, the obtained results outperform most of the state-of-the-art unsupervised and supervised algorithms. Compared to the and
(0.7655 and 0.9704 for the DRIVE, and 0.7716 and 0.9701 for the STARE) of one of the best unsupervised approaches by Azzopardi et al. (Citation2015), the proposed LAD-based segmentation can respectively reach better sensitivity of 0.7858 and 0.8481 at the same specificity level. Also the LID-based algorithm can obtain the sensitivity 0.7702 and 0.7969, respectively, for the DRIVE and STARE at the same specificity. Compared with the supervised approaches, the proposed LAD method achieves similar or better results, as shown in . For the STARE data sets, we get higher sensitivity of 0.7791 than one of the best supervised methods by Fraz et al. (Citation2012a) with sensitivity of 0.7548 at the same specificity level, respectively. The LAD-based vessel segmentation method is an unsupervised technique, which does not rely on any labour-intensive training phase, but is still able to achieve similar performance compared to many of the supervised algorithms as shown in Table 0. In the vessel analysis pipeline, we consider to use the LAD filter-based segmentation method to achieve more accurate segmentation performance.
The OD and fovea locations are required to determine protocolised ROI for the assessment of signs related to vascular changes. In the proposed pipeline, the PSEF set-up is used for the simultaneous detection of OD and fovea. Compared with other techniques, this method does not require retinal blood vessel extraction and it is robust to imaging artefacts and different types of retinal lesions.
Artery/vein classification plays a critical role on follow-up steps of biomarker extraction. The proposed framework achieved an average pixel-wise accuracy of 83% on high-resolution retinal images (more than 3 megapixels) including the INSPIRE, NIDEK, Topcon and Canon data sets. Our module achieved an average accuracy of 92.0%, sensitivity of 89.6% and specificity of 91.3%, which is slightly better than the state-of-art methods. More importantly, our method performs both on both large and small vessels near the OD. These vessels are important in biomarker measurements such as CRVE, CRAE and AVR.
Based on vessel segmentation, an automatic technique for the vessel calibre measurement is designed for further CAD. In Section 3.5, we perform quantitative evaluations for our method and compare it with the semi-automatic tool IVAN and the manual vessel annotation tool Vampire. The experimental result shows the superiority of the proposed automatic vessel calibre measurement. The proposed method is able to provide automatic calibre measurements with a comparable system error and similar CRAE, CRVE measurements to IVAN. Additionally, evaluation of the computational efficiency is also provided to compare with the other two softwares which require time-consuming human intervention particularly for large-scale screening settings. The automatic vessel segmentation, artery/vein classification and vessel calibre measurement steps respectively take 2, 4 and 2 min on a single-core CPU. The calculation time is reduced to less than 1 min per image when a parallel setting with 12 cores and 2.30 GHz CPU is used.
In our proposed pipeline, the vessel tortuosity-based biomarkers are obtained by exploiting the curvature estimations based on the best exponential curve fits in orientation scores, as explained in Section 2.5. Both qualitative examples as shown in and and quantitative evaluations as shown in show that our method is a reliable tool for vessel curvature extraction. Evaluation on the clinical MESSIDOR data set shows strong positive correlations of the tortuosity measurements with different stages of DR, which implies high potential of using our method as an important component of the whole retinal vessel analysis pipeline for diabetes and DR diagnosis in large-scale screening settings.
The FD biomarkers in this paper are designed for large-scale retinal screening. It is essential to validate the robustness of the technique before using it in clinical study. Our results show that the classic FDs shall be calculated under very strict conditions, and tiny changes on the images and vessel segmentation can cause significant variations. We also compared the FD values based on the vessel annotations from DRIVE data set by two experts within the circular ROI with . We used the FDs of Observer 1 as reference. As shown in , the main difference between the two manual annotations is the presence of the tiny vessels. We found that miss-detecting the tiny vessels does affect the FD. The mean REs of 1.97%, 1.88% and 1.77% and maximal differences of 7.11%, 6.70% and 6.23% are obtained for
,
and
, respectively, which are noticeable compared to the calculated RSDs. Moreover, the results in show that FDs calculated in different ROIs are associated with each other, with p-values less than 0.01. This observation means the FDs calculated in different ROIs are significantly associated. The fact that a smaller ROI produces a lower FD in general implies that a fixed ROI is necessary in order to obtain comparable FD values.
In this paper, a fully automatic pipeline including vessel segmentation, the OD and fovea detection, artery and vein classification is applied to extract important vessel biomarkers. These biomarkers fall into three groups: vessel width, curvature (tortuosity) and FD. We have performed quantitative evaluation and analysis on the results from different modules in our pipeline. The validation is based on in total seven data sets. Currently, the needs of CAD systems for automatic screening programmes are still growing. An accurate and reliable feature computation pipeline plays a key role in a CAD framework. The validation results in this work show that the biomarkers/features computed from our pipeline tools are accurate compared to human measurements. Hence, it has the potential of being used in a CAD system to make large-scale screening programmes more effective.
Acknowledgements
This work is part of the NWO-Hé Programme of Innovation Cooperation No. 629.001.003 and the European Foundation for the Study of Diabetes/Chinese Diabetes Society/Lilly project. The authors appreciate the valuable suggestions and comments from the anonymous reviewers.
Disclosure statement
No potential conflict of interest was reported by the authors.
Additional information
Funding
Notes on contributors
Jiong Zhang
Jiong Zhang received the master’s degree in computer science from theNorthwest A&F University, Yangling, China, and the Ph.D. degree fromthe Eindhoven University of Technology, The Netherlands. He then joined as a Post-Doctoral Researcher with the Medical Image Analysis Group, Eindhoven University of Technology, The Netherlands. His research interests include ophthalmologic image analysis, medical image analysis, computer-aided diagnosis, and machine learning.
Behdad Dashtbozorg
Behdad Dashtbozorg received the master’s degree from Yazd University,Iran, and the Ph.D. degree in electrical engineering from the University of Porto, Portugal. He is currently a Post-Doctoral Researcher with the MedicalImage Analysis Group, Eindhoven University of Technology, The Netherlands. His research interests include medical image analysis, image processing, machine learning, and computer vision.
Fan Huang
Fan Huang received the M.Sc. degree in biomedical engineering from theEindhoven University of Technology, The Netherlands, where he is currentlypursuing the Ph.D. degree in biomedical engineering with the BiomedicalImage Analysis Group. His Ph.D. focus is on multiple biomarkers analysisfor diabetes retinopathy using retinal images. His research interest is in digital image analysis, machine learning, and pattern recognition.
Tao Tan
Tao Tan is currently an guest assistant professor with Biomedical Image Analysis (BMIA) at the Department of Biomedical Engineering at the Eindhoven University of Technology, and a consultant of Qview Medical Inc. Dr. Tan obtained his PhD from Diagnostic Image Analysis Group, Radiology, Radboud University Medical Center. His main research focuses on ultrasound image analysis including denoising, landmark segmentation, lesion segmentation, registration, computer-aided diagnosis and detection. He has led the development of one FDA approved and one CE approved product in medical imaging. He has served as a committee member, editorial member and reviewer for numerous international conferences and journals in the area of medical imaging.
B. M. ter Haar Romeny
Bart M. ter Haar Romeny received the M.Sc. degree in applied physics fromthe Delft University of Technology in 1979 and the Ph.D. degree from Utrecht University in 1983. He is currently a Professor of medical image analysis with Northeastern University, Shenyang, China, and with the Eindhoven University of Technology, The Netherlands. He is also a Project Leader of the RetinaCheck project. His research interests include brain-inspired medical image analysis and computer-aided diagnosis.
Notes
References
- Abbasi-Sureshjani S, Smit-Ockeloen I, Zhang J, ter Haar Romeny B. 2015. Biologicallyinspired supervised vasculature segmentation in slo retinal fundus images. In: Kamel Mohamed, Campilho Aurélio, editors. ICIAR 2015, LNCS. Heidelberg: Springer; p. 325–334.
- Abr`Amoff MD, Garvin MK, Sonka M. 2010. Retinal imaging and image analysis. IEEE Rev Biomed Eng. 3:169–208.
- Aliahmad B, Kumar DK, Sarossy MG, Jain R. 2014. Relationship between diabetes and grayscale fractal dimensions of retinal vasculature in the indian population. BMC Ophthalmol. 14(1):152.
- Amerasinghe N, Aung T, Cheung N, Fong CW, Wang JJ, Mitchell P, Saw S-M, Wong TY. 2008. Evidence of retinal vascular narrowing in glaucomatous eyes in an asian population. Invest Ophthalmol Vis Sci. 49(12):5397–5402.
- Antal B, Hajdu A. 2014. An ensemble-based system for automatic screening of diabetic retinopathy. Knowledge-Based Syst. 60:20–27.
- Aquino A. 2014. Establishing the macular grading grid by means of fovea centre detection using anatomicalbased and visual-based features. Comput Biol Med. 55:61–73.
- Aquino A, Gegundez ME, Marin D. 2012. Automated optic disc detection in retinal images of patients with diabetic retinopathy and risk of macular edema. Int J Biol Life Sci. 8(2):87–92.
- Azzopardi G, Strisciuglio N, Vento M, Petkov N. 2015. Trainable COSFIRE filters for vessel delineation with application to retinal images. Med Image Anal. 19(1):46–57.
- Bekkers E, Duits R, Berendschot T, ter Haar Romeny B. 2014b. A multi-orientation analysis approach to retinal vessel tracking. J Math Imaging Vis. 49(3):583–610.
- Bekkers E, Zhang J, Duits R, ter Haar Romeny B. Curvature based biomarkers for diabetic retinopathy via exponential curve fits in SE(2). In Proceedings of the Ophthalmic Medical Image Analysis Second International Workshop, OMIA 2015 Held in Conjunction with MICCAI, 2015, 113–120, 2015.
- Bekkers RD, ter Haar Romeny B. 2014a. Optic nerve head detection via group correlations in multiorientation transforms. Lecture Notes Comput Sci. 8815:293–302.
- Caselles V, Kimmel R, Sapiro G. 1997. Geodesic active contours. Int J Comput Vis. 22(1):61–79.
- Cheung CY-L, Lamoureux E, Kamran Ikram M, Bayu Sasongko M, Ding J, Zheng Y, Mitchell P, Wang JJ, Wong TY. 2012. Retinal vascular geometry in asian persons with diabetes and retinopathy. J Diabetes Sci Technol. 6(3):595–605.
- Dashtbozorg B, Zhang J, Huang F, ter Haar Romeny BM. 2016b. Automatic optic disc and fovea detection in retinal images using super-elliptical convergence index filters. In: Campilho A, Karray, editors. Image analysis and recognition, volume 9730 of lecture notes in computer science. Cham, Switzerland: Springer; p. 697–706.
- Dashtbozorg B, Abbasi-Sureshjani S, Zhang J, Bekkers EJ, Huang F, ter Haar Romeny BM. Infrastructure for retinal image analysis. In Proceedings of the Ophthalmic Medical Image Analysis Second International Workshop, OMIA 2016, Held in Conjunction with MICCAI 2016, 105–112, 2016a.
- Dashtbozorg B, Mendonc¸a AM, Campilho A. 2015. Optic disc segmentation using the sliding band filter. Comput Biol Med. 56:1–12.
- Dashtbozorg B, Mendonca AM, Penas S, Campilho A. Retinacad, a system for the assessment of retinal vascular changes. In Engineering in Medicine and Biology Society (EMBC), 2014 36th Annual International Conference of the IEEE, 6328–6331. IEEE, 2014a.
- Dashtbozorg B, Mendonca AM, Susana P, Campilho A. Computer-aided diagnosis system for the assessment of retinal vascular changes. In Proceedings of the Ophthalmic Medical Image Analysis First International Workshop, OMIA 2014, Held in Conjunction with MICCAI 2014, 9–16, 2014b.
- Dashtbozorg B, Zhang J, Abbasi-Sureshjani S, Huang F, ter Haar Romeny BM. Retinal health information and notification system (RHINO). In Proceedings of SPIE Medical Imaging, 10134, 1013437–1013437–6. International Society for Optics and Photonics, 2017.
- Doi K. 2007. Computer-aided diagnosis in medical imaging: historical review, current status and future potential. Comput Med Imaging Graphics. 31(4–5):198–211.
- Frangi A, Niessen W, Vincken K, Viergever M. Multiscale vessel enhancement filtering. In Medical Image Computing and Computer-Assisted Interventation (MICCAI 1998), 130–137. Springer, 1998.
- Fraz MM, Barman SA, Remagnino P, Hoppe A, Basit A, Uyyanon-Vara B, Rudnicka AR, Owen CG. 2012b. An approach to localize the retinal blood vessels using bit planes and centerline detection. Comput Methods Programs Biomed. 108(2):600–616.
- Fraz MM, Remagnino P, Hoppe A, Uyyanonvara B, Rudnicka AR, Owen CG, Barman SA. 2012a. An ensemble classification-based approach applied to retinal blood vessel segmentation. IEEE Trans Biomed Eng. 59(9):2538–2548.
- Gegundez-Arias ME, Marin D, Bravo JM, Suero A. 2013. Locating the fovea center position in digital fundus images using thresholding and feature extraction techniques. Comput Med Imaging Graphics. 37(5):386–393.
- Giachetti A, Ballerini L, Trucco E, Wilson PJ. 2013. The use of radial symmetry to localize retinal landmarks. Comput Med Imaging Graphics. 37(5):369–376.
- Giger ML. 2000. Computer-aided diagnosis of breast lesions in medical images. Comput Sci Eng. 2(5):39–45.
- Han H-C. 2012. Twisted blood vessels: symptoms, etiology and biomechanical mechanisms. J Vasc Res. 49(3):185–197.
- Honggang Y, Simon Barriga E, Agurto C, Echegaray S, Pattichis MS, Bauman W, Soliz P. 2012. Fast localization and segmentation of optic disk in retinal images using directional matched filtering and level sets. IEEE Trans Inf Technol Biomed. 16(4):644–657.
- Hoover A, Kouznetsova V, Goldbaum M. 2000. Locating blood vessels in retinal images by piecewise threshold probing of a matched filter response. IEEE Trans Med Imag. 19(3):203–210.
- Huang F, Dashtbozorg B, Shing Yeung AK, Zhang J, Berendschot TTJM, ter Haar Romeny BM. 2017b. A comparative study towards the establishment of an automatic retinal vessel width measurement technique. In: Cardoso M. Jorge, et al., Fetal, infant and ophthalmic medical image analysis. Cham, Switzerland: Springer; p. 227–234.
- Huang F, Dashtbozorg B, Tan T, Bart M ter Haar Romeny. 2018. Retinal artery/vein classification using genetic-search feature selection. Comput Methods Programs Biomed. 161:197–207.
- Huang F, Dashtbozorg B, ter Haar Romeny BM. 2017a. Artery/vein classification using reflection features in retina fundus images. Mach Vis Appl. 29(1): 1–12.
- Huang F, Dashtbozorg B, Zhang J, Bekkers E, Abbasi-Sureshjani S, Berend-Schot TTJM, ter Haar Romeny BM. 2016. Reliability of using retinal vascular fractal dimension as a biomarker in the diabetic retinopathy detection. J Ophthalmol. 2016(6259047):13.
- Huang F, Zhang J, Bekkers E, Dashtbozorg B, ter Haar Romeny B. Stability analysis of fractal dimension in retinal vasculature. In Proceedings of the Ophthalmic Medical Image Analysis Second International Workshop, OMIA 2015 Held in Conjunction with MICCAI 2015, 1–8, 2015.
- Ikram K, Janssen J, Roos A, Rietveld I, Witteman J, Breteler M, Hofman A, Van Duijn C, de Jong P. 2006. Retinal vessel diameters and risk of impaired fasting glucose or diabetes. Diabetes. 55(2):506–510.
- Kao E-F, Lin P-C, Chou M-C, Jaw T-S, Liu G-C. 2014. Automated detection of fovea in fundus images based on vessel-free zone and adaptive Gaussian template. Comput Methods Programs Biomed. 117(2):92–103.
- Kinsner W. 2008. A unified approach to fractal dimensions. Journal of Information Technology Research (Jitr). 1(4):62–85.
- Knudtson MD, Lee KE, Hubbard LD, Wong TY, Klein R, Klein BEK. 2003. Revised formulas for summarizing retinal vessel diameters. Curr Eye Res. 27(3):143–149.
- Kozegar E, Soryani M, Behnam H, Salamati M, Tan T. 2017. Breast cancer detection in automated 3d breast ultrasound using iso-contours and cascaded rusboosts. Ultrasonics. August;79:68–80. ISSN 1874-9968
- Lee J, Chung B, Zee Y, Li Q. 2013. Detection of neovascularization based on fractal and texture analysis with interaction effects in diabetic retinopathy. PLoS One. 8(12):e75699.
- Li Q, Feng B, Xie L, Liang P, Zhang H, Wang T. 2016. A cross-modality learning approach for vesselsegmentation in retinal images. IEEE Trans Med Imag. 35(1): 109–118, Jan, ISSN 0278-0062
- Lim LS, Mitchell P, Seddon JM, Holz FG, Wong TY. 2012. Age-related macular degeneration. Lancet. 379(9827):1728–1738.
- Lupa¸Scu CA, Tegolo D, Trucco E. 2010. FABC: retinal vessel segmentation using AdaBoost. IEEE Trans Inf Technol Biomed. 14(5):1267–1274.
- Mar´In D, Aquino A, Gegu´ndez-Arias ME, Bravo JM. 2011. A new supervised method for blood vessel segmentation in retinal images by using gray-level and moment invariants-based features. IEEE Trans Med Imag. 30(1):146–158.
- Marin D, Gegundez-Arias ME, Suero A, Bravo JM. 2015. Obtaining optic disc center and pixel region by automatic thresholding methods on morphologically processed fundus images. Comput Methods Programs Biomed. 118(2):173–185.
- Mendonc¸a AM, Sousa A, Mendonc¸a L, Campilho A. 2013. Automatic localization of the optic disc by combining vascular and intensity information. Comput Med Imaging Graphics. 37(5):409–417.
- Ng EYK, Rajendra Acharya U, Suri JS, Campilho A. 2014. Image analysis and modeling in ophthalmology. Boca Raton: CRC Press.
- Niemeijer M, Abr`Amoff MD, Van Ginneken B. 2009. Fast detection of the optic disc and fovea in color fundus photographs. Med Image Anal. 13(6):859–870.
- Niemeijer M, van Ginneken B, Cree MJ, Mizutani A, Quellec G, Sanchez CI, Zhang B, Hornero R, Lamard M, Muramatsu C, et al. Retinopathy online challenge: automatic detection of microaneurysms in digital color fundus photographs. IEEE Trans Med Imaging. 29: 185–195, 2010 Jan, ISSN 1558-254X
- Niemeijer M, Xu X, Dumitrescu A, Gupta P, van Ginneken B, Folk J, Abramoff M. Inspire-avr: Iowa normative set for processing images of the retina-artery vein ratio, 2011.
- Orlando J, Prokofyeva E, Blaschko M. 2016. A discriminatively trained fully connected conditional random field model for blood vessel segmentation in fundus images. IEEE Trans Biomed Eng. PP(99):1–10. ISSN 0018-9294.
- Patton N, Aslam TM, MacGillivray T, Deary IJ, Dhillon B, Eikelboom RH, Yogesan K, Constable IJ. 2006. Retinal image analysis: concepts, applications and potential. Prog Retin Eye Res. 25(1):99–127.
- Pourreza-Shahri R, Tavakoli M, Kehtarnavaz N. 2014. Computationally efficient optic nerve head detection in retinal fundus images. Biomed Signal Process Control. 11:63–73.
- Qiao H, Abr`Amoff MD, Garvin MK. 2013. Automated separation of binary overlapping trees in lowcontrast color retinal images. In: Mori Kensaku, Sakuma Ichiro, Sato Yoshinobu, Barillot Christian, Navab Nassir, editors. International conference on medical image computing and computer-assisted intervention. Berlin, Heidelberg: Springer; p. 436–443.
- Roychowdhury S, Koozekanani D, Parhi K. 2015. Iterative vessel segmentation of fundus images. IEEE Trans Biomed Eng. 62(7):1738–1749.
- Sasongko MB, Wong TY, Nguyen TT, Cheung CY, Shaw JE, Wang JJ. 2011. Retinal vascular tortuosity in persons with diabetes and diabetic retinopathy. Diabetologia. 54(9):2409–2416.
- Schram MT, Sep SJS, van der Kallen CJ, Dagnelie PC, Koster A, Schaper N, Henry RMA, Stehouwer CDA. 2014. The maastricht study: an extensive phenotyping study on determinants of type 2 diabetes, its complications and its comorbidities. Eur J Epidemiol. 29(6):439–451.
- Shijian L. 2011. Accurate and efficient optic disc detection and segmentation by a circular transformation. IEEE Trans Med Imaging. 30(12):2126–2133.
- Sinthanayothin C, Boyce JF, Williamson TH, Cook HL, Mensah E, Lal S, Usher D. 2002. Automated detection of diabetic retinopathy on digital fundus images. Diabetic Med. February;19:105–112. ISSN 0742-3071
- Somasundaram SK, Alli P. 2017. A machine learning ensemble classifier for early prediction of diabetic retinopathy. J Med Syst. November;41:201. ISSN 1573-689X
- Staal J, Abr`Amoff M, Niemeijer M, Viergever M, Bram VG. 2004. Ridge-based vessel segmentation in color images of the retina. IEEE Trans Med Imag. 23(4):501–509.
- Tan T, Mordang J-J, van Zelst J, Grivegne A, Gubern-Mrida A, Melendez J, Mann RM, Zhang W, Platel B, Karssemeijer N. 2015. Computer-aided detection of breast cancers using haar-like features in automated 3d breast ultrasound. Med Phys. April;42:1498–1504. ISSN 2473-4209
- Tan T, Platel B, Huisman H, S´Anchez CI, Mus R, Karssemeijer N. 2012. Computeraided lesion diagnosis in automated 3-d breast ultrasound using coronal spiculation. IEEE Trans Med Imaging. 31(5):1034–1042.
- Tan T, Platel B, Mus R, Tabar L, Mann RM, Karssemeijer N. 2013. Computer-aided detection of cancer in automated 3-d breast ultrasound. IEEE Trans Med Imaging. 32(9):1698–1706.
- Tavakoli M, Shahri RP, Pourreza H, Mehdizadeh A, Banaee T, Bahreini Toosi MH. 2013. A complementary method for automated detection of microaneurysms in fluorescein angiography fundus images to assess diabetic retinopathy. Pattern Recognit. 46(10):2740–2753.
- TECHNO-VISION MESSIDOR. Messidor: methods to evaluate segmentation and indexing techniques in the field of retinal ophthalmology. 2014. Available on: http://messidor.crihan.fr/index-en. php Accessed: 2014 Oct 9.
- Tuomilehto J, Lindstr¨Om J, Eriksson JG, Valle TT, H¨Am¨Al¨Ainen H, IlanneParikka P, Keina¨nen-Kiukaanniemi S, Laakso M, Louheranta A, Rastas M, et al. 2001. Prevention of type 2 diabetes mellitus by changes in lifestyle among subjects with impaired glucose tolerance. N Engl J Med. 344(18):1343–1350.
- Tuso P. 2014. Prediabetes and lifestyle modification: time to prevent a preventable disease. Perm J. 18:88–93. ISSN 1552-5775.
- Van Ginneken B, ter Haar Romeny BM, Viergever MA. 2001. Computer-aided diagnosis in chest radiography: a survey. IEEE Trans Med Imaging. 20(12):1228–1241.
- Welikala RA, Dehmeshki J, Hoppe A, Tah V, Mann S, Williamson TH, Barman SA. 2014. Automated detection of proliferative diabetic retinopathy using a modified line operator and dual classification. Comput Methods Programs Biomed. May;114:247–261. ISSN 1872-7565
- Wong TY, Chong EW, Wong W-L, Rosman M, Aung T, Loo J-L, Shen S, Loon S-C, Tan DTH, Shyong Tai E, et al. 2008. Prevalence and causes of low vision and blindness in an urban malay population: the singapore malay eye study. Arch Ophthalmol. 126(8):1091–1099.
- World-Health-Organization. Prevention of blindness from diabetes mellitus: report of a WHO consultation in Geneva, Switzerland, 9–11 November 2005. World Health Organization, 2006.
- Yang Y, Chan L. 2016. Monogenic diabetes: what it teaches us on the common forms of type 1 and type 2 diabetes. Endocr Rev. June;37:190–222. ISSN 1945-7189
- Yin B, Huating L, Sheng B, Hou X, Chen Y, Wen W, Ping L, Shen R, Bao Y, Jia W. 2015. Vessel extraction from non-fluorescein fundus images using orientation-aware detector. Med Image Anal. 26(1):232–242.
- You X, Peng Q, Yuan Y, Cheung Y-M, Lei J. 2011. Segmentation of retinal blood vessels using the radial projection and semi-supervised approach. Pattern Recogn. 44(10):2314–2324.
- Yu H, Barriga S, Agurto C, Echegaray S, Pattichis M, Zamora G, Bauman W, Soliz P. 2011. Fast localization of optic disc and fovea in retinal images for eye disease screening. In: Ronald M. Summers, Bram van Ginneken, editors, SPIE Medical Imaging. Lake Buena Vista(Orlando), FL: International Society for Optics and Photonics; p. 796317–796317.
- Zhang B, Zhang L, Zhang L, Karray F. 2010. Retinal vessel extraction by matched filter with first-order derivative of Gaussian. Comput Biol Med. 40(4):438–445.
- Zhang J, Bekkers E, Abbasi S, Dashtbozorg B, ter Haar Romeny B. 2015. Robust and fast vessel segmentation via gaussian derivatives in orientation scores. In: Murino V, Puppo E, editors. Image analysis and processing, volume 9279 of lecture notes in computer science. Cham, Switzerland: Springer; p. 537–547.
- Zhang J, Dashtbozorg B, Bekkers E, Pluim J, Duits R, ter Haar Romeny B. 2016a. Robust retinal vessel segmentation via locally adaptive derivative frames in orientation scores. IEEE Trans Med Imaging. 35(12):2631–2644. ISSN 0278-0062.
- Zhang J, Duits R, Sanguinetti G, ter Haar Romeny BM. 2016b. Numerical approaches for linear left-invariant diffusions on SE(2), their comparison to exact solutions, and their applications in retinal imaging. Numer Math Theor Meth Appl. 9(1):1–50.