
 ?Mathematical formulae have been encoded as MathML and are displayed in this HTML version using MathJax in order to improve their display. Uncheck the box to turn MathJax off. This feature requires Javascript. Click on a formula to zoom.
ABSTRACT
Lung cancer is a leading cause of cancer-related deaths. Computer-aided detection (CAD) has emerged as a valuable tool to assist radiologists in the automated detection and segmentation of pulmonary nodules using Computed Tomography (CT) scans, indicating early stages of lung cancer. However, detecting small nodules remains challenging. This paper proposes novel techniques to address this challenge, achieving high sensitivity and low false-positive nodule identification using the RePoint-Net detection networks. Additionally, the 3DSqU2 Net, a novel nodule segmentation approach incorporating full-scale skip connections and deep supervision, is introduced. A 3DCNN model is employed for nodule candidate classification, generating final classification results by combining previous step outputs. Extensive training and testing on the LIDC/IDRI public lung CT database dataset validate the proposed model, demonstrating its superiority over human specialists with a remarkable 97.4% sensitivity in identifying nodule candidates. Moreover, CT texture analysis accurately differentiates between malignant and benign pulmonary nodules due to its ability to capture subtle tissue characteristic differences. This approach achieves a 95.8% sensitivity in nodule classification, promising non-invasive support for clinical decision-making in managing pulmonary nodules and improving patient outcomes.
1. Introduction
Lung cancer is a significant global health concern, responsible for a considerable number of cancer-related deaths worldwide. Early detection and accurate diagnosis of lung cancer are crucial for improving patient outcomes. Pulmonary nodules, which are small lesions in the lungs, can potentially indicate lung cancer. However, not all nodules are malignant, making it essential to distinguish between benign and malignant nodules to determine appropriate treatment options (Wang et al. Citation2019). With the increasing use of CT for diagnosing various diseases, the detection of pulmonary nodules in asymptomatic patients has become more challenging (Lokhandwala et al. Citation2017). The evaluation process involves two interconnected steps: assessing clinical parameters such as age, smoking history, family history, signs and symptoms, associated lung diseases, exposure, and previous medical history, and conducting imaging evaluation, where factors like nodule size, density, growth, and doubling time play a crucial role in evaluating the possibility of malignancy. Morphologic features, such as size, margins, contour, and internal characteristics, can also aid in distinguishing between benign and malignant lesions (Zhou et al. Citation2020).
Currently, the diagnosis of lung diseases primarily relies on manual annotation of medical images to detect tumours. However, this process is prone to errors and can be time-consuming. Moreover, different experts may annotate the same tumour differently, leading to non-overlapping parts of the tumours or nodules overlapping with anatomical structures. These factors can negatively impact the accuracy of the diagnosis. Therefore, there is a need for reliable, accurate, and automated detection processes, such as automatic or semi-automatic annotation algorithms. Such algorithms are essential for streamlining clinical workflows and facilitating prompt decision-making for patient treatments (NIH Citation2015).
Deep learning, a subfield of artificial intelligence, has found increasing applications in medical imaging analysis, including pulmonary nodule classification. This approach involves training neural networks to recognise patterns in radiological images and make accurate predictions based on those patterns. Several studies have reported successful results using deep learning algorithms to identify and classify pulmonary nodules (Singh et al. Citation2020).
Chest radiography and CT are two imaging modalities that have been recently employed for lung nodule detection and diagnosis. Pulmonary nodules exhibit significant differences in size, shape, and classification on CT scans of the lungs (Shi et al. Citation2020). However, detecting the small target size of pulmonary nodules on a single CT scan is challenging. Moreover, some non-nodular pulmonary interstitials may have similar morphological characteristics to nodules, making identification difficult (Hussain et al. Citation2015). Therefore, there is a need for CAD techniques to accurately diagnose lung cancer, utilising artificial neural networks, pattern recognition, and image processing methods (Bray et al. Citation2018).
This paper addresses the classification of pulmonary nodule candidates in CT images as nodules or non-nodules. We propose a new CAD system for nodule identification, utilising a deep convolutional neural network (CNN) method based on a nodule adaptive model. The approach incorporates 3D spatial and contextual information, generating multiple discriminating feature maps for nodule candidate detection. To enhance object detection for candidate nodule detection, we combine a region-proposed network (RPN) with local key-points. To improve the accuracy of detection, key-point anchors are introduced to rectify deficiencies in RPN. The CAD system also includes a for nodule segmentation, utilising a parallel network structure that allows for feature reuse and overcomes limitations of the traditional U-Net. Finally, a 3DCNN architecture is employed for classifying nodules as benign or malignant.
In summary, our proposed CAD system for pulmonary nodule identification aims to enhance the accuracy and efficiency of nodule detection and classification in CT images. This research contributes to the field by providing a framework for nodule candidate detection, a novel structure to address over-fitting, and an advanced segmentation method. Through extensive evaluation on the LIDC-IDRI dataset, our proposed system demonstrates impressive results, showcasing its potential for enhancing medical image segmentation. Overall, our study offers a comprehensive approach to improve the detection and classification of pulmonary nodules, thus advancing the field of lung cancer diagnosis. Key contributors of this paper include:
A framework for detecting nodule candidates based on a region-proposed network and rep-point method.
The evaluation of suggested 3D RPN and rep-point lung nodule detection networks using the LIDC-IDRI dataset, namely RePoint-Net.
The use of a novel structure in the RePoint-Net model to address significant over-fitting and improve segmentation generalisation and achieve outstanding performance in small nodule identification.
The proposed
method that enables the use of ResNet and Dense-Net to overcome the gradient vanishing problem.
The development of a novel Dense-Net parallel network with skip links to maintain a high-resolution feature map and enable deeper networks.
The introduction of a 3DCNN architecture to reduce false-positive candidates in nodule classification.
The combination of nodule candidate detectors and nodule segmentation architecture to produce improved results.
2. Relate work
New studies have shown that effective lung nodule detection may be accomplished using end-to-end learning methods. It has been possible to detect pulmonary nodules by applying filter algorithms that take into consideration the nodule features (Uijlings et al. Citation2013). Because of its outstanding performance and low false-positive rate, faster R-CNN was also employed in nodule detection (Khosravan and Bagci Citation2018; Xie et al. Citation2019). For instance, previous researchers developed models for the feature of false-positive reduction by selecting the most appropriate supervised classification method and handcrafted feature (Ding et al. Citation2017).
To automatically extract features from CT scans for the detection of lung cancer (Sun et al. Citation2017), designed an end-to-end machine learning architecture. By rotating nodule slices annotated by the markups of four expert radiologists, the nodules were segmented and resampled, resulting in 13,668 samples. CNN, deep belief networks (DBN), and stacking denoising autoencoder are three multichannel ROI-based deep learning algorithms that have been developed (SDEA).
The hybrid deep learning framework proposed by (Huang et al. Citation2019) showed impressive performance in the detection and classification of pulmonary nodules. The 2D CNN achieved a detection sensitivity of 89.7% at 4 false positives per scan, while the 3D CNN achieved an accuracy of 94.1% for nodule classification. The approach significantly outperformed other methods on both tasks, including radiologists and several deep learning models.
In (Liu et al. Citation2022), the proposed deep learning model achieved high sensitivity and specificity in detecting lung nodules with different sizes and shapes. The authors reported a sensitivity of 88.6% and a specificity of 97.8% for nodule detection sensitivity of 85.7% and a specificity of 96.7% for nodule classification. They also compared their approach with traditional machine learning methods and found that the deep learning model significantly outperformed them.
Faster RCNN blends RPN with Fast RCNN to speed the detection process and replaces the feature extractor (Uijlings et al. Citation2013) with the RPN to provide high-quality proposals. Exceptionally, 3DCNNs have been used to train a nodule detection network from end to end (Khosravan and Bagci Citation2018). By using a faster R-CNN, an RPN to create region proposals, and a detection network to detect objects from recommendations, a number of pulmonary nodule detection methods have been developed (Faster Citation2015). A faster R-CNN was constructed upon a 3DRPN with an encoder-decoder structure (Liao et al. Citation2019), and a faster R-CNN model with dual-path blocks was developed to take advantage of residual learning and dense connections for nodule detection (Zhu et al. Citation2018b). In particular, a 2D faster R-CNN model for candidate detection was followed by a 3DCNN for false positive (FP) reduction (Ding et al. Citation2017), and a faster R-CNN model was built upon a faster RPN. The unbalanced sample problem, or the situation when the number of negative samples is greater than the number of positive ones, makes it difficult to identify nodule candidates using any of these approaches.
The region recommendations are generated by training the faster RCNN’s region proposal network layer (Ren et al. Citation2017). To obtain much better regression models for the bounding boxes of multi-scale objects, different anchors are developed in RPN.
A 2D Faster R-CNN (RPN + Fast R-CNN) with a feature extraction based on VGG-16 (Simonyan and Zisserman Citation2014) and pre-trained on ImageNet was employed by (Ding et al. Citation2017b) to provide a solution. The second component is a 3D CNN with three fully connected layers and six convolutional layers. The deconvolution layer, which comes after the VGG-16 network in their solution’s feature extraction process, is one of its interesting features. By doing this, the feature map’s down-sampling ratio from the input is decreased. The number of anchors they used-six, ranging in size from 4 to 32 mm – led to a significant computational cost. Screening a whole CT scan probably takes time because the network can only view three slices simultaneously.
Candidate discovery and false-positive reduction are typically the two key phases of the nodule detection system. Previous studies have focused on FP reduction using 2D CNNs or 3D CNNs (Dou et al. Citation2017; Jin et al. Citation2018). Without a doubt, candidate detection also plays a significant role in a complete system since it determines the maximum sensitivity of nodule detection.
A 2D nodule detection and FPR method was proposed by Xie et al (Xie et al. Citation2019). In order to identify potential nodules, the Faster RCNN was first employed. For the middle three slices of the nodule, two RPNs were used for fusing, and a deconvolutional layer was used. The two extra neighbouring slices were used as inputs. Second, a 2D CNN-based boosting architecture for FPR is proposed. The model is retrained using incorrectly categorised data to further increase the sensitivity of detection. By combining the significant effects of those networks, the final classification results are created.
Previous work in this field has developed 3D semantic segmentation (Setio et al. Citation2017) and 3D objection detection (Ding et al. Citation2017; Zhu et al. Citation2018a) for candidate detection and achieved promising results. However, it is still challenging to detect small nodules, e.g. nodules smaller than 5 mm. A potential solution for small nodule detection is voxel-wise detection. Unfortunately, voxel-by-voxel detection may demand more computing power, which may not suit our target clinical applications, where processing speed is also essential.
In terms of candidate proposal, applying filter algorithms considering the nodule characteristics has been feasible in pulmonary nodule detection (Uijlings et al. Citation2013). Recently, faster R-CNN has also been introduced in nodule detection (Zhu et al. Citation2018b; Liao et al. Citation2019) due to its outstanding objective detection performance. For instance, previous researchers developed models by determining an optimal handcrafted feature and supervised classification algorithms in the facet of false-positive reduction.
(Masood et al. Citation2019) proposed that M-RPN (Multi-Region Proposal Network) employees modify the VGG-16 baseline to five convolution layers integrated with a deconvolution layer. Then nodule detection is carried out by the different levels of RPN. A cloud-based 3D DCNN (3D Deep CNN) inspired by RESNET-101 is used for FP reduction. (Cao et al. Citation2019). MBEL-3D-CNN (Multi-Branch Ensemble 3D-CNN) incorporates an ensemble of three 3D MB models: VGGNet, ResNet, and DenseNet. Each was fed a 3D lung image at three different scales. Each model predicts the probability independently and fuses the results to predict the nodule. (Gu et al. Citation2018) proposed a 3D deep CNN with multi-scale prediction strategies to detect lung nodules from the segmented image. The 3D CNN performs much better and has richer features than the 2D CNN. In addition to 3D CNN, a multi-scale lung nodule prediction strategy was applied to small nodules with cube clustering techniques.
In (Nguyen and Lee Citation2019) proposes a new polyp segmentation method based on the architecture of a multiple deep encoder-decoder network combination called CDED-net. The architecture can hold multilevel contextual information by extracting discriminative features at different practical fields of view, multiple image scales, and learning-rich information features from missing pixels in the training phase. Moreover, the network is also able to capture object boundaries by using multi-scale practical decoders. Also (Al-Shabi et al. Citation2019), proposed a novel strategy for improving the method’s segmentation performance based on a combination of a boundary-emphasis data augmentation method and a new helpful dice loss function. This strategy aims to make the proposed deep learning network available with poorly defined object boundaries caused by the non-specific transition zone between the background and foreground regions.
This study proposed (Desai et al. Citation2019) a novel CNN architecture called Gated-Dilated (GD) networks to classify nodules as malignant or benign. Unlike previous studies, the GD network uses multiple dilated convolutions instead of max-pooling to capture the scale variations. Moreover, the GD network has a context-aware sub-network that analyzes the input features and guides them to a suitable dilated convolution. The proposed network was evaluated on more than 1,000 CT scans from the LIDC-LDRI dataset. This proposed network outperforms state-of-the-art baseline models, including Multi-Crop, Resnet, and DenseNet, with an AUC of > 0.95. Compared to the baseline models, the GD network improves the classification accuracy of mid-sized nodules. Furthermore, the relationship between the size of the nodule and the context-aware sub-network attention signal validates network architecture.
The paper introduces Fourier Spectral Pooling (FSP) (Rippel et al. Citation2015), which reduces dimensionality by truncating the frequency domain representation. This approach preserves significantly more information per parameter than other pooling strategies and offers flexibility in choosing the pooling output dimensionality. Additionally, this representation allows for a new form of stochastic regularisation through randomised modification of resolution. The methods presented in the paper achieve competitive results on classification and approximation tasks without the use of dropout or max-pooling.
In this work (Men et al. Citation2018), the goal is to further improve segmentation accuracy by introducing a novel CNN named CAC-SPP, which incorporates Cascaded Atrous Convolution (CAC) and a spatial pyramid pooling (SPP) module. Notably, this is the first attempt at applying SPP to segmentation in radiotherapy. The study enhances the network based on ResNet-101, resulting in accuracy gains due to significantly increased depth. CAC is integrated to extract a high-resolution feature map while maintaining a large dataset.
T-Net (Jun et al. Citation2019) overcomes the U-Net limitation that only one set of concatenated layers can exist between the encoder and decoder blocks. To be more precise, the concatenated layers are created symmetrically by the U-Net, and as a result, the low-level feature of the encoder is connected to the feature’s later portion, which is connected to the decoder’s starting point. During the encoder process, T-Net properly sets up pooling and up-sampling. In a single block, feature maps of varied sizes are also created during the decoding process. As a result, the decoder obtains all of the encoder’s features – from the low-level to the high-level – right away in order to predict a mask with more accuracy.
For automated feature extraction and pulmonary candidate classification as nodule or non-nodule, this paper (Tran et al. Citation2019) employed a 15-layer 2D deep CNN architecture. The model’s classification accuracy was then evaluated using the LIDC/IDRI dataset obtained by the LUNA16 challenge, and the focus loss function was applied to the training procedure to enhance it. The experiments demonstrated that deep learning with focus loss produced a high-quality classifier with accuracy, sensitivity, and specificity of 97.3%, 96.0%, and 97.2%.
To classify lung nodule candidates as nodules or non-nodules, Li et al (Li et al. Citation2016) proposed a 2D deep convolutional neural network. The LIDC/IDRI dataset’s 1,010 CT scans provided as regions-of-interest (ROI) image patches were used to train and evaluate the proposed network. Out of the 62,492 patches, 62772 lung nodules and 21,720 non-nodules. In experiments, the approach can classify lung nodules with maximum accuracy and sensitivity of 86.4% and 89.0%, respectively.
All candidate detection and false-positive reduction are achieved by ConvNets in (Zagoruyko and Komodakis Citation2016). CT images are resampled to an isotropic resolution of 0.5 mm as part of the preprocessing process. Based on the probability map provided by U-Net, candidate detection is extracted. Using the supplied folds from LUNA16, cross-validation training was performed on the candidate detection and false-positive reduction steps.
In their paper, (Khan et al. Citation2020) propose an integrated design for lung cancer classification using CT images. They introduce a method that combines contrast-based classical features fusion and selection techniques to enhance the accuracy of lung cancer detection. By integrating different features and selecting relevant information, the authors demonstrate improved classification performance and provide valuable insights into the application of these techniques for lung cancer analysis with CT images.
(Khan et al. Citation2022). present a unified framework for skin lesion segmentation and classification. They focus on leveraging deep neural network features fusion and selection to enhance the accuracy of skin lesion analysis. The authors present a comprehensive approach that integrates multiple deep-learning models and selects informative features to improve the performance of skin lesion segmentation and classification tasks. This framework offers valuable insights into the fusion and selection techniques applied to skin lesion analysis using deep neural networks.
(Sharif et al. Citation2021) propose a decision support system for multimodal brain tumour classification. The authors utilise deep learning algorithms to analyse different modalities of brain tumour imaging data. By integrating multiple modalities and applying deep learning techniques, they develop a system that can accurately classify brain tumours. This paper highlights the potential of deep learning in improving brain tumour analysis and classification tasks.
(Zafar et al. Citation2023). present a comprehensive survey on skin lesion analysis and cancer detection based on machine/deep learning techniques. The survey provides an overview of the current state of research in this field, covering various approaches, algorithms, and methods used for skin lesion analysis and cancer detection. The authors discuss the benefits and challenges associated with different machine and deep learning techniques employed in this area. Overall, this survey serves as a valuable resource for understanding existing knowledge, identifying gaps, and exploring future directions in skin lesion analysis and cancer detection research.
The paper (Zhang et al. Citation2023) presents a novel approach called SNELM (squeezeNet-guided ELM) for the automated diagnosis of COVID-19 using chest images. The authors emphasise the importance of accurate and efficient diagnosis considering the global impact of the pandemic. They propose a hybrid model that combines squeezeNet for feature extraction and extreme learning machine (ELM) for classification. SqueezeNet is utilised to reduce computational complexity and memory requirements, while ELM ensures efficient training and rapid recognition of COVID-19. The authors conclude that SNELM has the potential to be implemented as an effective tool for automated COVID-19 diagnosis from chest images.
The paper (Wang et al. Citation2021) proposes a state-of-the-art deep learning model, named AVNC (Attention-based VGG-style Network with CBAM), to effectively diagnose COVID-19 through the analysis of chest X-ray images. By integrating attention mechanisms, the AVNC model demonstrates significant potential for accurately detecting COVID-19 cases. These attention mechanisms effectively direct the model’s focus towards critical features, resulting in enhanced performance and minimised diagnostic errors.
The paper (Han et al. Citation2019) makes a significant contribution to the field of lung CT analysis by focusing on the automatic recognition of cavity imaging signs. The authors propose a novel approach that combines hybrid resampling and multi-feature fusion techniques to improve the accuracy of cavity imaging sign detection. Their method addresses the challenges associated with imaging protocol variability and enhances the robustness of the recognition system. The experimental results demonstrate promising performance in accurately detecting and classifying cavity imaging signs in lung CT scans. This research provides valuable insights for improving the diagnosis and treatment planning of lung diseases associated with cavity imaging signs.
The paper (Ayaz et al. Citation2021) presents an important contribution to the field of pulmonary nodule detection. The authors address the challenge of limited annotated datasets by proposing a data augmentation strategy to enhance the performance of deep learning-based detection systems. Through various image transformations and synthetic nodule insertion techniques, they augment the training dataset, increasing its diversity and size. The experimental results demonstrate a significant improvement in detection accuracy, highlighting the effectiveness of their data augmentation approach. This research emphasises the critical role of comprehensive and diverse training data in achieving high accuracy in deep learning-based pulmonary nodule detection systems.
This comprehensive survey (Umer and Sharif Citation2022) delves into the emerging field of quantum machine learning and its potential applications in the medical domain. The authors explore the integration of quantum computing concepts with classical machine learning algorithms, offering insights into how quantum machine learning can enhance medical data analysis, diagnostics, and treatment planning. In this paper (Hasan et al. Citation2022), the authors present a novel machine learning framework for early-stage detection of autism spectrum disorders (ASD). By analysing behavioural patterns and utilising machine learning algorithms, the framework aims to identify ASD at its initial stages, enabling early intervention and improving the quality of life for affected individuals.
Zhang et al (Wu et al. Citation2023) proposed a deep learning-based framework for nodule detection that achieved promising results. Their method utilised a combination of 3D CNN and attention mechanisms to improve nodule detection accuracy. Additionally, Liu et al (Ding et al. Citation2022) developed a novel deep learning model for pulmonary nodule classification. Their approach employed a combination of 3D CNN and graph convolutional networks to capture both local and global features of nodules, resulting in improved classification performance. Furthermore, Li et al (Ni et al. Citation2023) proposed a texture analysis-based method for distinguishing between benign and malignant pulmonary nodules. Their approach leveraged advanced machine learning techniques to extract texture features and achieved high accuracy in nodule classification. Despite these advancements, there is still a need for further research to address the challenges in nodule detection and classification, particularly in the context of small nodules. Our proposed work aims to address these limitations and enhance the performance of pulmonary nodule classification systems.
3. Method
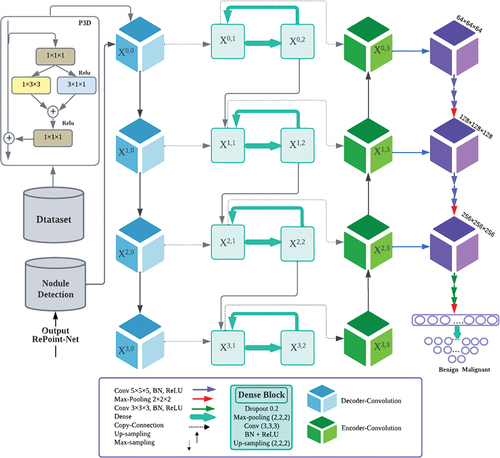
illustrates the structure of our proposed method for identifying lung nodules in CT images. The proposed method emerges as a powerful tool for CAD systems, delivering exceptional accuracy. The methodology combines RePoint-Net for region proposal generation with a U-net-like approach for efficient deep learning. Leveraging the U-net model’s proficiency in pixel-wise labelling significantly improves the precision of candidate nodule generation and identification. By integrating these techniques, the overall performance and accuracy of the method are greatly amplified, establishing it as a valuable asset within CAD systems. Our algorithm comprises several components that work together to quickly and effectively identify lung nodules:
Figure 1. Proposed framework of nodule identification. Graphical illustration of the proposed pipeline that contains three modules. RePoint-Net was trained with dataset LIDC/IDRI the trained model as nodule or non-nodule. The model segmented of lung and nodules of detected in RePoint-Net. classification of nodules candidate by proposed 3DCNN as nodule benign or nodule malignant.
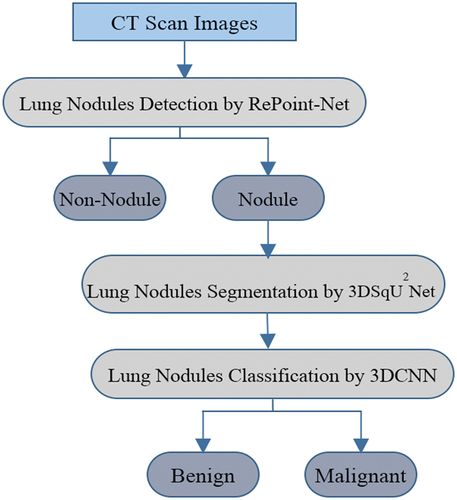
Candidate discovery with RePoint-Net to accurately locate lung nodules;
Improved U-Net-based segmentation for precise segmentation of the initial nodule mask and lung region, leading to enhanced analysis accuracy;
Nodule classification using 3DCNN-based methods to reduce false positives;
Segmentation of detected nodules, resulting in the identification of pulmonary nodules.
3.1. Dataset
This dataset is a subset of the LIDC/IDRI dataset (Setio et al. Citation2017), which is publicly available. The Lung Image Database Consortium (LIDC) and Image Database Resource Initiative (IDRI) dataset are highly regarded in the field of medical image analysis. It comprises a vast collection of CT scans of the chest from over 1,000 patients, accompanied by expert annotations of pulmonary nodules. The primary purpose of creating this dataset was to facilitate the development and evaluation of CAD systems for the early detection of lung cancer. Researchers have extensively utilised the LIDC/IDRI dataset in various medical imaging applications, including deep learning-based approaches for nodule detection and segmentation, radionics-based studies for predicting lung cancer risk, and texture analysis for distinguishing between malignant and benign nodules. Additionally, the dataset has served as a benchmark for evaluating different CAD systems.
3.2. Pre-processing
Pre-processing steps conducted in this study were essential for converting DICOM files into a suitable PNG format and preparing the data for accurate nodule detection. This section provides a more detailed explanation of the preprocessing steps that were undertaken. Firstly, the window setting of the CT scans was adjusted from −1000 Hounsfield Units (HU) to 400 HU, enabling better visualisation of lung structures and nodules within the scans. Additionally, the pixel values were modified to ensure they fell within the range of 0 to 255, allowing for standardisation and compatibility with the deep learning model. It is crucial to explicitly mention that the removal of unwanted information was a fundamental aspect of the preprocessing stage.
The presence of inconsistent scanning planes in the LIDC-IDRI dataset led to distorted and inaccurate images, posing challenges for precise nodule detection. To overcome this issue, an interpolation method was employed to resize all the images to a uniform spacing of 1 mm, ensuring standardised data across scans and improving the accuracy of nodule detection. However, it is important to note that interpolation methods have inherent drawbacks that should be taken into consideration. Furthermore, lung parenchyma segmentation was performed as part of the preprocessing steps to enhance the accuracy of nodule detection. This involved applying a threshold to differentiate the lung parenchyma from other body parts, effectively eliminating irrelevant information at the borders while preserving the texture of nodule boundaries.
To further enhance the detection accuracy of the 3DCNNs, the localisation process incorporated three planes: axial, coronal, and sagittal. Additionally, 10 mm axial maximum intensity projection (MIP) (Harvey et al. Citation2019) slices were included. Initially, the output candidates were identified on the coronal and sagittal planes before being converted back to axial coordinates. Candidates were also merged if their largest radius was smaller than 0.88 times the central distance between them. This merging approach, based on experimentation, aimed to improve the overall accuracy of the system.
3.3. Detection and segmentation of nodules lung
Detecting pulmonary nodules automatically is a crucial task that entails analysing CT images to accurately locate nodules. The main objective of this task is to achieve precise identification of nodules with high sensitivity while minimising the occurrence of false positives in each scan. To effectively address this challenge, we propose a pulmonary nodule identification system that utilises multi-scale networks for detection, segmentation, and classification of pulmonary nodules. The proposed framework for nodular identification is illustrated in .
Proposal network RPN, a type of neural network frequently used for object recognition tasks. The RPN analyzes CT scan images of the lungs and automatically detects suspicious areas that require further investigation. To identify nodules in lung parenchyma images, a multi-step process is employed. Firstly, the original CT image is pre-processed to obtain lung parenchyma images. These images are then input into a feature extraction network that extracts significant features. Subsequently, the resulting feature map undergoes RPN and RoI operations to identify potential nodule positions and their probabilities. Finally, a false positive reduction network is applied to eliminate false positives among the candidate nodules, leading to the final output.
To segment the identified lung nodules, U-Net, a U-shaped convolutional neural network architecture is used. This process helps physicians accurately locate and measure the size and shape of nodules, which is essential in the diagnosis and treatment of lung cancer. U-Net has been successful in segmenting lung nodules with high accuracy and efficiency, making it suitable for clinical applications. By combining RPN and U-Net techniques, automatic detection, segmentation, and classification of lung nodules in medical images become possible. RPN identifies problematic regions in CT scan images of the lungs, which are segmented and have their features extracted by U-Net. This approach has shown promising results in detecting, segmenting, and classifying lung nodules with high accuracy and efficacy, potentially improving the accuracy of lung cancer diagnosis and aiding in the development of personalised treatment plans for patients.
3.4. Detection nodules by RePoint-Net
In this section, the proposed method for detecting pulmonary nodules is reviewed. Accurate patch segmentation of the nodule from the given CT image is required. The regional network aims to improve the original RPN of Faster R-CNN (Zhu et al. Citation2018b)for predicting bounding boxes for nodules. The RPN generates suggested regions by sliding windows on the feature map across anchors with different scales and aspect ratios, as CT lung images typically contain nodules of varied sizes and aspect ratios.
To improve the standard anchor boxes, anchor sizes were determined using the K-means-IoU clustering technique. The k-means algorithm is applied for clustering data based on prototype distance evaluation, which is commonly used in clustering scenarios due to its simplicity and efficiency. The RPN employs the k-means algorithm to generate k initial anchor boxes. The feature map extracted by the convolutional neural network, represented by the largest rectangle in the graphic, is proportional to the size of the nodules. Suitable anchors have been shown to play a critical role in the detection process (NIH Citation2015). At each location on the RPN’s feature map, anchor boxes are generated, and they are used to determine the maximum IoU for each ground-truth annotation.
ResNet-50 and ResNet-101 serve as backbones with the Feature Pyramid Network (FPN). The anchor boxes generated by k-means-IoU replace the anchor boxes generated in ResNet-50 and ResNet-101, considering different ratios and sizes due to the varying scales of nodules. This approach enhances small-object recognition accuracy, improves small-object detection accuracy, and boosts feature extraction accuracy and speed. The K-means-IoU clustering algorithm enables an automated anchor box configuration approach that employs an effective clustering method to learn the appropriate anchor box settings.
Non-maximum suppression is then utilised to find the anchor box with the highest IoU. Regression training is employed to bring the anchor box as close to the ground truth for K-means clustering as possible. The proposed model for selecting RPN anchors is illustrated in . K-means clustering is applied to the bounding box dimensions (width, height, and depth) in the training set to create box priors with better average overlap with the ground-truth annotations. The Jaccard distance is used as the distance measure, defined as follows:
Figure 2. Proposed structure for RPN anchor selection.
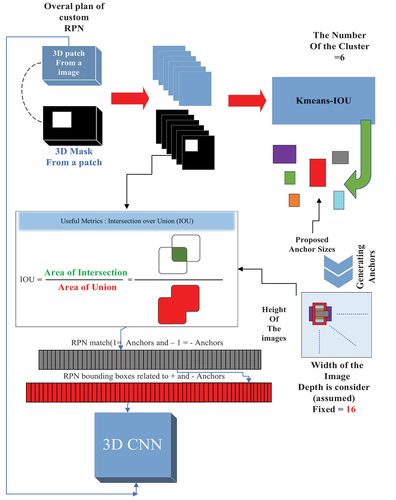
Using the Jaccard distance, ground-truth bounding boxes and clusters between boxes are represented by a and b. The average IoU is used to compute the distance between ground-truth bounding boxes and the closest cluster. Clusters are converted into anchor boxes by moving them to the nearest feature grid point after computing the IoU between ground-truth bounding boxes and the closest cluster. We set k = 6, achieving an average IoU of 0.5 for the resulting anchor boxes distributed in a grid.
3.4.1. Backbone of the feature pyramid network
To generate initial results, traditional techniques depend on the skip connection linked to the deconvolution layer on up-sampling. However, the deconvolution layer cannot retrieve small objects, such as nodules, that have been lost due to down-sampling. As a result, they are unable to identify small nodules accurately. In a nutshell, FPN enhances a normal convolutional network by adding a top-down route and lateral connections, allowing it to build a prosperous and multi-scale feature pyramid from a single-resolution input image. Each level of the pyramid may be used to detect objects on scales within a specific range. The Conv1, Conv2, Conv3, Conv4, and Conv5 layers are the bottom-up feature maps, resulting in the {} layers, which are then up-sampled via the top-down pathway to obtain feature maps from higher pyramid layers. Using a 1 × 1 convolution kernel (256 channels), {
} are laterally coupled with the up-sampling results to produce new feature maps
. In FPN, the anchors should have areas of
} pixels on
respectively.
The 5th anchor scale in RPN is P6, which is generated by subsampling from P5 with a stride of 2.
It’s important to note that while P6 is used in RPN, it isn’t used in the classifier heads. Finally, to remove the effect of up-sampling, a 3 × 3 convolution is applied to P2-P5 and all P layers, yielding the final feature maps. The proposals are assigned training labels based on their Intersection-over-Union (IoU) ratios and the actual boundary box (ground truth); an anchor is given a positive label when it has the highest IoU for a specific ground truth. A positive label is assigned to any ground truth box with an IoU greater than 0.7, whereas a negative label is assigned to any ground truth box with an IoU less than 0.2 (Zhong et al. Citation2019).
3.4.2. Point-Net
The small object detection ability is relatively low based on RPN’s proposals, resulting in suboptimal quality of developed region proposals. To overcome the limitations of RPN, we propose Point-Net, which allows lower-level features to obtain rich information for small objects.
3.4.2.1. Proposal of key-point
The paper addresses the relatively low small object detection ability based on RPN’s proposals, leading to suboptimal quality of developed region proposals. To overcome these limitations, Point-Net is proposed, enabling lower-level features to obtain rich information for small objects.
In this section, the rep-point method is employed to discover the points of interest in a given image. A local patch is then sampled and described using its invariant features, which are utilised to generate key-points. Subsequently, all 2-combinations of the generated key-points are chosen to construct key-point anchors for object detection. The regions and centre coordinates of these heterogeneously distributed anchors are encoded in feature maps. Finally, a comparison is made between the main points in the rep-point network and the anchors generated by the RPN in the first layer. Each anchor RPN with a large number of points is selected as a better anchor, which is utilised to train the network.In the RPN method, the bounding box provides a coarse representation of the object’s position. The bounding box representation only considers an object’s rectangular spatial scope. It does not take into account the shape, pose of the object, and the positions of semantically meaningful local areas, which could be used for more refined localisation and better object feature extraction. To overcome these limitations, rep-points, starting from a feature map position p = (x, y), directly regress a set of points to represent the spatial extent of an object using two successive steps:
Where is the intermediate point set representation, and n is the total number of sample points used in the representation. N is set to 9 by default.
denotes the feature vector at position p,
and
which are 2D regression functions implemented by a linear layer.
are the predicted offsets of the new sample points in relation to the old sample points. The bounding boxes of an object are obtained by applying a conversion function T to the point sets R and
, where T is modelled as the min-max, partial min-max, or moment function.
3.4.2.2. Bounding box representation
In this paper, an anchor-free detector is proposed based on several techniques, including Repoints, FPN with RoI Align used in RPN, Dense-Box, and a Yolo-like detector, adapted from the anchor-free method of Yolo. The Point-Net, implemented with a maximum conversion function, effectively detects small objects, and its fusion with RPN improves object detection accuracy.
Rep-points are utilised as an anchor-free object detector to represent bounding boxes as their essential representation. This method locates several predefined or self-learned key-points and generates bounding boxes to detect objects. Predefined anchor coordinates dominate the representation of objects in the RPN stage of object detection, followed by Yolo and Dense-Box, allowing the creation of an anchor-free object detector using centre points as the initial representation of objects.
In the RPN, pixels in the centre region of the object are defined as positives to predict the location, width, and height of object proposals by ResNet50, ResNet101, and FPN backbones. Yolo divides the image into an S×S grid, and if the centre of an object falls into a grid cell, that cell is responsible for detecting the object. Dense-Box uses a filled circle located at the object’s centre to determine definite positives and predicts the four distances from the positives to the object’s bounding box for location.
The intuition behind this approach is that if a proposal’s bounding box has a high IoU with the ground truth box, the centre key-point in its central region is likely to be of the same class, and vice versa. After a proposal is generated as key-points, the method determines if the proposal is an object by checking if there is a centre key-point of the same class falling within its central region.
3.4.2.3. Match RPN and rep-point
The paper introduces RPN, which initialises anchors of different scales and aspect ratios at each convolutional feature map location. While the anchor potentially covers the object of interest, it may not focus on local information (Ding et al. Citation2020). To overcome these limitations, the RePoint-Net method is introduced, combining the advantages of RPN and Point-Net. The proposed Point-Net approach for object detection aims to address the drawbacks of anchor-based approaches. Rep-points represent objects as a set of sample points and learn to arrange themselves to encompass the spatial extent of an object and indicate semantically significant local areas. Our suggested method is implemented based on an RPN network architecture that enhances rep-points by finding the optimal selection of anchors/features for both classification and localisation. A visual illustration of the RePoint-Net approach for the detection of pulmonary nodules is presented in .
Figure 3. Schematic representation of the RePoint-Net method for identifying nodules pulmonary.
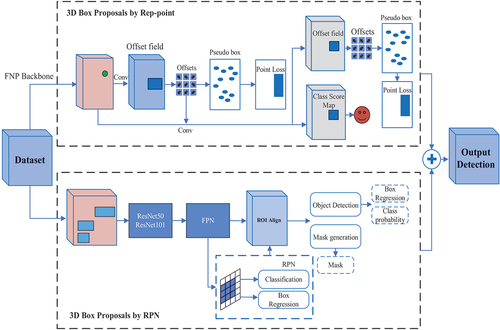
Region proposals are generated by utilising Point-Net as a source of local information, combined with RPN. The key-point anchors surrounding the object may possess a specific aspect ratio or size that RPN anchors cannot accommodate. Point-Net anchors are more suitable for region proposals, and the coupling anchors obtained from the model exhibit a more robust ability.
The generation of region proposals involves the use of a box-regression layer (reg) and a box-classification layer (cls) to map the coordinates and scores of the recommendations within the RPN framework. Point-Net and RPN anchors are combined to create reg and cls. All produced rep-points are enumerated to generate anchors, resulting in a total of Ng key-points. To handle multiple descriptors at one key-point, identical key-points are merged into one. The variables used in our method are listed in .
Table 1. Variables used in our method.
The key-points after connecting be . For key-points
extracted from
, its corresponding anchor be
, where
and the anchor
with the small area should be ignored.
be the resulting final anchors, where
is set of anchors produced by RPN and
is the set of anchors made by rep-points.
In this study, the merging of rep-point and RPN anchors was performed to design reg and cls. The Point-Net label and ground bias should be mapped into 3D tensors as the supervision information to train reg and cls. be the 2D feature map of the last shared convolutional layer, h and w are the numbers of rows and columns of the map, respectively. The labels fed to cls are a 3D tensor with the following formula:
, where
that
are the maximum possible proposals induced by RPNs and rep-point at each Point of
, respectively.
decomposed into two sub-tensors, as shown in Equations 4 to 8:
Where:
is the feature map of the t-th channel. We divide the set of rep-point anchors,
, into
groups and then organise the label and ground bias in 3D tensors.
is a threshold that is the base size of the image set. Combining
and
to the t-th feature map
at positions
, where
is the feature stride from the input image to the feature map
.
The ground bias tensor like labels decomposed into two bias tensors,
, where:
Combining and
, for any
, we map its ground biases to
,
and
at the position
.
After the label and ground biases of all are mapped into their corresponding tensors, the 3D tensors
and
serve as supervision information to train the Point-Net. The RPN anchors be an array
, the rep-point anchors be an array
moreover,
is the array of all the anchors.
is resulted from A after removing the anchors that are not inside the image and show as:
. Then, a query list between
, where the k-th anchor in A′ corresponds to the
anchor in A.
are the labels of A′.
Then, the indexes of the anchors with the positive label in A′ for Point-Net training can be obtained as follows:
Obtain all the indexes of the anchors with the positive label 1.
that randomly choose
elements in
if the number of the assigned positive label (i) is more significant than
.
The anchors’ index vector with the positive label in A′ for Point-Net training is , where
if (ii) is performed; otherwise
.
The indexes of the anchors with the positive label in A′ for Point-Net training can be obtained as follows:
Obtain all the indexes of the anchors with the negative label 0.
that randomly choose
elements in
if the number of the assigned negative label is more significant than
.
The anchors’ index vector with the negative label in A′ for Point-Net training is , where
if (b) is performed; otherwise
.
The RePoint-Net detector’s implementation is based on the rep-point detector, where ResNet-50 and ResNet-101 extract the input image features with FPN backbones. The anchor generation settings are the same as those of RPN anchors. The greatest IoU between RPN and rep-point is discovered to enhance detected accuracy. By combining the two types of anchors, the detected accuracy is increased. The loss function considers classification loss for determining whether the current box is a nodule or not, and regression loss
for nodule coordinates x, y, z, and nodule size.
An anchor is considered a positive anchor (p* = 1) if it overlaps with a ground truth bounding box with an IoU higher than 0.5. Conversely, an anchor is considered a negative anchor (p* = 0) if its IoU with all ground-truth boxes is less than 0.2. The multitask loss function for anchor i is defined using Equations 11 to 13.
Where pi is the predicted probability of current anchor i being a nodule, is the predicted relative coordinates for nodule position, which is defined as:
Where (x, y, z, d) are the predicted nodule coordinates and diameter in the original space, () are the coordinates and scale for the anchor i. ‘Ground truth nodule position’ is defined as:
The nodule ground truth coordinates and diameter are represented as (x*, y*, z*, d*). The value of λ is set as 0.5. The binary cross-entropy loss function is utilised for , and the smooth
regression loss function (Dou et al. Citation2017) is used for
.
3.5. Fully automated lung segmentation using net
Once the pulmonary nodule regions were detected in the CT scans, the proposed areas underwent segmentation using theNet method, as illustrated in . This segmentation process aims to identify the boundaries of the nodules that can provide important information for diagnosing whether a nodule is malignant or benign.
To overcome memory constraints during training, the proposed method involves splitting the entire CT into several 16 × 64 × 64 patches, which define the working samples. The Net network structure can effectively combine CT images’ shallow and in-depth features to extract richer feature information using 3D spatial information. The
Net model consists of a down-sampling path that learns to extract fine-grained spatial and coarse-grained temporal features, and an up-sampling approach to recover spatial resolution. The down-sampling section focuses on analysing and extracting features from the input data, while the up-sampling section generates segmentation results. In our network structure, the down-sample accuracy was increased by incorporating residual 3D convolution, 3D convolution with different filters, and dilated 3D convolution (Zhang et al. Citation2018; Shih et al. Citation2019). The convolutional and deconvolutional blocks of the network also contain BN (He et al. Citation2016) and ReLU, which accelerate the network’s convergence speed and enhance gradient backpropagation.
In the architecture designed for pulmonary nodule detection, batch normalisation is employed after the convolution and before the ReLU activation function. When the convolution generates multiple output channels, batch normalisation is applied individually for each channel, each having its own scalar scale and shift parameters. The network incorporates the residual module (Li et al. Citation2022) to enhance local and global information, specifically for the false-positive reduction task in pulmonary nodule detection.
To improve performance, increasing the network’s depth is beneficial. However, a higher number of convolutional layers can lead to the problem of gradient vanishing. To address this concern, the 3D convolution function is used before the residual module to adjust dimensions and increase depth, allowing for the extraction of more representative features (Zhang et al. Citation2022). Contrast enhancement is learned through a structure proposed in the encoder layers to highlight useful boundary information. In each block, we propose a critical component that combines one 1 × 3 × 3 convolutional layer and one layer of 1 × 1 × 1 convolutions in either a parallel or cascading fashion, replacing the standard 3 × 3 × 3 convolutional layer. Smaller filters have proven to be more effective for training and operation, as indicated by previous studies. Isolated 3D complexities effectively reduce the model’s size and energy consumption for the object learned from the images. Additionally, the output of 1 × 3 × 3 filters and the result of 1 × 1 × 1 filters are linked as input to the new 1 × 3 × 3 convolution filters, which output the first 3D convolution 3 × 3 × 3 connected for all blocks within the residual network. Output decoupled convolutions are entirely associated with the input decoupled convolution layer. A parallel decoder structure is utilised to aggregate features and generate a global map for the coarse localisation of lung lesions. illustrates the framework of the encoder.
Figure 4. The architecture of the encoder network.
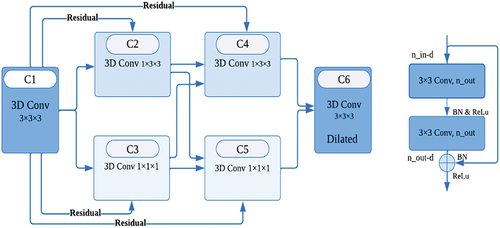
The layer structure of the encoder in the Net network has a similar architectural design to the first layer. The decoder block is responsible for taking the high-level spatiotemporal features captured as input and generating the volumetric segmentation mask as output. This block includes four 3D convolution layers, each consisting of two subsequent 3D convolutional layers with a kernel size of 3 × 3 × 3, a 3D up-sampling operation with a kernel size of 2 × 2 × 2, a batch-normalisation layer, and ReLU as an activation layer. These components are adopted to speed up training and enhance gradient backpropagation.
The proposed structure solves the shallower U-Net problem by overcoming the U-Net limitation. In the false-positive reduction task, it is significantly more effective than the previous U-Net.
3.5.1. Network skip connectivity for net
Our method utilises parallel convolutions to avoid the loss of small target information during segmentation. This is achieved by combining multiple convolutional pathways at different resolutions, which allows for the preservation of fine-grained details and enhances the overall quality of the segmentation. Additionally, our approach explicitly improves the representation of objective region boundaries through a specialised boundary refinement module.
The copy operation effectively links the corresponding feature maps of down-sampling and up-sampling. However, the U-Net can only have one set of connection layers between the encoder and receiver block, meaning that the U-Net symmetrically constitutes the connection layers. As a result, the low-level feature of the encoder is connected to the second part of the receiver, while the high-level feature is connected to the beginning of the receiver. Nonetheless, the level of features in the down-sampling path is much lower than that in the up-sampling path, and directly concatenating these features may not yield optimal results. (Wu et al. Citation2019) stated that low-level features require significant computational resources due to larger spatial resolutions, but they contribute less to the overall performance than high-level features. In U-Net, the encoder-decoder architecture for image segmentation has certain limitations. Therefore, a 3D dense network is proposed to overcome these limitations by establishing interconnections between the layer encoder and decoder. Additionally, a new family of object detectors is developed between the encoder and decoder layers, resulting in improved efficiency and higher accuracy with optimised network architectures. The 3D dense network appropriately arranges pooling and up-sampling in the skip connection to ensure superior segmentation results.
Let denote the output of a node indexed by i at the down-sampling layer and encoder, and j indexes the convolution layer along with the skip connection. The stack of feature maps represented by
for
is computed as follows:
The function C (∙) denotes the convolution operation, D (∙) indicates a convolution layer, and the skip connection operation. To obtain better accuracy, multi-scale feature fusion aims to aggregate features at different resolutions. Given a list of multi-scale features , Where
represents the level features k= {0, 1, 2, 3} (Morozov et al. Citation2020), our goal is to find a transformation in the interconnection between the encoder and decoder that can effectively aggregate different features and output a list of new features:
. The layer aggregates multi-scale features in a top-down manner.
In our particular case, an alternative method of resizing feature maps in CNNs was chosen. Instead of relying on max-pooling, the decoder operation was implemented using the innovative Net architecture. This approach involves a combination of 3D convolutions and squeeze-and-excitation blocks, enabling the down-sampling of feature maps while retaining crucial details.
Implementing this unique methodology led to the achievement of superior results compared to traditional max-pooling techniques. The Net architecture enabled the retention of more essential information in the feature maps, resulting in improved performance across various tasks.
Figure 5. The architecture of the Net network for segmentation of pulmonary nodules.
3.5.2. Enhanced image segmentation with 3D-Dense connection and pseudo-3D blocks
The proposed approach in this work differs from Dense-Net by adding an up-sampling path to preserve full-resolution feature maps and enhance image segmentation. A novel 3D-dense connection was introduced for accurate pixel-level image segmentation, where the skip connections were densified with a proposed dense structure. This structure was adjusted using experience and resulted in a layer structure including dropout, max-pooling with a kernel size of 1 × 2 × 2, convolution layers with a kernel size of 1 × 3 × 3, batch normalisation, ReLU activation, and 3D up-sampling with a kernel size of 1 × 2 × 2. Additionally, Pseudo-3D (P3D) blocks (Wei et al. Citation2019) were utilised to replace residual units in building modules for improved network performance and image detail learning. The P3D block comprises one 2D filter (1 × 3 × 3 convolutions) and one 1D filter (3 × 1 × 1 convolutions), with two 1 × 1 × 1 convolutions at both, ends responsible for dimension reduction and increase. This bottleneck design reduces the dimensions of the input and output of both filters. To prevent overfitting, a dropout (Hinton et al. Citation2012; Srivastava et al. Citation2014) layer rate of 0.02 was used at the first dense layer. Moreover, P3D blocks were directly applied to the image CT to improve network performance while reducing vanishing points, demonstrating superior performance over ResNet (Mou et al. Citation2020).
3.6. Construction of 3D CNN architecture
The 3DCNN architecture considers contextual information by analysing neighbouring slices, which helps in accurately detecting and segmenting nodules, especially when they resemble nearby structures or have unclear boundaries. Additionally, 3DCNNs effectively handle variations in nodule size and shape by examining the entire 3D volume. This allows for precise detection and segmentation, regardless of specific morphological characteristics. The hierarchical feature extraction capability of 3DCNN architectures, achieved through multiple convolutional layers, enhances the model’s ability to differentiate between nodules and non-nodule structures. It captures meaningful features at different scales and levels of abstraction. By operating directly on 3D volumes, 3DCNNs minimise information loss that occurs when converting 3D data into 2D slices. As a result, they preserve volumetric characteristics and spatial relationships, leading to more accurate detection and segmentation. Overall, the use of the 3DCNN architecture offers advantages in utilising spatial information, understanding the context, extracting hierarchical features, representing data comprehensively, and reducing information loss. These advantages contribute to improved accuracy and performance in nodule classification.
After segmenting the lung nodules, lung CT images were processed using the proposed method for classification, as shown in . Data preprocessing was initially performed to standardise theNet network data output. The input images were reduced to 16 × 64 × 64 to decrease GPU memory consumption and then fed into the 3DCNN network. The proposed 3DCNN network architecture is illustrated in , comprising nine convolutional layers grouped in sets of three, followed by one 3D max-pooling operator. The latter blocks extracted more features at a higher abstraction level than those at the beginning of the network, with 64, 128, and 256 features, respectively. The first block used 1 × 5 × 5 filters, while the later ones used 1 × 3 × 3 filters.
Figure 6. Our proposed 3D deep CNN architecture.
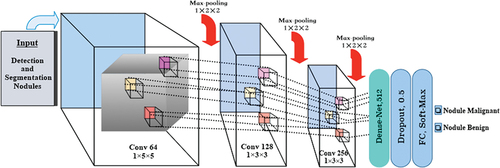
The first step involved inputting the feature image and performing a 1 × 5 × 5 convolution on the image. Its output was then concatenated with a U-Net layer convolution. Each up-sampling block in the U-Net comprised two 3D convolutions, which were connected with the output 3D convolution proposal network. The connections between Net and 3DCNN were established through top-down paths, generating dense positions at lower and higher resolution levels.
After the third 3D convolution, we added a 3D max-pooling of size 1 × 2 × 2, repeating this process three times. Subsequently, a softmax activation function followed the last two fully connected layers, Dense-Net, and fully connected models to classify proposed nodules as malignant or benign. The normalised exponential function produced a categorical distribution from the output of the previous layer to calculate the probability of malignant or benign nodules for each prediction. To reduce overfitting and regularise the model, we used a dropout layer with a dropout factor of 0.5 after the first fully connected layer. The loss function is defined as follows:
The loss function in the model is designed to achieve a balance between the foreground and background pixels, using the dice coefficient as the basis. It combines the cross-entropy loss function and the dice loss function (Kong et al. Citation2016). The ground truth is represented by y, and y’ represents the model’s prediction. For the experiment, we set the balance parameter to 0.5.
During the training phase, the ‘Adam’ optimisation approach (Tran et al. Citation2019) is employed with a learning rate of lr = 0.0001, and a weighted cross-entropy loss is applied for 20 epochs (Kingma and Ba Citation2014).
4. Experiments and results
The LIDC/IDRI dataset is a compilation of CT scans and annotations for pulmonary nodules, which includes information on their size, shape, texture, and location. With over 1,000 CT scans from various institutions, the dataset was independently annotated by four thoracic radiologists, with inter-observer variability assessed. The LIDC/IDRI dataset distinguishes itself from other datasets due to its annotations not only on the presence of nodules but also on their various characteristics. Consequently, it has become an essential resource for developing and evaluating CAD systems for pulmonary nodules. Different categories of nodules, including solid, part-solid, and ground-glass nodules are encompassed in the dataset. The nodule characteristic score (NCS) is a 5-point scoring system that radiologists can utilise to evaluate the probability of a pulmonary nodule being cancerous. The NCS evaluates several aspects such as size, speculation, margin, lobularity, and texture, with higher scores indicative of greater malignancy possibilities. The NCS system ensures consistent and objective evaluation of pulmonary nodules across various studies and institutions.
When detecting nodules, size measurement in millimetres is critical in identifying their likelihood for malignancy. Larger nodules typically indicate a higher chance of malignancy. Additionally, nodules with spiculation or irregular projections on their surface may suggest higher chances. The degree of spiculation is related to the risk level, with more significant spiculation showing a greater risk. The border or margin of the nodule is another crucial aspect. Smooth and well-defined margins usually exhibit a lower probability of malignancy, while irregular or ill-defined ones indicate a greater chance. Multiple compartments within the nodule, or lobularity often demonstrate a more complex and irregular shape, consistently linked to a higher risk of malignancy. Texture evaluation is also evident, with nodules having a higher degree of density, usually presenting a higher risk. In contrast, ground-glass-like or mixed nodules can indicate a lower risk. Thus, a thorough evaluation of all characteristics is vital for determining the likelihood of malignancy in a nodule. contains an annotation of the scoring system.
Table 2. Annotation of nodule characteristic scoring.
The experiment aimed to evaluate the effectiveness of the cancer prediction and diagnosis method using the LIDC-IDRI dataset from the National Cancer Institute. To ensure consistency, we made adjustments to the pixel spacing in all three dimensions before extracting cubic pulmonary nodules for testing. Nodule labels based on malignancy level were provided by four doctors, and we calculated the mean malignancy level for each nodule, considering potential inter-doctor variations.
To classify nodules as malignant, benign, or uncertain, we set a threshold of 3 for the mean malignancy level. The training set comprised 1010 nodules, with 127 being benign and 883 malignant cases. To validate our approach, we employed five-fold cross-validation, randomly dividing the training and unlabelled datasets at a 4:1 ratio in each fold while maintaining a consistent proportion of benign and malignant nodules using the SMOTE algorithm. Data enhancement techniques were also utilised to augment the training set. The average accuracy obtained from the five folds served as the final result for our experiment.
4.1. Implementation details
The experimental setup involved using hardware comprising five Nvidia Quadro RTX8000 graphics cards and 240 GB of memory. The software environment consisted of the Keras deep learning framework (version 1.13.1), and the experiment was programmed using Python 3.6. Additionally, the paper utilised SimpleITK, OpenCV 3.0, TensorFlow, and NumPy throughout the experiment.
4.2. Evaluation indexes
The performance of deep learning architectures is typically evaluated based on various factors, such as overall accuracy of pixel-wise labelling, time taken, and memory usage. Overall accuracy is calculated by dividing the number of correctly classified pixels by the total number of manually classified pixels in the ground truth. Another important measure is per-class accuracy, which shows the percentage of accurately classified pixels for each class. Per-class accuracy is closely related to overall accuracy. Binary masks are used for assessing pixel-wise accuracy, but they may contain more information than just binary classifications. The passage also defines several key terms such as True Positives (TP), False Positives (FP), True Negatives (TN), and False Negatives (FN) (Rahman and Wang Citation2016). These definitions are used to calculate the accuracy rate and F1-score, both of which are widely used to comprehensively evaluate classification models. The mathematical representation is as follows:
When the dataset has a small representation of a specific class, relying solely on the pixel-wise accuracy metric can lead to misleading results. To better understand the overall accuracy of each class in imbalanced datasets, precision and recall are two measures that can assist in interpretation. Precision or Positive Predictive Value (PPV) indicates how pure a positive detection technique is compared to all pixels accurately classified as ground truth:
Conversely, sensitivity describes the accuracy of positive predictions compared to all pixels accurately classified in the ground truth (Goutte and Gaussier Citation2005):
For object category segmentation, the Jaccard index or IoU is a widely-used performance metric. It measures the similarity ratio between the predicted region and its corresponding ground truth region for each object in the dataset (Rahman and Wang Citation2016):
The mean Intersection over Union (mIoU) is another standard segmentation performance metric calculated as the average of all IoU values obtained across all semantic classes. Other metrics such as time, memory, and power depend on the hardware, software, and deep learning architecture used to solve the classification problem. The Dice similarity coefficient (DSC) is a common measure of similarity between two sets of data. In the context of segmentation, it is used to measure the similarity between the predicted segmentation and the ground truth segmentation. The formula for calculating the DSC is:
For computing accuracy, precision, DSC, and sensitivity, we generated the confusion matrix where TP represents the number of true positive pixels (i.e. the number of pixels that are correctly segmented as belonging to the target class), TN represents the number of true negative pixels (i.e. the number of pixels that are correctly segmented as not belonging to the target class), FP represents the number of false positive pixels (i.e. the number of pixels that are incorrectly segmented as belonging to the target class), and FN represents the number of false negative pixels (i.e. the number of pixels that are incorrectly segmented as not belonging to the target class). The results are shown in .
Table 3. Definition of TP, FP, FN, TN.
4.3. Training and testing nodules detection by RePoint-Net
To overcome GPU memory constraints, the CT images were partitioned into 96 × 96 × 96 patches and then fed into the 3D RPN (Region Proposal Network) as illustrated in . Subsequently, we split the entire CT into 96 × 96 × 96 patches to be used in the 3D RPN. showcases the proposed anchor in the 3D RPN, which was selected due to its strong performance in nodule detection tasks.
For the nodule detection process, a 3D CT image with anchors as candidate nodule bounding boxes was inputted into the 3D RPN, generating the classification probability score (p) for each anchor to determine if it represents a nodule, along with the nodule’s spatial information, such as its coordinates (x, y, z), and its radius (r). To account for various nodule sizes, each anchor was assigned a scale and an aspect ratio. In total, we explored six different reference bounding boxes, each corresponding to a sliding spatial window.
The anchor sizes and the IoU (Intersection over Union) loss function were determined using the k-means approach. These six anchors are divided into three 3D RPN levels, targeting nodules ranging in diameter from 3 mm to 35 mm with various aspect ratios and sizes. K-means was used to calculate the anchor size based on the size of the nodules, ensuring the recovery of small objects like lung nodules that might be lost during the down-sampling process. Multiresolution or filter sizes were considered based on the nodules. The feature maps underwent a 3 × 3 × 3 sliding window (deconvolution layer and convolution 3 × 3 × 3). The designed anchors anticipated numerous Regions of Interest (RoI) Align at each sliding window point. The region proposal network mapped each 3 × 3 sliding window to a 512-dimensional feature, which was then input into two fully-connected layers for regressing the area’s bounding box and predicting the score simultaneously. Fully-connected layers were used to generate a lower-dimensional feature vector, further processed by two independent soft-max layers to generate bounding boxes and probability scores for projected nodules (box reg and box cls).
To extract information from the nodules, we adopt the nearest anchor with minimal change. The inclusion of the 3D RPN enables the recovery of finer features from the original feature maps, resulting in enhanced detection performance compared to the original Faster R-CNN. We selected K = 6 as a suitable tradeoff, taking into account the model’s complexity and aiming for high recall, which was designed based on the distribution of nodule sizes. As the objects vary in size, we will employ a more appropriate method to demonstrate the distance.
Each training RoI has a ground-truth class u and a ground-truth bounding-box regression target v assigned to it. The layer outputs bounding-box regression offsets, for each of the K object classes, as indicated by the index k. For anchor i, the multitask loss function is defined as follows:
in which:
The RePoint-Net detector implementation is based on the rep-point detector, utilising ResNet-50 and ResNet-101 with FPN backbones to extract features from the input images. The anchor generation settings remain the same as for RPN anchors. By learning network parameters, the detector predicts classification scores and object bounding boxes, which are then subjected to the NMS (Non-Maximum Suppression) process for object detection. The highest IoU between RPN and Point-Net is identified, and combining these two types of anchors leads to improved detection accuracy. The matcher examines the IoU matrix, labelling anchors with high IoU between RPN and Rep-point as positive and selecting them as the best anchors.
To perform the evaluation, the LIDC-IDRI dataset is divided into two halves, with 70% of the patients forming the training set and the remaining patients serving as the test set. The K-fold cross-validation strategy is employed for assessment. During training, the network is trained for 150 epochs using a weighted decay of 0.0001, a momentum of 0.9, a batch size of 8, and a learning rate of 0.001. When the IoU exceeds 0.7, the anchor is assigned to one of the best boxes and labelled as foreground (‘1’). If the IoU is less than 0.2, the anchor is labelled as a background (‘0’); otherwise, it is ignored (’−1’). Our goal is to discover the features that best explain a class of objects in terms of classification and localisation.
The results obtained from the detection structure are presented in . It can be observed that the model achieves an average sensitivity rate of 97.63%, which is quite impressive. The probability value provided by the models indicates the likelihood of an image being a genuine nodule. To distinguish between a real and fake nodule, a threshold was used. Images with probability values exceeding the predetermined threshold were classified as true nodules. To enhance the effectiveness of the nodule feature information, unnecessary nodular feature information was eliminated. Consequently, the number of candidate nodules in RePoint-Net was significantly reduced, leading to improved performance in detecting lung nodules. The table also includes standard deviation values of sensitivity rates calculated from cross-validation folds, providing insights into the variability in sensitivity rates across different folds and the model’s generalisation to new data points. Overall, these findings demonstrate the effectiveness of our detection system in accurately identifying lung nodules, while also emphasising the significance of removing extraneous information to enhance the model’s performance.
Table 4. System performance of nodule candidate detection.
The study’s results demonstrate that the suggested deep learning method exhibits higher sensitivity compared to other CAD systems developed recently. The RePoint-Net model was evaluated using a 0.5 threshold value, and the findings indicate that the model has a low rate of missing nodules with a diameter below 10 mm. presents the outcomes for different pulmonary nodule sizes.
Table 5. Detection of nodules based on diameters with RePoint-Net.
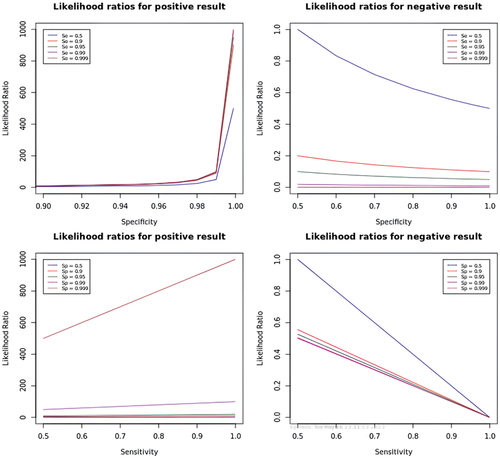
illustrates the likelihood ratios for both positive and negative results. A likelihood ratio provides information about how much the probability of having the condition increases or decreases with a positive or negative test result. A likelihood ratio > 1 indicates that the test result is useful for diagnosing the condition, while a value < 1 suggests that the test is not adequate for diagnosis. Negative result likelihood ratios are beneficial for eliminating the possibility of the condition, while positive result likelihood ratios are practical to confirm it.
Figure 7. Likelihood ratios for positive and negative results of RePoint-Net.
4.4. Training and testing nodules parenchyma segmentation and classification with net and 3DCNN
This study presents the development of a modified Net deep-learning model for CT image segmentation of lung nodules. The model was trained on the LIDC-IDRI dataset, which includes detailed annotations by radiologists, covering small nodules and non-nodules. After preprocessing, 888 CT images with corresponding ground truth masks were created and divided into two groups: 70% for training and 30% for testing. The information includes CT scan results and nodule labels (lists of nodule centre coordinates). The Dice index is used to evaluate the fit between the original and segmented targets, with higher values indicating excellent nodule segmentation. The Dice coefficient (dice) is defined as follows:
where y is a binary map of the corresponding image, and is the post-processed binary mask on the predicted probability map using the OTSU algorithm (Zhao et al. Citation2018). The loss function is defined as loss = 1 - dice, which is minimised during training. The loss function for
is given by:
The pixel-wise loss function is commonly described by cross-entropy:
When the Dice coefficient is close to one, the loss function loss approaches zero, indicating an accurate segmentation result.
To improve nodule identification with limited training data, several experiments were conducted using different data augmentation techniques. Randomly resizing and flipping patches in different proportions proved effective in enhancing nodule patches, while traditional techniques like axis swapping and rotation did not yield the same results. Additionally, an online hard negative mining method was employed during training to further enhance classification performance by generating multiple detections and selecting negative samples as candidate pools based on overall loss. The study emphasises the significance of testing various data augmentation methods and integrating additional approaches to maximise model accuracy.
displays the results of nodule detection in different categories of lung textures, including solid, subsolid, and non-solid nodules, with a total of 1018 nodules detected. The proposed model achieved high sensitivity and accuracy across different texture categories, with an overall sensitivity of 0.908 and accuracy of 0.96. The solid category performed the best with a sensitivity of 0.932 and accuracy of 0.985. The subsolid and non-solid categories also achieved high sensitivity and accuracy, demonstrating the effectiveness of the proposed model in detecting nodules across different texture categories. The Dice similarity coefficient and F1-score were also high, indicating good agreement between the predicted and ground truth segmentation results. The results demonstrate the efficacy of the proposed model in identifying pulmonary nodules across different texture categories, emphasising the importance of utilising advanced data augmentation techniques and online hard negative mining methods to enhance the performance of deep learning models in medical image analysis.
Table 6. The segmentation results of the proposed model for 1018 pulmonary nodules category of texture.
displays the threshold values and their corresponding False Positive Rates (FPR) or 1-Specificity for a classifier that distinguishes between Malignant and Benign Nodules. The threshold is the probability threshold used to classify the predicted probabilities as either positive or negative. At each threshold, the FPR is calculated as the ratio of negative examples wrongly classified as positive to the total number of negatives, indicating how frequently the model produces a false positive prediction. For instance, when the threshold value is set to 0.4, the FPR or 1-Specificity is 0.131. This implies that 13.1% of the negative cases were wrongly classified as positive at this threshold, which results in a higher false positive rate compared to other thresholds. The ROC curve in shows how the trade-off between sensitivity and specificity changes at different classification thresholds.
Figure 8. The table label describes the ROC curve, which demonstrates the balance between sensitivity and specificity at different classification thresholds. An ideal classifier would achieve a TPR of 1.0 and an FPR of 0.0 at all threshold values, resulting in a ROC curve with a TPR of at least 0.93 at an FPR of 0.01 or below. The classifier’s performance is summarized by the area under the curve (AUC) with a range of 0.0 to 1.0, where 0.5 indicates random guessing and 1.0 shows a perfect classifier. The classifier discussed has an AUC of 0.986, indicating strong discrimination power between nodule-benign and nodule-malignant cases.
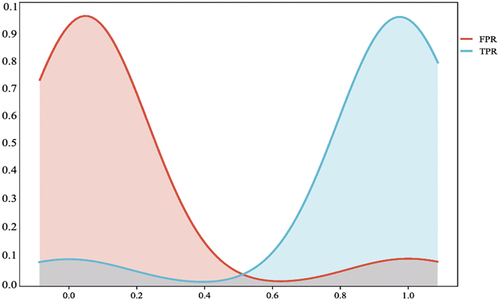
Table 7. ROC curve threshold table.
For the false positive reduction stage, training data consists of positive and negative candidate samples with labels provided by the LIDC-IDRI dataset. The dataset includes 1010 nodules with a definitive diagnosis of malignancy or benignity assigned by at least three out of four radiologists. Out of those 1018 nodules, 883 were malignant, and 138 were benign. During the training process, the Adam optimiser was used to initialise the weights randomly, and backpropagation was used to update the weights. The training batch size was set to 68, and the training epoch was set to 20, with a learning rate of 0.0001.
presents the confusion matrix of the method, showing that the model accurately identified 96.2% of malignant nodules and 94.7% of benign nodules. There was a 5.3% error rate where benign nodules were wrongly predicted as malignant, indicating high accuracy in diagnosing malignant nodules.
Table 8. The confusion matrix of our method.
provides the classification results of nodules using 3DCNN, where the method successfully identified the majority of both benign and malignant nodules. The specificity for correctly identifying non-malignant nodules was relatively high for both benign and malignant nodules, with a slightly higher false positive rate for benign nodules. Overall, the outcomes suggest that the nodule detection test has a reasonably high accuracy rate in identifying malignant nodules. The CT images were resized into small patches, and the network’s weights were updated using the Adam optimiser (batch size = 8; learning rate = 0.0001). The evaluation included 100 training epochs and predictions for the test set. The k-fold cross-validation method was used during the testing phase with k = 10, dividing the data into equal-sized parts for assessment.
Table 9. Classification of nodules using 3DCNN.
presents a comparison of IoU scores between different variants of U-Net and the proposed method for nodules segmentation from CT scans. The proposed method achieved an IoU score of 91.35%, outperforming all other network structures evaluated in this study.
Table 10. IoU scores between different variants of U-Net and the proposed method.
The comparison between our method and the original network’s ability to identify lung nodules was conducted. Given the 3D nature of lung CT scans, the 3D network outperforms the 2D network in capturing nodules. presents a comparison of the performance of the previously trained model in semantic segmentation using different variants of the U-Net model. Our method achieved an impressive IoU of 91.25% on the test set, representing a 30% improvement over the U-Net baseline. Through the comparison of results from the prior model and the baseline model, it was observed that integrating the results of detection and segmentation into the network successfully enhanced the accuracy of nodule identification. Furthermore, we compared our model with those used in previous studies, and our model exhibited superior performance.
Figure 9. Comparison of the IoU between our model and prior models. The results show that prior models outperform the baseline method implementation and standard.
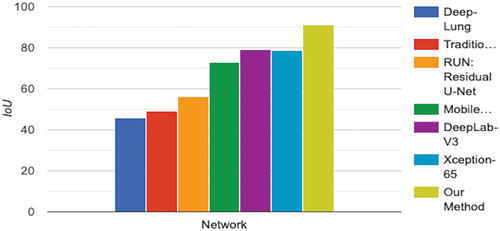
5. Discussion
Numerous research studies have emphasised the potential of technology to improve standardisation in radiology. For instance, a study found that computer-assisted measurements reduced the inter-reader variability by 50% compared to manual measurements, especially when incorporating semi-automated tools. These tools do not replace the expertise of radiologists but rather enhance their ability to identify lesions and perform consistent measurements. Furthermore, automation can assist in locating marked lesions during follow-up appointments, and automating Therapy Response Assessment can provide valuable decision support. This can lead to significant improvements in consistency, efficiency, and quality while reducing the time and effort required to measure lesions accurately. However, many radiologists feel demotivated and struggle with measuring lesions accurately and consistently, often resulting in incomplete reports. This approach can be frustrating for oncologists and other clinicians who rely on precise measurements for proper patient management. A survey found that while 94% of oncologists require measurements for all lesions, surprisingly, only 7% of radiologists adhere to this. The use of multi-slice spiral CT and CT screening has increased the detection rate of pulmonary nodules, necessitating precise measurements for optimal patient management (Jaffe et al. Citation2010).
Recent research on deep learning and CAD has shown promise in addressing the issue of accuracy saturation. For instance, a deep learning model utilised in this study demonstrated the feasibility of detecting and categorising pulmonary nodules as benign or malignant. However, there are still some limitations that need to be addressed, such as the need for further refining of deep learning models and enhancing their clinical relevance. Overall, the potential of technology in radiology shows promise for improving accuracy and consistency while reducing the time and effort required for precise lesion measurement and patient management.
Our study developed a successful deep learning model combining RePoint-Net and to identify lung nodules in CT scans. The model achieved high accuracy and sensitivity in detecting nodules while reducing false positives through a detection stage before segmentation and classification. Our findings have significant implications for clinical practice, as the early detection of lung nodules can greatly enhance patient outcomes.
Regarding , the RePoint-Net detector demonstrated a high level of accuracy in detecting these nodules in CT images. The sensitivity and specificity rates are impressive, and the model can detect nodules of varying sizes, including those with a diameter under 10 mm. Moreover, we have highlighted the significance of eliminating redundant nodular feature information to boost our model’s performance. These findings have significant implications for clinical practice, as the early detection of lung nodules can substantially enhance patient outcomes.
exhibits the outcomes of detecting nodules in diverse types of lung textures. The table reports the number of identified nodules, TP, FP, sensitivity, accuracy, precision, DSC, and F1-score for solid, subsolid, and non-solid texture categories. The total number of detected nodules is 1018. The table showcases the model’s capacity to discriminate between various lung textures, with high overall sensitivity and accuracy, with 0.908 sensitivity and 0.96 accuracy. The solid texture category achieved the best performance, with a sensitivity of 0.932 and an accuracy of 0.985. However, the subsolid and non-solid categories also exhibited high sensitivity and accuracy, demonstrating the efficacy of the proposed model in detecting nodules across various texture types. The Dice similarity coefficient and F1-score indicate that the model’s predicted segmentation results agree well with the ground truth segmentation. These results suggest that data augmentation techniques and hard negative mining methods enhance the performance of deep learning models in medical image analysis.
presents the TPR or sensitivity for each threshold value, indicating that as the threshold value rises, the TPR decreases. The ROC curve and threshold table aid in evaluating the classifier’s performance, helping clinicians choose the optimal threshold that balances the trade-off between sensitivity and specificity based on their preferences.
shows the confusion matrix of the predictions made by the trained 3DCNN in the false positive reduction stage. In this case, the model correctly classified 96.2% of the malignant nodules and 94.7% of the benign nodules. The model incorrectly classified 3.8% of malignant nodules as benign and 5.3% of benign nodules as malignant. However, the relatively high false positive rate of 5.3% could still result in a large number of unnecessary biopsies or other diagnostic procedures in clinical practice. Further improvements in the model’s performance may be necessary to reduce this false positive rate even further.
shows that our method was able to detect the vast majority of both benign and malignant nodules, with 135 out of 138 benign nodules and 865 out of 880 malignant nodules detected. The true positive rate for malignant nodules is higher than for benign nodules (0.989 versus 0.964), indicating that the test is more successful at correctly identifying malignant nodules than benign ones. The specificity of the test (the proportion of true negatives identified, the ability to correctly identify nodules that are not malignant) is fairly high for both benign (0.036) and malignant (0.011) nodules. The false positive rate (1- specificity) is the complement of specificity and indicates the proportion of nodules that were incorrectly identified as malignant. This rate is slightly higher for benign nodules (0.942) than for malignant ones (0.972). These results suggest that the method used to detect nodules has a relatively high success rate in identifying malignant nodules.
IoU is a measure of the overlap between the predicted and ground truth masks, and higher values indicate better segmentation performance. As such, our proposed model has the highest IoU, suggesting that it is more accurate in the localisation and segmentation of lung nodules than the other models shown in .
In conclusion, our study successfully developed a deep learning model for detecting lung nodules on CT scans. By combining RePoint-Net and , we achieved high accuracy and sensitivity in identifying nodules while significantly reducing false positives. Adding a detection stage before segmentation and classification proved to be a useful approach to improve the model’s performance.
6. Conclusions and future work
The detection of lung nodules on CT scans holds crucial importance in clinical practice, considering various factors beyond nodule size. Automating this process can significantly alleviate physicians’ workload, and for this purpose, a deep learning model has been successfully developed by combining RePoint-Net and . The model demonstrated high accuracy and sensitivity in identifying lung nodules on CT images. By integrating the proposed methods, a high degree of sensitivity was achieved while significantly reducing false positives. The addition of a detection stage before nodule segmentation and classification proved to substantially enhance accuracy. The experiment, conducted on the LIDC-IDRI dataset, yielded a sensitivity of 97.74% in detecting nodules or non-nodules, and an accuracy of 95.4% in classifying nodules as benign or malignant. However, there are several avenues for future research and improvement. Firstly, there is a plan to extend the algorithm’s application to other medical imaging problems to assess its generalisability and achieve state-of-the-art performance in various contexts. Additionally, incorporating both MRI and CT images to study nodule shape, type, and growth rate is aimed at enhancing the model’s diagnostic capabilities. To make the algorithm more practical, efforts will be made to reduce its runtime by implementing the TLT method, enabling faster processing and analysis of CT scans for timely diagnosis and treatment decisions. The belief is strong that the impact of this method on healthcare can be significant, as it has the potential to improve the accuracy and efficiency of lung nodule detection, leading to early diagnosis and better patient outcomes. In summary, while the current research has demonstrated promising results, there is a wide scope for future work to expand the algorithm’s applicability, incorporate additional imaging modalities, and optimise its runtime. These efforts will contribute to further advancements in lung nodule detection and its potential impact on healthcare.
Disclosure statement
No potential conflict of interest was reported by the author(s).
References
- Al-Shabi M, Lee HK, Tan M. 2019. Gated-dilated networks for lung nodule classification in CT scans. IEEE Access. 7:178827–23. doi: 10.1109/ACCESS.2019.2958663.
- Ayaz M, Shaukat F, Raja G. 2021. Ensemble learning based automatic detection of tuberculosis in chest X-ray images using hybrid feature descriptors. Phys Eng Sci Med. 44(1):183–194. doi: 10.1007/s13246-020-00966-0.
- Bray F, Ferlay J, Soerjomataram I, Siegel RL, Torre LA, Jemal A. 2018. Global cancer statistics 2018: GLOBOCAN estimates of incidence and mortality worldwide for 36 cancers in 185 countries. CA: A Cancer Journal For Clinicians. 68(6):394–424. doi: 10.3322/caac.21492.
- Cao H, Liu H, Song E, Ma G, Xu X, Jin R, Liu T, Hung C-C. 2019. Multi-Branch Ensemble learning architecture based on 3D CNN for false positive reduction in lung nodule detection. IEEE Access. 7:67380–67391. doi: 10.1109/ACCESS.2019.2906116.
- Chen G, Li S, KarakiChen G, Li S, Karakikes I, Ren L, Chow MZ, Chopra A, Keung W, Chen NIH, et al. 2015. Phospholamban as a crucial determinant of the inotropic response of human pluripotent stem cell-derived ventricular cardiomyocytes and engineered 3-dimensional tissue constructs. Circ Arrhythm Electrophysiol. doi: 10.1161/CIRCEP.114.002049.
- Chollet F. 2017. Xception: deep learning with depthwise separable convolutions. In Proceedings of the IEEE conference on computer vision and pattern recognition. p. 1251–1258. doi: 10.48550/arXiv.1610.02357.
- Desai AD. 2019. Technical considerations for semantic segmentation in MRI using convolutional neural networks. arXiv preprint arXiv:1902.01977.
- Ding J. 2017. Accurate pulmonary nodule detection in computed tomography images using deep convolutional neural networks. In International Conference on Medical Image Computing and Computer-Assisted Intervention. Springer, Cham. doi: 10.1007/978-3-319-66179-7_64.
- Ding J. 2017b. Accurate pulmonary nodule detection in computed tomography images using deep convolutional neural networks. In Medical Image Computing and Computer Assisted Intervention− MICCAI 2017: 20th International Conference, Quebec City, QC, Canada, September 11-13, 2017, Proceedings, Part III 20. Springer.
- Ding X, Li Q, Cheng Y, Wang J, Bian W, Jie B. 2020. Local keypoint-based faster R-CNN. Appl Intell. 50(10):3007–3022. doi: 10.1007/s10489-020-01665-9.
- Ding S, Wang H, Lu H, Nappi M, Wan S. 2022. Two path gland segmentation algorithm of colon pathological image based on local semantic guidance. IEEE J Biomed Health Inform. 27(4):1701–1708. doi: 10.1109/JBHI.2022.3207874.
- Dou Q, Chen H, Yu L, Qin J, Heng P-A. 2017. Multilevel contextual 3-D CNNs for false positive reduction in pulmonary nodule detection. IEEE Trans Biomed Eng. 64(7):1558–1567. doi: 10.1109/TBME.2016.2613502.
- El-Bana S, Al-Kabbany A, Sharkas M. 2020. A two-stage framework for automated malignant pulmonary nodule detection in CT scans. Diagnostics. 10(3):131. doi: 10.3390/diagnostics10030131.
- Faster R. 2015. Towards real-time object detection with region proposal networks. Adv Neural Inf Process Syst. 9199. doi: 10.48550/arXiv.1506.01497.
- Goutte C and Gaussier E. 2005. A probabilistic interpretation of precision, recall and F-score, with implication for evaluation. In European conference on information retrieval. Springer, Berlin, Heidelberg. p. 345–359. doi: 10.1007/978-3-540-31865-1_25 .
- Gu Y, Lu X, Yang L, Zhang B, Yu D, Zhao Y, Gao L, Wu L, Zhou T. 2018. Automatic lung nodule detection using a 3D deep convolutional neural network combined with a multi-scale prediction strategy in chest CTs. Comput Biol Med. 103:220–231. doi: 10.1016/j.compbiomed.2018.10.011.
- Han G, Liu X, Zhang H, Zheng G, Soomro NQ, Wang M, Liu W. 2019. Hybrid resampling and multi-feature fusion for automatic recognition of cavity imaging sign in lung CT. Future Gen Compt Syst. 99:558–570. doi: 10.1016/j.future.2019.05.009.
- Harvey EC, Feng M, Ji X, Zhang R, Li Y, Chen G-H, Li K. 2019. Impacts of photon counting CT to maximum intensity projection (MIP) images of cerebral CT angiography: theoretical and experimental studies. Phys Med Biol. 64(18):185015. doi: 10.1088/1361-6560/ab32fe.
- Hasan SM, Uddin MP, Mamun MA, Sharif MI, Ulhaq A, Krishnamoorthy G. 2022. A machine learning framework for early-stage detection of autism spectrum disorders. IEEE Access. 11:15038–15057. doi: 10.1109/ACCESS.2022.3232490.
- He K. 2016. Deep residual learning for image recognition. In Proceedings of the IEEE conference on computer vision and pattern recognition. p. 770–778. http://image-net.org/challenges/LSVRC/2015.
- Hinton GE. 2012. Improving neural networks by preventing co-adaptation of feature detectors. arXiv preprint arXiv:1207.0580.
- Howard AG. 2017. Mobilenets: efficient convolutional neural networks for mobile vision applications. arXiv preprint arXiv:1704.04861.
- Huang X, Sun W, Tseng TL(, Li C, Qian W. 2019. Fast and fully-automated detection and segmentation of pulmonary nodules in thoracic CT scans using deep convolutional neural networks. Comput Med Imaging Graphics. 74:25–36. doi: 10.1016/j.compmedimag.2019.02.003.
- Hussain MA, et al. 2015. Lung cancer detection using artificial neural network & fuzzy clustering. Int J Adv Res Comput Commun Eng. 4(3):360–363. doi: 10.17148/IJARCCE.2015.4386.
- Jaffe TA, Wickersham NW, Sullivan DC. 2010. Quantitative imaging in oncology patients: part 1, radiology practice patterns at major US cancer centers. AJR Am J Roentgenol. 195(1):101–106. doi: 10.2214/AJR.09.2850.
- Jin H, Li Z, Tong R, Lin L. 2018. A deep 3D residual CNN for false‐positive reduction in pulmonary nodule detection. Med Phys. 45(5):2097–2107. doi: 10.1002/mp.12846.
- Jun TJ. 2019. T-Net: encoder-decoder in encoder-decoder architecture for the main vessel segmentation in coronary angiography. arXiv preprint arXiv:1905.04197.
- Khan MA, Rubab S, Kashif A, Sharif MI, Muhammad N, Shah JH, Zhang Y-D, Satapathy SC. 2020. Lungs cancer classification from CT images: an integrated design of contrast based classical features fusion and selection. Pattern Recognit Lett. 129:77–85. doi: 10.1016/j.patrec.2019.11.014.
- Khan MA, Sharif MI, Raza M, Anjum A, Saba T, Shad SA. 2022. Skin lesion segmentation and classification: a unified framework of deep neural network features fusion and selection. Expert Syst. 39(7):e12497. doi: 10.1111/exsy.12497.
- Khosravan N and Bagci U. 2018. S4ND: single-shot single-scale lung nodule detection. In International Conference on Medical Image Computing and Computer-Assisted Intervention. : Springer, Cham. p. 794–802. doi: 10.1007/978-3-030-00934-2_88.
- Kingma DP, Ba J. 2014. Adam: a method for stochastic optimization. arXiv preprint arXiv:1412.6980.
- Kong T. 2016. Hypernet: towards accurate region proposal generation and joint object detection. In Proceedings of the IEEE conference on computer vision and pattern recognition; p. 845–853.
- Lan T. 2018. Run: residual u-net for computer-aided detection of pulmonary nodules without candidate selection. arXiv preprint arXiv:1805.11856.
- Liao F, Liang M, Li Z, Hu X, Song S. 2019. Evaluate the malignancy of pulmonary nodules using the 3-d deep leaky noisy-or network. IEEE Trans Neural Netw Learning Syst. 30(11):3484–3495. doi: 10.1109/TNNLS.2019.2892409.
- Li W, Cao P, Zhao D, Wang J. 2016. Pulmonary nodule classification with deep convolutional neural networks on computed tomography images. Comput Math Method M. 2016:1–7. doi: 10.1155/2016/6215085.
- Li B, Liu S, Wu F, Li G, Zhong M, Guan X. 2022. RT‐Unet: an advanced network based on residual network and transformer for medical image segmentation. Int J Intell Sys. 37(11):8565–8582. doi: 10.1002/int.22956.
- Liu M, Zhou Z, Liu F, Wang M, Wang Y, Gao M, Sun H, Zhang X, Yang T, Ji L, et al. 2022. CT and CEA -based machine learning model for predicting malignant pulmonary nodules. Cancer Sci. 113(12):4363–4373. doi: 10.1111/cas.15561.
- Lokhandwala T. 2017. Costs of diagnostic assessment for lung cancer: a medicare claims analysis. Clin Lung Cancer. 18(1):e27–e34. doi: 10.1016/j.cllc.2016.07.006.
- Masood A, Yang P, Sheng B, Li H, Li P, Qin J, Lanfranchi V, Kim J, Feng DD. 2019. Cloud-based automated clinical decision support system for detection and diagnosis of lung cancer in chest CT. IEEE J Transl Eng Health Med. 8:1–13. doi: 10.1109/JTEHM.2019.2955458.
- Men K, Boimel P, Janopaul-Naylor J, Zhong H, Huang M, Geng H, Cheng C, Fan Y, Plastaras JP, Ben-Josef E, et al. 2018. Cascaded atrous convolution and spatial pyramid pooling for more accurate tumor target segmentation for rectal cancer radiotherapy. Phys Med Biol. 63(18):185016. doi: 10.1088/1361-6560/aada6c.
- Morozov SP, Andreychenko AE, Blokhin IA, Gelezhe PB, Gonchar AP, Nikolaev AE, Pavlov NA, Chernina VY, Gombolevskiy VA. 2020. MosMedData: data set of 1110 chest CT scans performed during the COVID-19 epidemic. Digital Diagn. 1(1):49–59. doi: 10.17816/DD46826.
- Mou L, Hua Y, Jin P, Zhu XX. 2020. ERA: a data set and deep learning benchmark for event recognition in aerial videos [software and data sets]. IEEE Geosci Remote Sens Mag. 8(4):125–133. doi: 10.1109/MGRS.2020.3005751.
- Nguyen N-Q, Lee S-W. 2019. Robust boundary segmentation in medical images using a consecutive deep encoder-decoder network. IEEE Access. 7:33795–33808. doi: 10.1109/ACCESS.2019.2904094.
- Ni B, Liu Z, Cai X, Nappi M, Wan S. 2023. Segmentation of ultrasound image sequences by combing a novel deep siamese network with a deformable contour model. Neural Comput Applic. 35(20):14535–14549. doi: 10.1007/s00521-022-07054-2.
- Rahman MA and Wang Y. 2016. Optimizing intersection-over-union in deep neural networks for image segmentation. In International symposium on visual computing. Springer, Cham. p. 234–244. doi: 10.1007/978-3-319-50835-1_22.
- Ren S, He K, Girshick R, Sun J. 2017. Faster r-cnn: towards real-time object detection with region proposal networks. IEEE Trans Pattern Anal Mach Intell. 39(6):1137–1149. doi: 10.1109/TPAMI.2016.2577031.
- Rippel O, Snoek J, Adams RP. 2015. Spectral representations for convolutional neural networks. Adv Neural Inf Process Syst. 28:2449–2457.
- Setio AAA, Traverso A, de Bel T, Berens MSN, Bogaard CVD, Cerello P, Chen H, Dou Q, Fantacci ME, Geurts B, et al. 2017. Validation, comparison, and combination of algorithms for automatic detection of pulmonary nodules in computed tomography images: the LUNA16 challenge. Med Image Anal. 42:1–13. doi: 10.1016/j.media.2017.06.015.
- Sharif MI. 2021. A decision support system for multimodal brain tumor classification using deep learning. Complex & Intelligent Systems. 1–14. doi: 10.1007/s40747-021-00321-0.
- Shih K-H. 2019. Real-time object detection with reduced region proposal network via multi-feature concatenation. In IEEE transactions on neural networks and learning systems. p. 2164–2173. doi: 10.1109/TNNLS.2019.2929059.
- Shi L, Ma H, Zhang J. 2020. Automatic detection of pulmonary nodules in CT images based on 3D res-I network. Vis Comput. 37(6):1–14. doi: 10.1007/s00371-020-01869-7.
- Simonyan K and Zisserman A. 2014. Very deep convolutional networks for large-scale image recognition. arXiv preprint arXiv:1409.1556.
- Singh SP, Wang L, Gupta S, Goli H, Padmanabhan P, Gulyás B. 2020. 3D deep learning on medical images: a review. Sensors. 20(18):5097. doi: 10.3390/s20185097.
- Srivastava N. 2014. Dropout: a simple way to prevent neural networks from overfitting. J Mach Learn Res. 15(1):1929–1958.
- Sun W, Zheng B, Qian W. 2017. Automatic feature learning using multichannel ROI based on deep structured algorithms for computerized lung cancer diagnosis. Comput Biol Med. 89:530–539. doi:10.1016/j.compbiomed.2017.04.006.
- Tran GS, Nghiem TP, Nguyen VT, Luong CM, Burie J-C. 2019. Improving accuracy of lung nodule classification using deep learning with focal loss. J Healthc Eng. 2019:1–9. doi: 10.1155/2019/5156416.
- Uijlings JR, van de Sande KEA, Gevers T, Smeulders AWM. 2013. Selective search for object recognition. Int J Comput Vis. 104(2):154–171. doi: 10.1007/s11263-013-0620-5.
- Umer MJ, Sharif MI. 2022. A comprehensive survey on quantum machine learning and possible applications. Int J E-Health Med Commun. 13(5):1–17. doi: 10.4018/IJEHMC.315730.
- Wang S-H, Fernandes SL, Zhu Z, Zhang Y-D. 2021. AVNC: attention-based VGG-style network for COVID-19 diagnosis by CBAM. IEEE Sensors J. 22(18):17431–17438. doi: 10.1109/JSEN.2021.3062442.
- Wang S, Yang DM, Rong R, Zhan X, Fujimoto J, Liu H, Minna J, Wistuba II, Xie Y, Xiao G, et al. 2019. Artificial intelligence in lung cancer pathology image analysis. Cancers. 11(11):1673. doi:10.3390/cancers11111673.
- Wei J. 2019. P3D-CTN: pseudo-3D convolutional tube network for spatio-temporal action detection in videos. In 2019 IEEE International Conference on Image Processing (ICIP); 22-25 September 2019; IEEE. doi: 10.1109/ICIP.2019.8802979.
- Wu Y. 2023. Cdt-cad: context-aware deformable transformers for end-to-end chest abnormality detection on x-ray images. IEEE/ACM Transactions on Computational Biology and Bioinformatics. doi: 10.1109/tcbb.2023.3258455.
- Wu Z, Su L, and Huang Q. 2019. Cascaded partial decoder for fast and accurate salient object detection. In Proceedings of the IEEE/CVF Conference on Computer Vision and Pattern Recognition. doi: 10.48550/arXiv.1904.08739.
- Xie H, Yang D, Sun N, Chen Z, Zhang Y. 2019. Automated pulmonary nodule detection in CT images using deep convolutional neural networks. Pattern Recognit. 85:109–119. doi: 10.1016/j.patcog.2018.07.031.
- Zafar M, Sharif MI, Sharif MI, Kadry S, Bukhari SAC, Rauf HT. 2023. Skin lesion analysis and cancer detection based on machine/deep learning techniques: a comprehensive survey. Life. 13(1):146. doi: 10.3390/life13010146.
- Zagoruyko S and Komodakis N. 2016. Wide residual networks. arXiv preprint arXiv:1605.07146.
- Zhang G. 2018. Spatial pyramid dilated network for pulmonary nodule malignancy classification. In 2018 24th International Conference on Pattern Recognition (ICPR). IEEE.
- Zhang Y, Attique Khan M, Zhu Z, Wang S. 2023. SNELM: SqueezeNet-guided ELM for COVID-19 recognition. Comput Syst Sci Eng. 46(1):13. doi: 10.32604/csse.2023.034172.
- Zhang H, Peng Y, Guo Y. 2022. Pulmonary nodules detection based on multi-scale attention networks. Sci Rep. 12(1):1–14. doi: 10.1038/s41598-022-05372-y.
- Zhao C. 2018. Lung nodule detection via 3D U-Net and contextual convolutional neural network. In 2018 International Conference on Networking and Network Applications (NaNA); Xi'an, China; IEEE. p. 356–361. doi: 10.1109/NANA.2018.8648753.
- Zhong Z, Sun L, Huo Q. 2019. An anchor-free region proposal network for faster R-CNN-based text detection approaches. Int J Doc Anal Recogn. 22(3):315–327. doi: 10.1007/s10032-019-00335-y.
- Zhou H, Jin Y, Dai L, Zhang M, Qiu Y, Wang K, Tian J, Zheng J. 2020. Differential diagnosis of benign and malignant thyroid nodules using deep learning radiomics of thyroid ultrasound images. Eur J Radiol. 127:108992. doi: 10.1016/j.ejrad.2020.108992.
- Zhu W. 2018a. Deepem: deep 3d convnets with em for weakly supervised pulmonary nodule detection. In International Conference on Medical Image Computing and Computer-Assisted Intervention. Springer. doi: 10.1007/978-3-030-00934-2_90.
- Zhu W. 2018b. Deeplung: deep 3d dual path nets for automated pulmonary nodule detection and classification. In 2018 IEEE Winter Conference on Applications of Computer Vision (WACV); 12–15 March 2018; Lake Tahoe, NV, USA: IEEE. doi: 10.1109/WACV.2018.00079.