
 ?Mathematical formulae have been encoded as MathML and are displayed in this HTML version using MathJax in order to improve their display. Uncheck the box to turn MathJax off. This feature requires Javascript. Click on a formula to zoom.
ABSTRACT
Nowadays, deep neural networks (DNNs) are helpful tools for mammogram classification in breast cancer screening. But, in Vietnam, there is a relatively small number of mammograms for training DNNs. Therefore, this study aims to apply transfer learning techniques to improve the performance of DNN models. In the first step, 10,418 breast cancer images from the Digital Database for Screening Mammography were used for training the CNN model ResNet 34. In the second step, we fine-tune this model on the Hanoi Medical University (HMU) database with 6,248 Vietnamese mammograms. The optimal model of ResNet 34 among these models achieves a macAUC of 0.766 in classifying breast cancer X-ray images into three Breast Imaging-Reporting and Data System (BI-RADS) categories, BI-RADS 045 (‘incomplete and malignance’), BI-RADS 1 (‘normal’), and BI-RADS 23 (‘benign’), when tested on the test dataset. This result is higher than the result of the ResNet 50 model trained only on the X-ray dataset of 7,912 breast cancer images of the HMU dataset, which achieves a macAUC of 0.754. A comparison of the performance of the proposed model of ResNet 34 applying transfer learning with other works shows that our model’s evaluation results are higher than those of the compared models.
Introduction
Breast cancer has become the most common form of cancer in women worldwide. According to the Global Cancer Observatory (GLOBOCAN), there were approximately 2.26 million new cases and nearly 685,000 deaths from breast cancer in 2020. In Vietnam, the rate of breast cancer was calculated as 23 per 100,000 women in 2012, and it continuously increased (Trieu et al. Citation2015). In 2020, the number of newly diagnosed women was 21,555, making up more than a quarter of total cancer cases in Vietnam (Sung et al. Citation2021). Such a dramatic surge in new cases is partly due to the increasing availability of screening methods like X-ray mammography. Breast cancer screening based on X-ray mammography has an important role in decreasing breast cancer mortality by 20–22% (Marmot et al. Citation2013; Tab Ár L et al. Citation2015; Machida et al. Citation2015).
Therefore, X-ray breast cancer screening methods are of utmost importance. However, Vietnamese radiologists need more to meet the demand for population health care, both in quality and quantity. In Vietnam, in addition to a shortage of general radiologists per population, there is a need for more specialised radiologists in mammography. Furthermore, the training framework for radiologists needs to include specialised training in mammography. Those performing mammography are all general radiologists who are self-trained to carry out the procedure (Duc et al. Citation2019).
In addition, the gap in capability between different hospital levels is also a severe problem. The patients tend to skip local hospitals to go to higher-level ones, leading to a constant overload state of the latter. As a result, there is a significant disparity in expertise between radiologists at national hospitals and those at provincial and district levels. Radiologists at national hospitals often perform mammography on many patients, whereas doctors at provincial and district levels have far fewer cases of mammography interpretation. Additionally, the majority of Vietnamese women have breast characteristics categorised as high density (Types C and D) according to the American Cancer Society’s classification, where breasts are incredibly dense, which makes it harder to see masses or other findings that may appear as white areas on the mammogram (American Cancer Society ACS Citation2023). Therefore, it is necessary to have a dedicated result interpretation support system for the Vietnamese female population. Breast Imaging-Reporting and Data System (BI-RADS) developed by the (American College of Radiology (ACR), Citation2023) is used worldwide for screening and guidance in managing breast lesions detected on mammography. As a result, breast lesions are classified in BI-RADS scale from 0 to 6 (American Cancer Society ACS Citation2023). According to the BI-RADS classification, the BI-RADS 0 needs to have additional imaging evaluation; BI-RADS 1, BI-RADS 2 and BI-RADS 3 correspond with negative, benign and probably benign lesions; BI-RADS 4 and 5 correspond with probably malignant and highly suggestive of malignancy and BI-RADS 6 means malignancy is already known.
Based on the classification, our study aims to improve a deep neural network (DNN) mammogram classification system to classify X-ray mammograms into three BI-RADS categories, including BI-RADS 045 (consisting of BI-RADS 0, BI-RADS 4 and BI-RADS 5), BI-RADS 1 and BI-RADS 23 (consisting of BI-RADS 2 and BI-RADS 3) by transfer learning (Yang et al. Citation2020). This study uses the deep convolutional neural network (CNN)-based Residual Network (ResNet 34) pre-trained on ImageNet (a large-scale hierarchical image database) to fine-tune it on the public digital DDSM dataset and the HMU dataset.
To summarise, the main contributions of this paper are:
Using DDSM dataset to pre-train the ResNet 34 model dataset to classify mammograms into three categories BI-RADS 045, BI-RADS 1 and BI-RADS 23.
Collecting and labelling the mammograms of the Vietnamese patients and classifying these mammograms into BI-RADS 045, BI-RADS 1 and BI-RADS 23 categories.
Fine-tuning the received DDSM pre-trained model on Vietnamese patients’ breast cancer X-ray dataset (HMU).
Comparing the performance of the proposed model with the other works shows that our model’s result is higher than the result of the compared model.
The rest of the paper is organised as follows: Section 2 reviews some related works; Section 3 presents data collection and labelling; Section 4 proposes the methodology; Section 5 gives the model evaluation and Section 6 discusses some conclusions and future works.
Related works
In recent years, some works relating to the field of developing intelligent systems for the classification of breast cancer X-ray images were studied (Mansour Citation2020; Ranjbarzadeh et al. Citation2021, Citation2023; Escorcia-Gutierrez Citation2022). Some other works are more related to our study in developing a system for mammogram classification of BI-RADS categories. (Geras et al. Citation2018) develop a classification system called a multi-view deep convolutional network (MV-DCN). The authors train this model on full high-resolution images of the multiple views of screening mammography. This model can classify an example as BI-RADS 1 (‘normal’), BI-RADS 2 (‘having benign mass’) and BI-RADS 0 (‘incomplete’). In their study, the authors built a large-scale dataset of 201,698 screening exams consisting of 886,437 images. The MV-DNN network achieves a macAUC (macro average of three AUCs) of 0.733 using 886,437 images with high resolution of the image (full image). The other study of (Bui et al. Citation2022) presents a method for classifying mammograms of Vietnamese patients into three categories of BI-RADS: BI-RADS 1 – the breast is normal, BI-RADS 23 (including BI-RADS 2 and BI-RADS 3) – the breast is abnormal with benign mass and BI-RADS 045 (including BI-RADS 0, BI-RADS 4 and BI-RADS 5) – cannot evaluate a lesion level in breast cancer X-Ray image, additional examinations are required or the breast has a lesion with a high malignant rate. This mammogram classification system for breast cancer screening is developed based on CNNs with the ResNet 50 deep learning model as the basic framework. The system is trained and tested on an X-ray dataset of Vietnamese patients containing 7,912 mammograms provided by radiologists from Hanoi Medical University (HMU) Hospital. The system accuracy using the testing set achieved a macAUC of 0.754.
The novelty of the proposed model in comparison with the work of (Geras et al. Citation2018) is that the authors used 886,437 images with high resolution for training the MV-DNN network for classifying three BI-RADS categories and the network achieves a macAUC of 0.733. This study applies a transfer learning technique, which means the ResNet 34 model is pre-trained on DDSM data first and then fine-tuned on HMU data; therefore, it needs to use only 6,248 breast cancer X-ray images for training the ResNet 34 model for classifying the similar three BI-RADS categories, and the network achieves a similar macAUC of 0.76609. In (Bui et al. Citation2022), the authors used 7,912 breast cancer X-ray images for training the ResNet 50 model for classifying three BI-RADS categories as BI-RADS 1, BI-RADS 23 and BI-RADS 045, and the network achieves a macAUC of 0.754. This study applies a transfer learning technique, which means the ResNet 34 model was pre-trained on DDSM data first and then fine-tuned on HMU data. It needs to use fewer breast cancer X-ray images with 6,248 images for training the ResNet 34 model for classifying the same three BI-RADS categories, and the proposed model achieves a macAUC of 0.76609, which is higher than the result in (Bui et al. Citation2022).
Data collection and labeling
This study aims to develop a breast cancer X-ray image classification system to assist in diagnosing breast cancer inr Vietnamese patients; therefore, the HMU Hospital radiologists will build a mammogram dataset based on Vietnamese volunteers. All volunteer information will be replaced with an identification code before being delivered to the research team. According to the routine protocol, all patients with breast cancer screening have mammography images taken in four views: left craniocaudal (L-CC), left mediolateral oblique (L-MLO), right craniocaudal (R-CC) and right mediolateral oblique (R-MLO). Interpretation of mammography films is based on the BI-RADS classification of ACR 2013 (Carl and D’Orsi Citation2013), including BI-RADS 0 (Incomplete assessment, additional testing is needed), BI-RADS 1 (Negative), BI-RADS 2 (Benign), BI-RADS 3 (Probably benign), BI-RADS 4 (Suspicious of malignancy, i.e. the likelihood from 2% to 95%) and BI-RADS 5 (Highly suggestive of malignancy, the likelihood ≥ 95%). Two experienced radiologists (with at least 10 years of experience) interpreted the BI-RADS classification. If the result were different, another experienced radiologist (with at least 20 years of experience) would interpret the X-ray images and give the final BI-RADS classification. In this study, the radiologists of the HMU Hospital classified the patients into three types: 1) patients with normal breasts, there was no need for follow-up; 2) patients with breasts having benign mass: a regular follow-up was needed; and 3) patients with breast lesions: additional examinations and testing were required. Therefore, we distributed the BI-RADS into three categories – BI-RADS 1: normal breast, there is no suspected lesion, BI-RADS 23: breast lesion with benign findings and BI-RADS 045: a lesion cannot be evaluated on breast X-ray image or a lesion with a high risk of malignancy, other diagnosis modalities were required. Examples of breast cancer screening images of a patient: L-MLO and L-CC images of the DDSM and HMU databases are shown in .
Figure 1. Examples of breast cancer screening images of a patient. Image a), Image b), Image c) and image d).
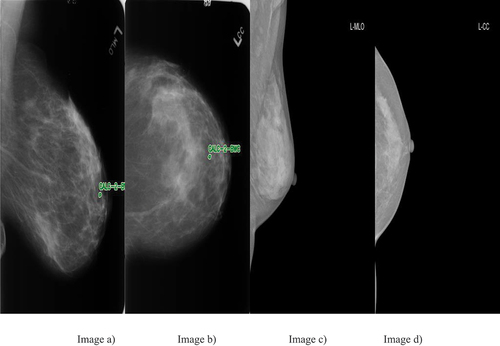
The breast cancer screening images of a patient from left to right: The first two images of are L-MLO and L-CC of DDSM database. The third and fourth images are L-MLO and L-CC of HMU database.
Figure 2. The main flow diagram.
In the field of research on X-ray-based breast cancer screening, the Digital Database for Screening Mammography (DDSM) is commonly used (Heath et al. Citation2001). This public dataset has about 10,000 X-ray images. However, the Curated Breast-Imaging Subset (CBIS-DDSM) dataset is a part of the DDSM dataset that contains only images labelled as benign or malignant mass. However, this dataset is acquired by scanning from X-ray images. Other datasets are as small as the Mammographic Image Analysis Society (MIAS) dataset, consisting of only 322 images (Suckling et al. Citation1994). Therefore, the DDSM dataset was used for the study because this dataset is much larger in comparison with the MIAS dataset.
In this study, the images from the dataset of DDSM are selected and distributed randomly into two sets: the training dataset contains 80% of the data (8,335 images). In contrast, the validation dataset contains 20% of the data (2,083 images) ().
Table 1. DDSM dataset divided into the training set and a validation set by BI-RADS and views.
Furthermore, the dataset of HMU is categorised into three sets: the training dataset contains 3,898 images amounting to 60% of the data, the validation dataset contains 20% of the data with 1,208 images and the test dataset contains 20% of the data with 1,142 images ().
Table 2. HMU dataset divided into training set, validation set and test set of mammograms by BI-RADS and views.
In , the data are not balanced. This means that the number of L-CC images in the training set is not the same as that of R-CC images. This is because some patients have only X-rays on one breast.
Methodology
System design
In this study, two datasets used for training the CNN model are a public DDSM dataset and the HMU dataset, which radiologists of the HMU Hospital provide. These datasets are described in detail in . Because of the relatively small number of X-ray images of HMU dataset, we apply transfer learning to improve the robustness and performance of our model. Transfer learning reuses parts of a model pre-trained on another task as a starting point for training the target model, taking advantage of the learned representations from the pre-training task (Yang et al. Citation2020). For the proposed model, we apply a two-stage architecture and training procedure, which allows us to transfer learning from the ResNet 34 model pre-trained on DDSM public database and then the received DDSM pre-trained ResNet 34 model used to train our model on the breast cancer X-ray dataset of Vietnamese patients (HMU). The main flow diagram of this study is described clearly in . The DDSM and HMU datasets are processed before being pushed into training steps. There are two stages of training. The first stage is the training phase with the DDSM dataset and the second stage is the training phase with the HMU dataset. After training, the CNN model is evaluated to clarify the benefit of this study.
Based on the main flow diagram, the system’s general architecture for BI-RADS classification is designed in .
Figure 3. General architecture of the system for classification of BI-RADS.
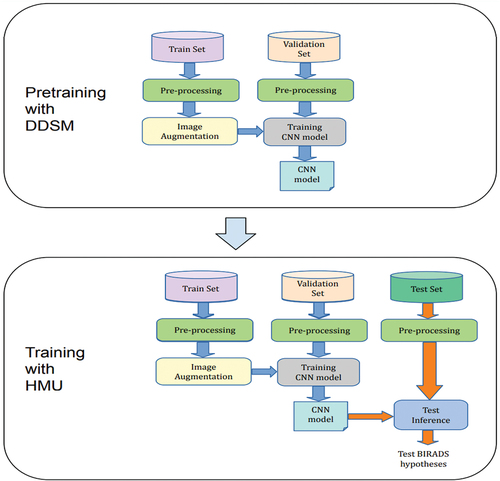
In the first stage of pre-training with DDSM dataset, the dataset of DDSM is divided into the training set and the validation set. After pre-processing and augmentation of data, the ResNet 34 model is trained. During the data training, the validation set is used for finding and optimising the best model.
In the second stage of training with HMU dataset, the best model of the first stage is used for training with the HMU dataset. The HMU dataset is divided into three parts, including the training dataset, the validation dataset and the test dataset. Similarly, after pre-processing and augmentation of data, the CNN model is trained. During the data training, the validation dataset is used for finding and optimising the best model. Then, the test dataset was used to evaluate the final model for classifying BI-RADS into three categories, including BI-RADS 045, BI-RADS 1 and BI-RADS 23.
Data pre-processing
In , firstly, the image data in DICOM (Digital Imaging and Communication in Medicine) file was converted to a 16-bit PNG format. Subsequently, these images underwent a pre-processing step. The training dataset was augmented, and these new data were used to train the CNN model, which is described in . The validation dataset was used to stop control of the training process. The trained CNN models were applied for experiments with the images in the test dataset. The results provided the probabilities of every BI-RADS class on each image in the test dataset.
Figure 4. The image pre-processing scheme.
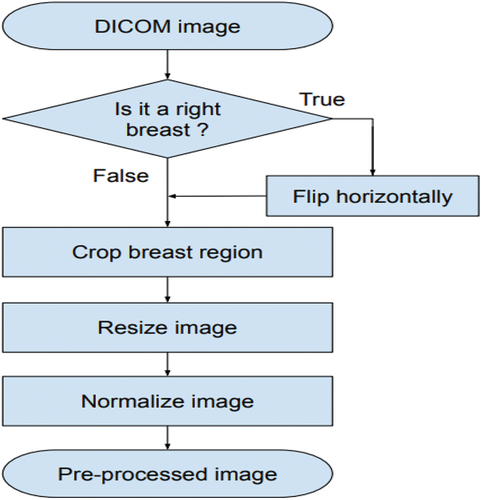
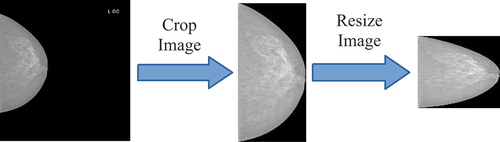
The image pre-processing scheme is presented in . Firstly, the images of R-CC and R-MLO views horizontally before feeding them to the model so that all breast images were leftward-oriented, allowing the shared ResNet weighted to operate on similarly oriented images.
Secondly, the breast region was divided based on image-processing techniques: all images are cropped by probing along the edge of the breast. After that, this image was resized to 512 × 512 pixels. Finally, each image was normalised by scaling to a min value of 0 and max value of 1 (see EquationEquation 1(1)
(1) ).
An example of the pre-processing process is described in .
Figure 5. Example of the pre-processing process.
The formula for normalising images is presented in EquationEquation 1(1)
(1) .
In EquationEquation 1(1)
(1) , there is a pixel in an image, and µ and δ are the mean and the standard deviation, which are calculated on all pixels in the image.
Augmentation
The augmentation technique is used in the training phase. In this phase, all breast X-ray images are augmented before being pushed into the training function. The augmentation process is realised by geometry transformation, such as scaling, translating and rotating. In the training process, firstly, input images with the size of 512 × 512 pixels are transformed as new images by the transform methods such as scaling, translating and rotating:
Scaling transformation: In this method, the images of 512 × 512 pixels are scaled to 90%−110% of their size, individually per axis. In this case, the scaling value is elected randomly from 90% to 110%.
Translating transformation: In this method, the images of 512 × 512 pixels are translated by −10% to +10% per axis. In this case, the images are translated randomly to the left (negative value), to the right (positive value), to the top (negative value) and to the bottom (positive value). This translating rate is chosen randomly in the interval of [0,10%].
Rotating transformation: In this method, the images of 512 × 512 pixels are rotated by −5 to +5 degrees. In this case, the images are rotated randomly from 0 to 5 degrees. The negative value means rotating to the left, and the positive value means rotating to the right.
All transformations are realised on input images, and then the new images are created. These images are used in the training process as follows:
In the training set, every X image is checked step by step.
This X image is put into RAM of the server.
Transforming X image to X’ image. Image X’ is stored in RAM, but these images are not stored in the disks. Using images X’ as input for the ResNet 34 model by the backpropagation algorithm. In this case, breast cancer augmentation is realised by replacing/transforming original images on-the-fly. This results in the following: every epoch will have a new training dataset. Finally, after augmentation, the total training-set size is the number of epochs multiplied by the original data_set_size.
is an example of images received in the image augmentation process. These images are created by separating images, transforming the code above and storing eight images, resulting in eight times image transformation.
Figure 6. Example of images received in the image augmentation process.
Model training
The training processes of the model ResNet 34 pre-trained on ImageNet were realised on a server with the following configuration:
CPU: Intel Core i9-7900X (3.30 GHz)
RAM: 128 GB
Two hard disks: one 500 GB SSD and one 4 TB HDD
Two GPUs: NVIDIA RTX2080TI (11GB).
The server runs the OS Linux Ubuntu 16.04.3 LTS operating system with libraries supporting the algorithms of deep learning on GPU containing NVIDIA CUDA 8.0.61 and NVIDIA CUDA 6.0.21. The deep learning system has been developed on PyTorch.
Reduce Learning Rate on Plateau techniques were used in the training process, with the following configuration:
Start learning rate: 10-5.
Minimum learning rate: 10-8 (lower bound on the learning rate).
The CNN model architecture for BI-RADS classification is described in . In this architecture, the CNN is a backbone ResNet 34, and Pooling layer and Flatten layer are added next to it. From here, the feature is 1D. After that, there is a main process of two dense layers. The first dense layer is 256, and the second dense layer is 3.
Figure 7. CNN network architecture for classification of BI-RADS (backbone ResNet 34).
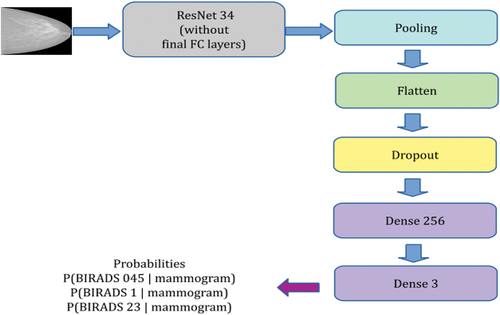
Before feeding to the first dense layer, the feature is normalised by BatchNorm to make training of CNN networks faster and more stable through normalisation by re-centring and re-scaling and by Dropout, which is a technique where randomly selected neurons are ignored during training. They are ‘dropped out’ randomly. This means that their contribution to the activation of downstream neurons is temporally removed on the forward pass, and any weight update is not applied to the neuron on the backward pass. After this layer, the features will be fed to the Rectified Linear Unit (ReLU) activation function. ReLu function as f(x) = max(0,x) is a piecewise linear function that will output the input directly if it is positive; otherwise, it will output zero. We chose this activation function because a CNN model that uses it is easier to train and often achieves better performance (Contreras et al. Citation2022). The second dense layer will create a prediction. Similarly, before feeding to the last dense layer, the feature is normalised by BatchNorm. This dense layer is connected with the SoftMax function for BI-RADS classification. This function converts a vector of probabilities, where the probabilities of each value are proportional to the relative scale of each value in the vector. The output of the model (which is the output of SoftMax layer) includes a three-dimensional vector, which represents the probabilities of BI-RADS 045, BI-RADS 1 and BI-RADS 23 categories with the mammogram given in size of 512 × 512 × 3.
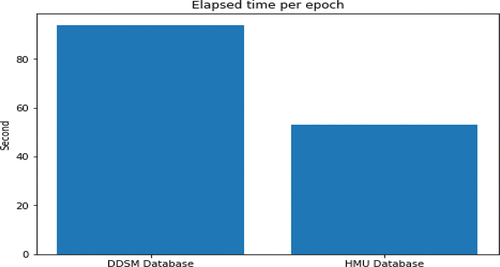
shows a variation graph of the loss values of the training set and validation set in the training process. From the graph, we observe that the training process achieves an optimisation position in epoch 71; after that the learning rate is very low (2.5e-8 and reducing), and the network has been changed very little. Therefore, the model state at epoch 71 was used to experiment on the test set. On the other hand, due to the different image numbers of the training databases of DDSM and HMU, the training times per epoch are different according to the different training databases. The approximate time for training DDSM database per epoch is 1 hour and 34 seconds, and the approximate time for training HMU database per epoch is 53 seconds. shows the training time per epoch of DDSM and HMU databases.
Figure 8. Graph of losses of train set and validation set according to the epochs during training.
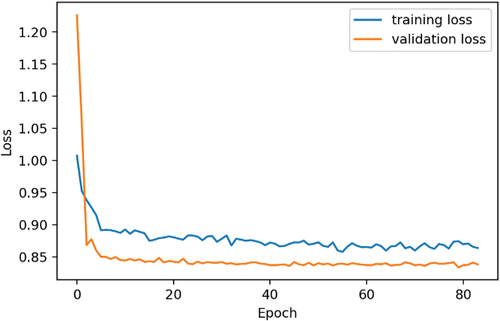
Figure 9. The training time per epoch of DDSM and HMU databases.
Model evaluation
For choosing evaluation metrics, when there are two classes, the most frequently applied performance metric is the area under the ROC curve (AUC). However, in this study, there were three classes in our learning task, so this metric could not be applied directly. Instead of that, three AUCs are computed, each time treating one of three classes as positive class and the remaining two as negative. The macro average of the three AUCs, abbreviated as macAUC, is used as the main performance metric in this study.
shows that the macro average of three AUCs (as AUC of BI-RADS 045 vs. others is 0.74019, AUC of BI-RADS 1 vs. others is 0.79941 and AUC of BI-RADS 23 vs. others is 0.75866) of the proposed model called a macAUC obtains the value of 0.76609.
Table 3. Method result using DDSM and HMU databases.
Similarly, the model achieves the average sensitivity (as the sensitivity of BI-RADS 045 vs. others, the sensitivity of BI-RADS 1 vs. others and the sensitivity of BI-RADS 23 vs. others) and the average specificity (as the specificity of BI-RADS 045 vs. others, specificity of BI-RADS 1 vs. others and specificity of BI-RADS 23 vs. others), which take the values of 0.5850 and of 0.7942, respectively.
presents a confusion matrix of the test set with the model based on ResNet 34 backbone. It shows the following:
Table 4. Confusion matrix of the test dataset with the model based on backbone ResNet 34.
- Among 404 images of BI-RADS 045, the system correctly recognised 270 images (66.83%), 95 images were misrecognised as images of BI-RADS 1 (23.51%) and 39 images were misrecognised as images of BI-RADS 23 (9.65%).
- Besides, among 402 images of BI-RADS 1, the system correctly recognised 279 images (69.4%), 104 images were misrecognised as images of BI-RADS 045 (25.87%) and 19 images were misrecognised as images of BI-RADS 23 (4.73%).
- Of 336 of BIRADS 23, the system correctly recognised 132 images (39.29%), 112 images were misrecognised as images of BI-RADS 045 (33.33%) and 92 images were misrecognised as images of BI-RADS 1 (27.38%).
The above findings demonstrate that the system is able to recognise the best for BI-RADS 1. From our point of view, the nature of the structure of the normal images of BI-RADS 1 is simple, not complicated; therefore, the CNN models are easy to recognise BI-RADS 1. In contrast, the system recognises BI-RADS 23 poorly; the nature of the structure of BI-RADS 23 images consisting of BI-RADS 2 and BI-RADS 3 is more complicated; therefore, the CNN models have difficulty in recognising BI-RADS 23.
Moreover, the ResNet 34 model is trained with only the HMU database of to classify BI-RADS 045, BI-RADS 1 and BI-RADS 23. The comparison of the method result using only HMU database and the method result using DDSM and HMU databases are shown in .
Table 5. Comparison of the method result using only HMU database and the method result using DDSM and HMU databases.
shows that to classify the mammograms into three classes of BI-RADS 045, BI-RADS 1 and BI-RADS 23; the transfer learning method using the ResNet 34 to fine-tune on DDSM dataset () is applied, and then the received model ResNet 34 is used to fine-tune on HMU dataset (). The system accuracy achieved a combined area under the curve (macAUC) of 0.76609, an average sensitivity of 0.5850 and an average specificity of 0.7942 when using DDSM and HMU databases (). These accuracies were higher than the accuracies of the model trained on only the HMU database, with average values of 0.03. In our study, the radiologists of the HMU are interested in the accuracy of the sensitivity metric because they are interested in a model’s ability to predict the true positives of each available BI-RADS. When the transfer learning technique is applied, the value of sensitivity increases by 0.04 (). The reason for choosing ResNet 34 is because ResNet 34 is an optimal best model among models such as ResNet 18, ResNet 34 and ResNet 50, which are used for training DDSM and HMU databases. The comparison of the results of ResNet models trained on DDSM and HMU databases is described in .
Table 6. Comparison of the results of different ResNet models trained on DDSM and HMU databases.
shows that the evaluation results of the ResNet 34 model (consisting of 34 layers) are the best in comparison with the evaluation results of the ResNet 18 (consisting of 18 layers) and ResNet 50 (consisting of 50 layers) trained on the same DDSM and HMU databases.
In , (Bui et al. Citation2022) use the ResNet 50 trained on a database of 7,912 breast cancer X-ray images for classifying BI-RADS 045, BI-RADS 1 and BI-RADS 23 categories. The ResNet 50 model achieves a macAUC of 0.754. In this study, the transfer learning technique was applied, and 10,418 breast cancer DDSM images were used for pre-training the ResNet 34 model; then, the training dataset with 6,248 HMU breast cancer images was applied for fine-tuning ResNet 34 for classifying the same BI-RADS 045, BI-RADS 1 and BI-RADS 23 categories. The ResNet 34 model achieves a macAUC of 0.76609. We can observe that by applying the transfer learning, the ResNet 34 model can get higher accuracy of macAUC, even when fewer data (only 6,248 images) of HMU database are used for training the model. If we use 7,912 breast cancer X-ray images of HMU database as in (Bui et al. Citation2022), the accuracy of macAUC should be increased.
Table 7. Some comparison of the results of the proposed method with other work.
The accuracy of our system using ResNet 34 is relatively higher than that of one random radiologist and is approximate as the committee of two radiologists of the Department of Radiology of the HMU Hospital (Bui et al. Citation2022). Therefore, this system can be considered a ‘second radiologist’ that can assist radiologists in Vietnam in reading breast cancer X-ray images for timely diagnosis and contribute to the advancement of decision-support system research in mammography.
Our method applies the CNN model as ResNet 34 trained on breast cancer X-ray images for classification of BI-RADS categories. There is another convolutional network (Ronneberger et al. Citation2015) called U-net, which is used for fast and precise segmentation of images. The input of U-Net is an image, and the output is a mask image where each pixel is labelled by a concrete class. Therefore, from our point of view, U-net is not suitable for the classification of images in our case study.
The main limitation of the proposed study is as follows:
According to (Goodfellow I. et al. Citation2016), ‘a supervised deep learning algorithm will generally achieve acceptable performance with around 5,000 labelled examples per category’. That means it needs at least 15,000 breast cancer X-ray images (including 5,000 images per category) for training ResNet 34 to classify three BI-RADS 045, BI-RADS 1 and BI-RADS 23 categories. However, in our study, the collected images are not enough for training the CNN model as it is suggested above. It is a reason why we applied transfer training to increase the performance of the system.
On the other side, the data for training CNN models are imbalanced. This means the number of images of BI-RADS 045, BI-RADS 1 and BI-RADS 23 categories is not the same. Usually, the abnormal X-ray images, including benign and malignant images, have lower categories than normal images used in the model training.
Conclusions
This paper presents an approach using a transfer learning technique to improve DNN-based mammogram classification systems in breast cancer screening. The ResNet 34 was pre-trained on the DDSM public database, and then this model was fine-tuned on the breast cancer X-ray HMU dataset of Vietnamese patients. The results reveal that the accuracy of the improved system is a macAUC of 0.766 (used only 6,248 HMU breast cancer images for training the ResNet 34 model), which is higher than a macAUC of 0.754 of the system (used 7,912 breast cancer X-ray images HMU dataset for training the ResNet 50 model). It demonstrates that transfer learning can improve the performance of CNN models with fewer images used for model training. At present, this system is the best system for the classification of mammograms in Vietnam; therefore, it can improve radiologists’ performance in breast cancer screening, and it helps to overcome a lack of experienced breast cancer radiologists. To visualise the benign and malignant areas in the breast cancer X-ray images, we will apply a heatmap method for the localisation of abnormal areas in X-ray images (Phuong et al. Citation2022) to the system.
Ethical approval
This research was accepted by the Ethical Review Board of Hanoi Medical University (Approval No. HMUIRB111). All patients agreed verbally and/or gave written consent to use their medical data and information for the hospital’s training and research. All details about the patients’ information are confidential, and the data were collected and analysed by many people.
Disclosure statement
No potential conflict of interest was reported by the authors
Additional information
Funding
Notes on contributors
Tuan Linh Le
Tuan Linh Le currently holds positions as a lecturer at Hanoi Medical University and as a radiologist at Hanoi Medical University Hospital, Vietnam. Specializing in diagnostic imaging with a focus on nephro-radiology, Dr. Linh has made significant contributions to the field. His research interests encompass image diagnosis and the application of artificial intelligence in this domain. Notable works include his doctoral thesis on Radiology, completed at Hanoi Medical University (HMU) in 2019, marking the culmination of his educational journey that includes the position of residency medical doctor in Radiology from HMU. Dr. Linh's substantial role as Vice-head of the Diagnostic Imaging Department at HMU and Director of the Diagnostic and Interventional Imaging Center at Hanoi Medical University Hospital (HMUH) since 2018 underscores his leadership in the field. His publications focus on diagnostic imaging and artificial intelligence in the context of diagnostic imaging.
My Hanh Bui
My Hanh Bui studied and graduated from the Hanoi Medical University, she completed her PhD thesis in 2004 and received the Title of Associate Professor in 2010. From 2011 up to present, she has been the Head of Department of Functional Exploration, Hanoi Medical University Hospital. Since 2013, she also has been appointed to the Director of the university’s Center for Development of Curriculum and Human Resources in Health and Head of Scientific Research & International Cooperation Department, Hanoi Medical University Hospital. She became Senior Lecturer, Department of Tuberculosis, Hanoi Medical University since 2016. Associate Professor My Hanh Bui holds various key positions in many Works, Projects and Scientific, technological tasks. From 2016 to 2019, she played a role as Principal Investigator of 01 state-level project ”Research on risk factors for complications, diagnosis, treatment and prevention of deep vein thrombosis in surgical patients”. She became Chair and had participated in 06 scientific research projects at ministerial level including: Principal Investigator of the research project named ”Building tools to support specialized medical training with multimedia” (2006-2009); Principal Investigator of the research project ”Developing output standards for general practitioner training” (2010-2014); Principal Investigator: “Develop a list of competencies for specialized doctors at level I of Surgery “(2014-2016); Develop a list of competencies for specialized doctors at level I in Obstetrics and Gynecology (2014-2016); Principal Investigator in Sub-topic” Study on building up the epidemiological prediction system of bipolar space in Vietnam (Sub-topic of research on “Building a support system for diagnosis and forecasting geo-spatial epidemiology of pulmonary tuberculosis by chest radiographs in Vietnam”) (2020-2023); Project “Building electronic Atlas software for surgical reports” (2021-2023). In 2019, Associate Professor Bui My Hanh was granted a utility solution patent by Intellectual Property Office of Vietnam through project ”Building a system to support automatic diagnosis, storage and sharing of functional exploration results and diagnostic imaging services for the health management system”. She also developed a standard dataset for developing deep vein thrombosis evaluation software for mobile phones. She is currently the corresponding author and has published many research papers. For example: “Movement restrictions, vaccine coverage, and reduction of the COVID-19 incidence rate in the fourth wave of the pandemic: analysis results from 63 provinces in Vietnam” on Frontier Public Health journal (2022); “Predicting the risk of osteoporosis in older Vietnamese women using machine learning approaches” on Scientific Reports journal (2022); “Evaluation of community-based screening tools for the early screening of osteoporosis in postmenopausal Vietnamese women” on PLoS One journal (2022), and “Convolutional Neural Networks Improve Radiologists’ Performance in Breast Cancer Screening for Vietnamese patients” on Applied Artificial Intelligence (2022).
Ngoc Cuong Nguyen
Ngoc Cuong Nguyen is a distinguished radiologist with a rich academic background and extensive international training. Graduating in General Medicine from Hanoi Medical University in 2007, he continued his specialization in Radiology at the same institution until 2011. Dr. Cuong further honed his skills through a fellowship at Kantonspital Winterthur hospital, Switzerland, and as a residency medical doctor at Hautepiere hospital, Strasbourg, France. Currently affiliated with the Radiology Center at Hanoi Medical University Hospital, he has actively participated in numerous international conferences and workshops, presenting on topics such as endovascular embolization, brain AVM treatment, and lymphatic intervention. Dr. Cuong has numerous publications related to the radiology sector, as well as artificial intelligence related to diagnostic imaging.
Manh Toan Ha
Manh Toan Ha is working as a researcher at Institute of Information Technology - Vietnam Academy of Science and Technology, Hanoi, Vietnam. He received B.S. degree in Applied Mathematics and Informatics from VNU Hanoi University of Sciences, Hanoi, Vietnam, in 2009 and M.S. degree in Information Technology from VNU University of Engineering and Technology, Hanoi, Vietnam, in 2015. His research area includes Virtual Reality, Computer Vision, Deep Learning.
Anh Nguyen
Anh Nguyen completed his Ph.D. working with Jeff Clune and Jason Yosinski in 2017 and since then has been an Assistant Professor at Auburn University. He also worked at Apple and Geometric Intelligence (acquired by Uber). In a previous life, he enjoyed building web interfaces at Bosch and invented a 3D input device for virtual reality (covered on MIT Tech Review). Anh is interested in making AIs more robust, explainable, and understanding their inner-workings. His research has won 3 Best Paper Awards (CVPR 2015, GECCO 2016, ICML 2016 Visualization workshop), a Best Application Paper Honorable Mention (ACCV 2020), and 2 Best Research Video Awards (IJCAI 2015 & AAAI 2016). His work has been covered by many media outlets e.g. MIT Technology Review, Nature, Scientific American, and lectures at various institutions. Anh was awarded an NSF CAREER award (2022).
Hoang Phuong Nguyen
Hoang Phuong Nguyen is an Associate Professor of the Artificial Intelligence Division of the Thang Long University, Hanoi, Vietnam. He received the B.S. degree (equivalent M.S) in Applied Mathematics from the Taskent University, Uzbeckistan in 1979 and the Ph.D. degree in Computer Science from the Technical University of Vienna, Austria in 1996 and received the Title of Associate Professor in 2002. His research interests are Artificial Intelligence, fuzzy expert systems and deep learning in Medicine. He organized and chaired Program Committee of the several international conferences in Vietnam on Artificial Intelligence, Fuzzy systems and Computational Intelligence as VJFUZZY’98, VJFUZZY’2001, Intech/VJFUZZY’2002, AFSS’2004, AICI’2020, AICI’2021, AICI’2022, AICI’2023. He edited four Springer books as V. Kreinovich, N.H. Phuong, (Eds.), Soft computing for biomedical applications and related topics (2020), N.H. Phuong, V. Kreinovich (Eds.), Soft Computing: Biomedical and Related Applications (2021), N.H. Phuong, V. Kreinovich (Eds.), Biomedical and Other Applications of Soft Computing (2022), N.H. Phuong, V. Kreinovich, Deep Learning and Other Soft Computing Techniques: Biomedical and Related Applications (2023). He is the president of Vietnam Fuzzy System Society (VFSS) which is an institutional member of the International Fuzzy Systems Association (IFSA).
References
- American Cancer Society (ACS). Breast density and mammogram reports. 2023. Accessed at https://www.cancer.org/cancer/types/breast-cancer/screening-tests-and-early-detection/mammograms/breast-density-and-your-mammogram-report.html on September 11, 2023.
- American College of Radiology (ACR). Breast Imaging Reporting & Data System. 2023. Accessed at https://www.acr.org/Clinical-Resources/Reporting-and-Data-Systems/Bi-Rads on September 11, 2023.
- Bui MH, Linh LT, Cuong NN, Binh NT, Doan LT, Chung LD, Vu GT, Ly NTL, Xuyen HTH, Thang ND, et al. 2022. Convolutional neural networks improve radiologists’ performance in breast cancer screening for Vietnamese patients. Appl Artif Intell. 36(1):3854–11. doi: 10.1080/08839514.2022.2151185.
- Contreras J, Ceberio M, Kosheleva O, Kreinovich V, Phuong NH. 2022. Why rectified linear neurons: two convexity-related explanations, in book: biomedical and other application of soft computing. In: Nguyen HP, Vladik K, editors, The series: studies in computational intelligence. Vol. 1045. Springer; p. 41–48.
- Duc N, Huy H, Thong P. 2019. Vietnamese Society of Radiology and Nuclear Medicine: Past, Current and Future. Acta Inform Med. 27(5):374. doi: 10.5455/aim.2019.27.374-379.
- Escorcia-Gutierrez J, Mansour RF, Beleño K, Jiménez-Cabas J, Pérez M, Madera N, Velasquez K. 2022. Automated deep learning empowered breast cancer diagnosis using biomedical mammogram images. Comput Mater Continua. 71(3):4221–4235.
- Geras KJ, Wolfson S, Shen Y, Wu N, Kim SG, Kim E, Heacock L, Parikh U, Moy L, Cho K. 2018. High-resolution breast cancer screening with multi-view deep convolutional neural networks. arXiv Preprint arXiv: 170307047v3[csCv]. 28 Jun 2018. doi: 10.48550/arXiv.1703.07047.
- Goodfellow I, Bengio Y, Courville A. 2016. Deep Learning. MIT Press. http://www.deeplearningbook.org
- Heath M, Bowyer K, Kopans D, Moore R, Kegelmeyer WP 2001. in Proceedings of the Fifth International Workshop on Digital mammography, Yaffe MJ, editor, 212–218, Medical Physics Publishing.
- Machida Y, Shimauchi TA, Yoshida T. 2015. Breast density: the trend in breast cancer screening. Breast Cancer-Tokyo. 22(3):253–261. doi: 10.1007/s12282-015-0602-2.
- Mansour RF. 2020. A robust deep neural network based breast cancer detection and classification. Int J Comp Intel Appl. 19(01):01. doi: 10.1142/S1469026820500078.
- Marmot MG, Altman DG, Cameron DA, Dewar JA, Thompson SG, Wilcox M. 2013. The benefits and harms of breast cancer screening: an independent review. Br J Cancer. 108(11):2205–2240. doi: 10.1038/bjc.2013.177.
- Phuong NH, Toan HM, Linh LT, Cuong NN, Hanh BM. 2022. Weakly supervised localization of the abnormal regions in breast cancer X-ray images using patches classification. In: Phuong NH, and Kreinovich V, editors. Biomedical and other applications of soft computing. Switzerland, AG: Springer; pp. 203–212.
- Ranjbarzadeh R, Bagherian Kasgari A, Jafarzadeh Ghoushchi S, Anari S, Naseri M, Bendechache M. 2021. Brain tumor segmentation based on deep learning and an attention mechanism using MRI multi-modalities brain images. Sci Rep. 11(1):1–17. doi: 10.1038/s41598-021-90428-8.
- Ranjbarzadeh R, Jafarzadeh Ghoushchi S, Tataei Sarshar N, Tirkolaee EB, Ali SS, Kumar T, Bendechache M. 2023. ME-CCNN: Multi-encoded images and a cascade convolutional neural network for breast tumor segmentation and recognition. Artif Intell Rev. 56(9):1–38. doi: 10.1007/s10462-023-10426-2.
- Ronneberger O, Fischer P, Brox T. 2015. U-net: convolutional networks for biomedical image segmentation. International Conference on Medical Image Computing and Computer-assisted Intervention, Springer, Cham, pp. 234–241
- Sickles EA, D’Orsi CJ, Bassett LW, Appleton CM, Berg WA, Burnside ES. (2013). ACR BI-RADS Mammography. In: ACR BI-RADS Atlas, Breast Imaging Reporting and Data System, 5th Edition, American College of Radiology, Reston, VA, pp. 134–136.
- Suckling J. 1994. The Mammographic Image Analysis Society Digital Mammogram database. Excerpt Medica Int Congr Ser. 1069:375–378.
- Sung H, Ferlay J, Rebecca L, Siegel M, Laversanne I, Soerjomataram AJ, Bray F. 2021. Global cancer statistics 2020: GLOBOCAN estimates of incidence and mortality worldwide for 36 cancers in 185 countries. CA A Cancer J Clin. 71(3):209–249. doi: 10.3322/caac.21660.
- Tab Ár L A, Yen M-F, Yi-Ying W, Wu S, Chen L-S, Yueh-Hsia S, Chiu J, Ching-Yuan Fann M, Ku M-S, Smith RA, et al. 2015. Insights from the breast cancer screening trials: how screening affects the natural history of breast cancer and implications for evaluating service screening programs. Breast J. 21(1):13–20. doi: 10.1111/tbj.12354.
- Trieu PDY, Mello-Thoms C, Brennan PC. 2015. Female breast cancer in Vietnam: a comparison across Asian specific regions. Cancer Biol Med. 12(3):238.
- Yang Q, Zhang Y, Dai W, Pan SJ. 2020. Transfer learning. United Kingdom: Cambridge University Press.