
ABSTRACT
Early illness diagnosis and prediction are important goals in healthcare in order to offer timely preventive measures. The best, least invasive, and most reliable way for identifying any neurological disorder is EEG analysis. If neurological disorders could somehow be predicted in advance, patients could be saved from their detrimental consequences. With promising new advancements in machine learning-based algorithms, Early and precise prediction might induce a radical shift. Here, we present a thorough analysis of cutting-edge AI methods for exploiting EEG data for Parkinson’s disease early warning symptoms detection, sleep apnoea, drowsiness, schizophrenia, motor imagery classification, and emotion recognition, among other conditions. All of the EEG signal analysis procedures used by different authors, such as hardware software data sets, channel, frequency, epoch, preprocessing, decomposition method, features, and classification, have been compared and analysed in detail. We will point out the difficulties, gaps and limitations in the current research and suggest future avenues of research.
Introduction
Studies of biological processes in an organism, for example combinations of genes and proteins, heart and brain rhythmic patterns, and imaging of tissue and organs, are known to as bio signals. Biomedical signal processing aims to extract useful information from biological signals (Chang and Moura Citation2018). While electroencephalograms (EEG) are typically used to diagnose neurological diseases, electrocardiograms (ECG) are frequently utilised to diagnose cardiovascular disease. Biomedical images are used to investigate illnesses and are suggestive of anatomical information. There are a variety of commonly utilised modalities, ranging from ultrasound to radiology-based short-wavelength x-rays. For inexpensive and precise diagnostics, machine-based biomedical signal and image analysis and labelling are crucial. Biologists may learn new biological ideas through the application of biomedical signal processing, and doctors can keep track of specific disorders (Rajput et al. Citation2017). Numerous diagnostic and control applications based on the examination of bio signals. Biomedical signal processing’s primary objective in the past was to filter data to reduce noise (Majdalawieh et al. Citation2003). Classification is another new and crucial element in several biomedical research (Chang and Moura, Citation2018). Clinic classification is used to distinguish between pathology and normal. In clinics, classification is challenging for various reasons: It requires much time for experts to collect the necessary knowledge to accurately differentiate between comparable conditions, such normal and abnormal. Manually classifying each of these cases takes a lot of time and effort. The greatest difficulty arises when the signal characteristics are weak and thus difficult for professionals to distinguish[4]. Signal processing automatic categorisation algorithms have the potential to help overcome some of these challenges and support biological decision-making. An automatic classifier can identify features that are difficult to distinguish without bias, help human operators, and learn the categorical data from a database[4].
(Rasheed et al. Citation2021) An especially useful diagnostic technique for examining the brain’s signalling system throughout various psychological and physical processes is electroencephalography (EEG). Through EEG, a wide range of disorders’ prognosis and treatment have been extensively researched. The EEG signals evaluate the brain’s brainwave activity in a non-Gaussian and non-stationary manner, which is then utilised to diagnose the different types of brain illnesses. Brain function can be divided into normal and pathological with the aid of EEG analysis. Examining longer-duration EEG records is important for a precise diagnosis of epilepsy. It takes a lot of time and effort for experienced neurologists to analyse continuous EEG data that were recorded over a period of days, weeks, or perhaps even months. Machine learning (ML)-based prediction approaches have been employed in numerous studies to solve various problems over the years. A advanced machine learning (ML) technique is deep learning (DL), that can analyse enormous sets of data through a multilayer hierarchical design to learn patterns more precisely (Rasheed et al. Citation2021). Researchers have used Deep Learning techniques to address many real-world applications because of its capacity to deliver extremely accurate findings. A variety of researchers have proposed DL-based methodologies. In order to forecast various neurological conditions and anomalies, this study will discuss and expand on the key developments in EEG signal processing that have been made with the use of ML techniques. We will give a quick overview of neuroscience, the many technologies used to research the brain signal, and how they have been applied to EEG signal analysis.
The remainder of the article is organised as follows: Section II presents primary contribution, section III Background on EEG then presents review, analysis, comparison and key findings, the conclusion is presented in Section IV.
Primary contribution
Although there are various reviews, they all address only one neurological issue using EEG signals. There is no study that covers the application of EEG analysis for multiple disorders/conditions in depth. Rasheed et al., for instance, have published a detailed overview of models for epileptic seizures (Rasheed et al. Citation2021), Epileptic Spike Detection Algorithms for EEG and MEG were also examined by FATHI et al (Abd El-Samie et al. Citation2018), Seif Soliman et al. reviewed only for Deep Learning Approaches for Epileptic Seizure (Soliman et al. Citation2022), Mohammad-Parsa Hosseini et al reviewed Machine Learning for EEG Signal Processing for detection various neurological condition (Hosseini et al. Citation2021), An review of the development of seizure forecasting techniques from the 1970s to 2006 was presented by Mormann et al. (Mormann et al. Citation2007) and have addressed the key concerns with ES prediction approach. The outcomes of the prediction’s statistical significance have been thoroughly detailed by Gadhoumi et al. and gave a quick summary of the valid techniques employed for ES prediction (Gadhoumi et al. Citation2016). In the recently released review, Kuhlmann et al. noted briefly the improvements in ES prediction. They came to the conclusion that these improvements in regular statistical analyses are paving the way for the creation of ES prediction procedures, and they improved the current standards to bring about this development (Kuhlmann et al. Citation2018).
Apart from all the review that various author done till date, this survey document is remarkable since it offers detailed explanations. not only like classification but other preprocessing steps like resampling, noise removal, decomposition, feature selection etc. techniques for Parkinson, Sleep Apnoea, Drowsiness, Schizophrenia, Motor Imagery Classification and Emotion Recognition and explores prospective research directions along with research gap and challenges in this area.
Motivation
This article addresses a critical gap in current research by offering a comprehensive exploration of EEG signal analysis for multiple neurological conditions. While existing studies focus on singular issues, our article stands out by providing detailed insights into preprocessing techniques and classifications for Parkinson, Sleep Apnoea, Drowsiness, Schizophrenia, Motor Imagery Classification, and Emotion Recognition. Through this work, we aim to contribute valuable knowledge to the biomedical signal processing field, facilitating more accurate diagnostics and paving the way for future advancements in EEG-based machine learning applications.
Background on EEG for neuroscience and neuroimaging
EEG significance and diagnosed conditions
An EEG examination looks for irregularities in the brain’s electrical phenomenon. Electrodes will be positioned all over your head throughout the operation. Your brain activity generates very little electrical charges, which the electrodes detect. The electrical charges developed are shown as either a graph on a digital screen or a transcript drawn out on paper HealthHealth Home (Health home | Johns Hopkins Medicine) Citation2023. The EEG is used to detect multiple neurological disorders. When epilepsy is present, seizure activity will appear as acute waveforms on the EEG. Patients with brain lesions, which may be brought on by tumour tissues or clots, may have very slow EEG pulses depending on the size and place of the damage. This assessment might possibly be utilised to determine what makes the brain less active such as narcolepsy, various psychoses, Alzheimer’s disease, and others. The general electrical action of the brain may also be monitored utilising EEG (for instance, drug intoxication, assessing trauma, or determining the amount of brain damage in individuals who are unconscious.).The EEG is useful to monitor flow of blood inside brain during surgery. The characteristic of the raw EEG is Gamma(γ)higher than 30 Hz, Beta(β) (13 to 30 Hz), Alpha(α) (8 to 12 Hz), Theta(θ) (4 to 8 Hz), and Delta(δ) (less than 4 Hz) are the five frequency ranges. The following conditions are those that an EEG signal analysis may be used to identify ConditionsConditions an EEG ()2023
Seizure disorders
Epilepsy and other seizure disorders (Shoeibi et al. Citation2022) are the main conditions that EEG is utilised in assessment. A brain condition known as epilepsy is characterised by seizures, muscle spasms, and unusual behaviour or feelings. The exact cause of epilepsy is not fully understood by experts. It could entail atypical connections between nerve cells and chemical abnormalities in the brain. Medication to prevent seizures is the major treatment for epilepsy. Some seizure disorders are treated through brain surgery ConditionsConditions an EEG ()2023.
Sleep disorders
Narcolepsy to insomnia are examples of different sleep disorders (Sharma et al. Citation2022). Insomniacs have problems staying asleep. Anxiety, trauma, and particular illnesses or medications are the causes. Improved sleep hygiene and a change in lifestyle can assist. Excessive daytime fatigue and sleep episodes are symptoms of narcolepsy. Low amounts of the neurological component hypocretin may cause narcolepsy, according to experts. For the treatment of chronic insomnia and narcolepsy, doctors may prescribe medications Conditions an EEG ()2023.
Brain tumors
Brain tumours can take many different forms. They may be benign (not cancerous) or malignant (cancerous) (benign) (Raghavendra et al. Citation2023). Headaches, seizures, sensory changes, mobility issues, exhaustion, and altered behaviour are some of the signs of a brain tumour (Galgano et al. Citation2017). The majority of brain tumours have unknown causes, according to experts. Doctors use surgery, radiation, and chemotherapy to treat brain tumours. For most people, rehabilitation is essential to their recovery(Conditions an EEG 2023).
Brain injury
Severe neurological injuries can occur, which is caused by an outside force, or acquired, which is frequently caused by a stroke or a brain oxygen deficit. The seriousness of the injury will determine the symptoms, which may include everything from headaches and balance problems to comas and unconsciousness. Sleep, avoiding stress and physical activities like reading are part of the most basic treatments. Losing mental ability necessitates longer term therapy. In the case of moderate and severe brain injuries, lifelong therapy may be required Conditions an EEG ()2023.
Dementia
Memory loss and altered mental abilities, such as speaking and understanding, are symptoms of dementia. Behavioural issues can also happen. Vascular dementia, Alzheimer’s condition (Khare and Acharya Citation2023a), are just a few of the illnesses that can cause dementia. Medication is used by doctors to treat dementia in order to improve cognitive function and memory. They also employ methods for dealing with behavioural issues. But medication cannot undo the alterations in the brain that are developing dementia Conditions an EEG ()2023.
Brain infections
Brain abscesses and encephalitis, an infection-related brain inflammation, are examples of disorders that can result from brain infections. Headaches, seizures, mental state changes, and behavioural or personality abnormalities can all be brought on by brain infections. Typically, an infection travels from another region of the body to the brain. Surgical procedure and medication if required are used by doctors to treat brain infections Conditions an EEG ()2023.
Stroke
Once the mind’s blood circulation is interrupted, a stroke happens and destroy brain cells. Sudden weakness or paralysis, numbness, a sagging face, alterations in speech, or difficulty interpreting words are all indications of a stroke. A blood artery begins to bleed blood and enters the brain, or a Blockage of a blood vessel, causing an ischaemic stroke (haemorrhagic stroke). Emergency care is necessary for stroke Conditions an EEG ()2023.
Attention disorders
Problems involving lack of attention are attention deficit disorder (ADHD) and attention deficit hyperactivity disorder (ADHD) (Khare et al. Citation2022; Khare and Acharya Citation2023b). They are characterised by difficulties maintaining focus, giving proper attention, and managing activity. Attention difficulties are caused by unknown factors, according to experts. Genes might be involved. Doctors use medication, behavioural therapy, and social skills instruction to address attention issues Conditions an EEG ()2023.
Behavior disorders
Conduct disorder (CD) and Oppositional defiant disorder (ODD) are examples of abnormalities of behaviour (Khare et al. Citation2023, Citation2023). If these illnesses have a physical origin, an EEG can assist in identifying it. Behaviour disorders impair connections in the workplace, at home, in the family, and in the community. Behaviour modification therapy is beneficial for those who have these problems. In some circumstances, physicians also prescribe drugs Conditions an EEG ()2023.
Developmental delays
Communication, reasoning, and motor skills are all impacted by developmental delays (Khare et al. Citation2023). Children with developmental delays lose or miss out on typical developmental milestones like walking and talking. These kids’ delays may have a physical cause, which an EEG may help find. The focus of treatment is on a child’s particular requirements. This may involve social skills instruction, behavioural/physical/occupational/speech therapy Conditions an EEG ()2023.
Parkinson’s disease
Parkinson’s disease (Parkinson’s disease - symptoms and causes - mayo clinic (Citation2023) Movement is impacted by Parkinson’s disease (Khare et al. Citation2021b), a debilitating condition of the neurological system. Early signs might include a little shaking in just one hand. Although the illness usually causes tremors, it also frequently causes movement to slow down or stiffen. Parkinson’s symptoms and indicators include Parkinson’s disease (Parkinson’s disease - symptoms and causes - mayo clinic (Citation2023): Numbness, sluggish motion (bradykinesia), stiff muscles, poor balance and posture, a reduction in automatic motions, Speech abnormalities, Writing variations.
Phases of EEG analysis
Broadly Phase of Biomedical signal processing can be divided into following phases and details of these steps are given below
Signal recording
(Penzel et al. Citation2006)In several areas of contemporary medical services recently, over a few decades, tracking and recording bio-signals have become crucial. This shows that the significance of physiological control systems is acknowledged. ECG is the most well-known use of bio signal monitoring (ECG). The ECG has undoubtedly had the longest history in bio signal monitoring and recording due to its robustness and strength (amplitude approximately 1 mV). For a thorough diagnosis of particular heart issues, a cardiologist may record it with 6 or 12 leads. Bio signals are now routinely recorded during diagnostic procedures in neurology/neurophysiology (EEG, EMG) and cardiology (ECG, blood pressure). Several signals have an electric component and are electrophysiological in origin (e.g. ECG, EEG). To extract these signals with the fewest artefacts possible, careful amplification and filtering are required.
Radio signals and powerful magnetic forces are used in magnetic resonance imaging (MRI) to provide detailed images of the interior of the body.
The technique of magnetoencephalography (MEG) records the beams of magnetism created by the electrical ions that typically flow in the brain in order to map brain function.
An electroencephalogram (EEG) is a scan that uses fine wire chips (electrodes) connected to head to find electrical movement in mind.
At specialist medical facilities, data from human intracranial electroencephalography (iEEG) is captured using electrodes positioned on or implanted in the brain.
ECoG can be carried out intraoperatively (during surgery) or extra operatively (during non-surgery) (extra operative ECoG).
During an MRI imaging process, blood that is entering the body is magnetically labelled called as arterial spin labelling (ASL) allows for an evaluation of blood flow to the brain without surgery.
Among the nuclear medicine techniques is positron emission tomography (PET), keeps track of the physiological function of the cells in diverse bodily tissues. In actuality, PET merges biochemical analysis with nuclear medicine [].
Figure 1. Wide range of physiological characteristics in various medical contexts.
EEG signal recording
(Rasheed et al. Citation2021)Based on where the reference electrode is placed, there are two different ways to capture the EEG:
Bipolar Montage: The voltage differential between the electrodes in a bipolar montage is observed while both electrodes are applied to a scalp area that is electrically active.
Monopolar Montage/Unipolar Montage: One active electrode and one or more coupled reference electrodes make up a monopolar montage. Electrical neutrality should be maintained for the reference electrode and so is feasible when compared to brain activity. The recorded signals serve as a representation of the differential between the reference electrodes and the active brain regions. The top of the nose, the left or right mastoid, the chest, and the non-cephalic, balanced stern vertebral lead are common reference points.
Following are the various commercial hardware available for EEG recording:
OpenBCI
g.USBamp amplifiers
EMOTIV
QUASAR
BioSemi
Axxonet
Software used in EEG processing
(Holdgraf et al. Citation2019) A guideline for representing the data in neuroscience and a set of programs and tools that make it easier to use BIDS data structures are the two main outputs of the community project BIDS. In order to create the iEEG-BIDS specification, various new community tools had to be developed. We have listed those who needed the most recent iEEG-BIDS development below.
The BIDS validator: - The BIDS specification is tested using a validator (written in JavaScript). It checks text files for the necessary file types and information required by the BIDS standard and parses a folder to see if its naming conventions and hierarchy are compliant with BIDS. An extra set of data fields and directory structures were added by the iEEG-BIDS addition so the BIDS validator had to be changed to support these.
The BIDS starter kit: -is a set of wiki resources, tutorials with stakeholder input, utility programs, and instructions aimed at introducing researchers to the BIDS data format. These materials include the two main programming languages that iEEG-BIDS supports (Matlab and Python).
MNE-BIDS and MNE-Python. A Python open-source application for data visualisation, analysis, and electrophysiological. The MNE-Python package just received an update to add support for iEEG. The group collaborated with the MEG and EEG teams to create MNE-BIDS, a updated package for data transmission among MNE-Python and the BIDS requirements in electrophysiology, additionally to the development of the iEEG-BIDS standard. Electrophysiology procedures in MNE-Python can be easily converted to the BIDS dataset framework with the help of MNE-BIDS.
FieldTrip. In the Matlab programming language, FieldTrip is a free toolkit for studying electrophysiology. It can export data to BIDS specified forms and enables importing data from a wide range of iEEG formats. Additionally, FieldTrip has a method called data2bids.m that enables users to properly annotate their iEEG and MRI data and arrange it.
EEGLAB is a GUI-based toolkit for handling MEG, EEG, and other electrophysiological data that also contains independent component analysis (ICA), Fourier/wavelet assessment, component removal, statistical data relating to events, and a range of practical methods to analyse separate and averaged data.
iElvis:-An open-source Matlab application called iELVis is used to locate iEEG electrodes and display their data layer on neuroimaging. Using BIDS-iEEG protocols, it would acquire and output iEEG electrode locations and related neuroimaging data.
Brainstorm. An open-source Matlab program called Brainstorm is used to analyse multimodal neurophysiology data.It offers interfaces for users for setting up electrode connections in clinical iEEG signals, post-implant CT or T1 scans, as well as analysing and editing huge information. Most iEEG file types are supported, and they may be converted into BrainVision/EDF files. From the Brainstorm database, studies may be automatically loaded and generated as data structured for BIDS.
OpenNeuro. A database for freely accessible neuroimaging records is Open Neuro (OpenNeuro.org). The bids-validator, which heavily relies on the BIDS standard, is used to validate each dataset before to submission. This facilitates the online sharing and storage of EEG datasets for researchers who employed BIDS in their labs.
Dataset and brain imaging data structure (bids) format
ECoG, ASL, PET, MRI, MEG, EEG, and iEEG data can be shared on the free and open platform known as OpenNeuro. Complex data from neuroimaging research can be structured in a variety of ways. There is currently no agreement on how to distribute and organise the data gathered from neuroimaging studies. It is possible for two researchers working in the same lab to choose to organise their data differently. Lack of agreement (or a standard) causes misunderstandings, which wastes time rearranging data or rewriting scripts that were written with a specific structure in mind. Here, we outline an easy-to-use system for organising behavioural and neuroimaging data. You will gain by applying this standard in the following ways:
Your data will be simple for another researcher to work with. You simply need to refer to this document to understand how the files are organised and formatted. This is crucial if you run your own lab and expect to have multiple people working on the same data at once. By utilising BIDS, you can avoid wasting time attempting to decipher and reuse data that has already been collected by a graduate student or postdoc who has left the lab.
Software tools for data analysis are becoming more and more prevalent, and many of them can comprehend BIDS-organised data.
Datasets organised using BIDS are accepted by databases like OpenNeuro.org. By utilising BIDS to structure and characterise your data as soon as it is acquired, you can reduce the extra time and effort required for publishing and simplify the curation process if you ever intend to distribute your data publicly (these days, several journals mandate this).
You may quickly identify missing values by using validation tools like the BIDS Validator to evaluate the consistency of your dataset [].
Figure 2. BIDS format structure with detail info inside (Pernet et al. Citation2019).
Signal preprocessing for noise/artifact removal
(Repovš Citation2010)– (Sharma et al. Citation2022) Many methods are available for removing the artefact/noise from EEG signal like Common Spatial Patterns (CSP), Single Value Decomposition (SVD), Normalised Least Mean Square with adaptive filter, Independent Component Analysis (ICA), Common Average Referencing (CAR), Filtering, Surface Laplacian (SL), Principal Component Analysis (PCA) etc. After removing noise/artefact, signal analysis results more accurate report
Signal decomposition
Retrieval and isolation of signal components from complex signals are the objectives of signal decomposition. Following are the various recently updated method for signal decomposition:
EEG signals are used in empirical mode decomposition (EMD), which allows for meaningful time-frequency-amplitude analysis of the signals. The suggested method applies the EMD algorithm to decompose EEG signals into AM-FM components (referred to as IMFs).
Flexible variational mode decomposition (F-VMD) can be used for the adaptive breakdown of signals.
Short-time Fourier transform (STFT) and Fast Fourier transforms (FFT) for the breakdown of signals.
Higuchi algorithm
The non-stationary EEG signals are decomposed using optimal variational mode decomposition (O-VMD) and the eigenvector centrality method (EVCM), which chooses a prominent channel.
Minimum average maximum tree (MAMT)
adaptive variational mode decomposition (AVMD),
Tunable Q wavelet transforms (TQWT)
Flexible analytic wavelet transforms (FAWT)
Singular value decomposition (SVD),
Empirical wavelet transforms (EWT) and empirical wavelet packet transform (EWPT),
Automated tunable Q wavelet transform.
Principle component analysis (PCA) and independent component analysis (ICA) for decomposing signal into another dimension.
Optimised TQWT (O-TQWT),
Teager energy operator and empirical mode decomposition (EMD),
Non-chirp variational mode decomposition (NCVMD),
Smoothed Pseudo Wigner Ville Distribution
Signal feature extraction
(Subasi Citation2019; Siuly et al. Citation2020; Rasheed et al. Citation2021) To optimise effectiveness for the categorisation of biological data, feature identification is necessary. The various features are
Activity natural,
Adaptive hermite decomposition (AHD),
Complexity,
Crest factor (CF)
Difference absolute standard deviation value (DASDV):
Entropy of approximation (APPEN),
Entropy.
Fano factor,
1st quartile (q1), 2nd quartile (q2), 3rd quartile (q3), interquartile range (iqr)
Higuchi fractal dimension (HFD),
Sure entropy,
Hurst exponent (HE),
Interquartile range
Kurtosis,
Lampel-ziv complexity (LZC) feature,
Hjorth complexity (HJC) and mobility (HM)
Log energy (LEEN) entropy,
Mean,
Median,
Min, max, sum, first, last
Mobility,
Mode,
P10, p25, p50, p75, p90,
Permutation (PREN) entropy,
Renyi(REEN) entropy
Root mean square,
Sample entropy and conditional entropy.
Second moment,
Shannon entropy, permutation entropy,
Simple square integral (SSI),
Skewness,
Spectral flatness (SF),
Standard deviation,
Trimean,
Tsallis (TSEN) entropy
Variance,
Feature ranking
Selecting the top significant attributes of a particular feature set is the process of feature selection. Both classification and feature selection can improve a model’s performance (Siuly et al. Citation2020; Khare and Bajaj Citation2020; Murugappan et al. Citation2020) Discrimination ability of the considered features calculated by following methods
Chi Squared: By determining the chi-squared value with respect to the class attribute for each attribute, one can determine the importance of a feature.
Correlation: returns the value’s normalised or absolute form as the weight after calculating the correlation between each attribute and the label attribute.
Gini Index: to determine the significance of the attributes.
Information Gain: Considering the information gained, calculates the importance of the attributes.
Kruskal Wallis test: to pick the most discriminating features while reducing the dimensionality.
Maximum Relevance: Depending on the feature and label type (numerical/nominal), picks mutual information, Pearson correlation or F- test.
PCA: uses one of the primary components’ elements as the basis for the feature weights.
Relief Measures
SAM (Significance Analysis for Microarrays)
SVM: uses the coefficients of a linear support vector machine’s normal vector as the attribute strengths.
Uncertainty: measures the symmetrical uncertainty with regard to the class to determine the significance of a characteristic.
Univariate post-hoc analysis: The post-hoc analysis approach is a non-parameterised way to determine a feature’s capacity for discrimination.
Classification
Classification involves identifying, comprehending, and organising signals and feature sets into predetermined categories or subpopulations (Subasi Citation2019; Rasheed et al. Citation2021; Yaacob et al. Citation2023; Khare et al. Citation2024) Followings are the various recently used classification methods ():
ANN
Bagged tree (BaT) classifier
CNN architectures AlexNet, VGG16, ResNet50, Inception
Decision tree (DT), basic tree, medium tree and complex tree are the three kernels (El-Dahshan et al. Citation2024).
Discrete wavelet transforms (DWT)
The two types of discriminant analysis are linear discriminant analysis (LDA) and quadratic discriminant analysis (QDA)
Dynamic graph CNN
Ensemble learning: By integrating many classification models, it is utilised to increase the prediction performance of the constituent model. Subspace discriminant, bagged trees, RUS Boosted trees, and subspace KNN are among the ensemble learning approaches.
Extreme learning machine (ELM) kernels are sinusoidal (Sin), radial basis function (RBF), triangular (TB) and sigmoid (Sig).
Flexible extreme learning machine (F-ELM)
Six kernels: fine, medium, coarse, cosine, cubic, and weighted in K-nearest neighbours (k-NN)
Support vector machine (SVM)
Least square SVM (LSSVM)
Linear discriminant analysis (LDA).
Linear regression (LR)
Using the fuzzy neural network and the moving average power spectrum
Multi-layer perceptron (MLP) classifiers
Naïve Bayes (NB)
Optimal centre constructive covering algorithm (OCCA)
Pooling-based deep recurrent neural network(PDRNN)
Probabilistic neural network (PNN)
Random forest classifiers
Recurrent neural networks (RNN).
Performance measuring parameter calculation
The most important task in building any classification model is to evaluate its performance (Taran and Bajaj Citation2019a; Murugappan et al. Citation2020; Taran et al. Citation2021)Following metrics evaluates the performance of the proposed models on .
Accuracy
Cohen’s kappa
F1-score
False alarm rate
Fowlkes-mallows index (FM)
Mathew’s correlation coefficient (MCC)
Precision
Receiver operating characteristic (ROC) curve.
Sensitivity
Specificity.
Current state of art
Analysis and comparison: detection of Parkinson’s disease
Table 1. comparison of parkinson’s disease detection methods
Figure 3. Chart describing Parkinson’s disease detection methods.
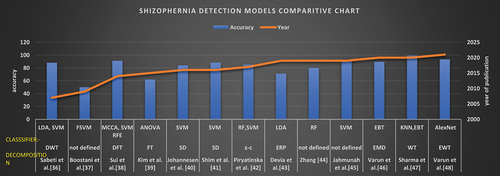
Detecting schizophrenia is a complex process that often involves a combination of clinical evaluation, behavioral observations, and various assessment tools. It’s important to note that only qualified healthcare professionals, such as psychiatrists, psychologists, and other mental health specialists, should diagnose schizophrenia []. However, researchers and clinicians use different methods for early detection and assessment [].
![Figure 3. Chart describing Parkinson’s disease detection methods.Detecting schizophrenia is a complex process that often involves a combination of clinical evaluation, behavioral observations, and various assessment tools. It’s important to note that only qualified healthcare professionals, such as psychiatrists, psychologists, and other mental health specialists, should diagnose schizophrenia [Figure 3]. However, researchers and clinicians use different methods for early detection and assessment [Table 2].](/cms/asset/78a206cb-83d1-46fc-a7a5-41654038fbb1/tciv_a_2304574_f0003_oc.jpg)
Analysis and comparison: detection of schizophrenia
Table 2. Comparison of schizophrenia detection methods.
Figure 4. Chart describing schizophrenia detection methods.Chart describing motor imagery classification technique is discribe in .
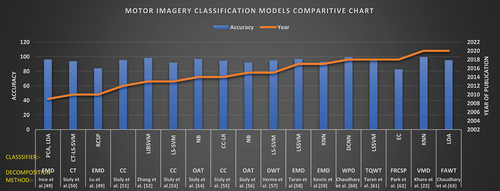
Analysis and comparison: motor imagery classification
Table 3. Comparison of motor imagery classification technique.
Figure 5. Chart describing motor imagery classification technique.
Chart describing motor imagery classification technique is discribed in .
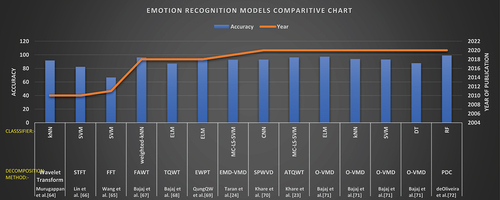
Analysis and comparison: emotion recognition
Table 4. Comparison of emotion recognition models.
Figure 6. Chart describing emotion recognition models.Chart describing emotion recognition models was discribe in and .
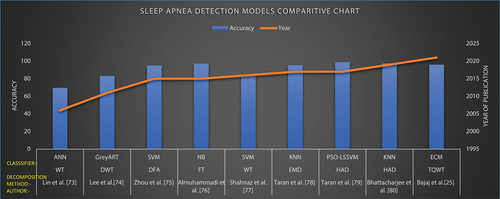
Analysis and comparison: the sleep apnoea detection
Table 5. Comparison of sleep apnoea detection models.
Figure 7. Chart describing sleep apnoea detection models.Chart describing sleep apnoea detection models was discribe in .
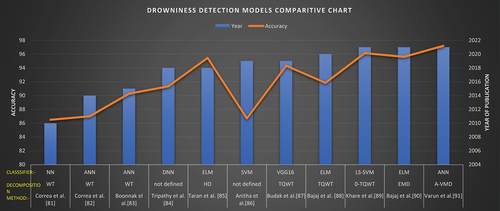
Analysis and comparison: drowsiness detection
Table 6. Comparison of drowsiness detection models
Figure 8. Chart describing drowsiness detection models.
Key Findings
EEG Signal Recording Hardware Type
By detail analysis of papers reviewed in this study it has been found the BioSemi active two system (Abd El-Samie et al. Citation2018; Khare et al. Citation2021b; Khare and Acharya Citation2023a, Citation2023b) were used in most of the study [ and ] .
Software Type
Most of the work used MATLAB to implement their methodology of the research work.
Dataset Type
Following are the dataset used in various study:
MIT/BIH polysomnographic database
Self-recorded
III BCI Competition IVa and IVb
Collected from Neurology Department of the Penang General Hospital’s []
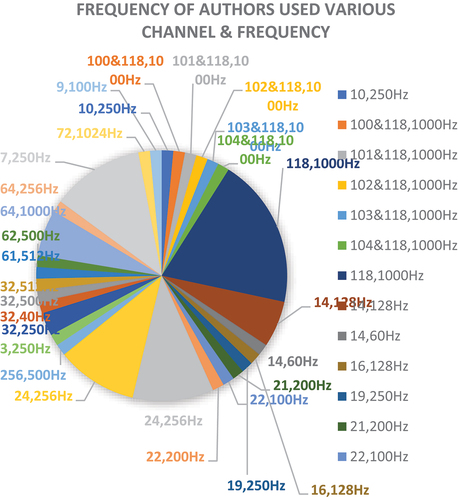
Channel And Frequency Of The Dataset.
following table represent the list of various channel & frequency used by no of authors
Table 7. Number of channel & frequency count
Figure 9. Chart representing count of channel & frequency used.
Signal Preprocessing
Following are various methods used by different author for pre-processing []
threshold technique Then, a 6th-order bandpass Butterworth filter
2nd order, bidirectional, Butterworth, band – pass filter”
iterative filtering (IF) and Band pass filtering
Butterworth band pass filters (order five) and average filter “Butterworth filter, order five
band pass filtered (0.01- 0.5 Hz) ”1-Hz high-pass filter and a 60-Hz notch filter
low pass filtered and down sampled to 125 Hz”
Band-pass filter 0.53–40 Hz
between 0.05 and 200 Hz band-pass filter
Surface Laplacian (SL) filter
Butterworth filter and IIR notch filter ”0.5 to 50 Hz
bandpass filter,60 Hz notch FIR filter
Signal Decomposition
For decomposition of signal, various types of decomposition method has been used for different author as follows:
Wavelet Transformation
DWT (Discrete Wavelet Transformation)
frequency decomposition
Fourier analysis (FFT)
singular value decomposition (SVD)
linear predictive coding
TQWT
Hermite decomposition algorithm
EMD (Empirical Mode Decomposition
Adaptive Variational Mode Decomposition
Clustering technique (CT)
Empirical mode decomposition (EMD)
cross-correlation (CC)
optimal allocated technique
FAWT
TQWT
SPWVD
ATQWT
O-VMD
Classification
Key techniques that were used by various author recently are [Vishwakarma et al. Citation2020]
AlexNetVGG16 and ResNet50 networks
ANOVA
clustering technique-based least square support
CNN
cross-correlation based logistic regression algorithm
DCNN
Decision-Tree (DT)
DT
ELM
Ensemble Bagged tree
fuzzy SVM
HLDA
kernelized logistic regression (KLR)
k-Nearest-Neighbour (KNN)
Least-square support vector machine (LS-SVM)
leave-one-out cross-validation (LOOCV) with support vector machine (SVM) classifier
LIBSVM
Linear-Discriminant analysis (LD)
logistic regression (LR)
long-short term memory (LSTM) classifiers
MCCA
MC-LS-SVM
multilayer perceptron neural network (MLP)
Naïve Bayes
NDA
Probabilistic-Neural Network (PNN)
Random forest
RCSP for signal decomposition
RFSVM
SVM
SVM RFE
vector machine
weighted-kNN
Z-LDA to LDA
Performance measuring parameter calculation
The performance of the various methods described in this paper, has been assessed using the following factors:
accuracy,
Fowlkes-Mallow’s index (FM)
specificity,
false alarm rate,
F1-score,
Cohen’s Kappa,
receiver operating characteristic (ROC) curve.
precision,
Mathew’s correlation coefficient (MCC),
sensitivity,
Research gap
Following are the limitation of above methods given by difference authors
There will be no real time detection.
No one author work for methodology for low end computing mobile devices.
No one author work for methodology for low end memory mobile devices.
Till date no author has automate whole process of detection.
Till date no author had developed for early prediction of disease/disorders.
Developed the method using a small number of subjects.
Techniques utilising empirical hyperparameters for classification
Parameters for classification and optimisation are chosen at random.
Research challenges
Following are the various challenges now in EEG signal analysis for neurological condition detection:
About 90% accuracy is achieved.
In wavelet-based approaches, choosing the appropriate degrees of decomposition and wavelet still leads to hard-band restrictions in filter banks.
Due to the noise in EEG readings, Higuchi-based algorithms perform poorly.
The performance of the system must be constrained by a sizeable number of hyperparameters, which must be adjusted according to the CNN techniques. The effectiveness of the approaches described in the literature depends on the parameter. Information is lost and misclassification increases when decomposition parameters are chosen based only on empirical data. To solve these issues, an automated selection of decomposition parameters is needed.
A fixed width and window function are necessary for the STFT, which also assumes that the signal is steady.
Wavelet selection is necessary for CWT and DWT, but WVD suffers from cross-terminal frequency and low precision.Solutions from STFT,DWT, CWT and WVD are likewise weakened and noisy as a result of the time and frequency combination.This is resolve by utilising SPWVD by converting the time-series signal to TFR.
Selecting a cluster size empirically.
Parameters for optimisation are chosen at random.
Future direction
The future directions outlined in the review encompass the need for further exploration of multimodal data analysis to enhance the accuracy of EEG analysis systems, the application of explainable AI techniques to improve the interpretability and transparency of AI models, investigation of the sustained impact of EEG on cognitive function and overall health, exploration of personalised interventions tailored to individuals’ specific needs, and the development of robust AI models capable of handling variations in data and environmental conditions. Addressing these future directions can advance the field of EEG analysis and contribute to the development of more effective, personalised, and reliable interventions.
Conclusion
In this paper we discussed and compare in detail the models used for classification of EEG signal by various author. Some author (Majdalawieh et al. Citation2003; Rasheed et al. Citation2021)– (Péron et al. Citation2012; Gadhoumi et al. Citation2016; Kuhlmann et al. Citation2018; Hosseini et al. Citation2021) has attempted to review neurological condition but they have coved only one disease/condition but in this paper we have covered about six neurological condition along with detail of every steps and data/methods used. A classifier’s job is to automatically divide a given collection of biological signals into several subgroups. Unsupervised and supervised classification methods are the two main categories of classifications. [4]It happens frequently in biomedical practice that different experts disagree on the earlier labelling. In essence, unsupervised classification gathers related signals into one group such that the differences between groups are as great as feasible. In traditional techniques, the signals are seen as samples of several probability models. The classifier determines a model that the signals meet best after estimating the model variables from the data. If the inputs do not fit the assumed probability models, the classifier performs worse.
Declarations
Conflict of Interest On behalf of all authors, the corresponding author states that there is no conflict of interest.
Disclosure statement
No potential conflict of interest was reported by the authors
Data availability statement
Data sharing not applicable to this article as no datasets were generated or analysed during the current study
Additional information
Notes on contributors
Abhishek Jain
Mr. Abhishek Jain is currently working as an Assistant Professor in Information Technology Department, Central University, Bilaspur, India and having 14 years of industrial, teaching and research experience. He has completed B.E. from GEC Raipur and M. Tech from NIT Allahabad currently pursuing PhD from Central University Bilaspur C.G. He is also worked as senior software engineer in TCS. He has authored more than 10 scientific publications in peer reviewed journals. He has worked in Geographical Information Systems (GIS) project Thames Water London UK and RAPDRP Gujarat. His industrial working experience include object-oriented analysis modelling and design, database administrator, Oracle, SQL, XML, XSLT, DTD, Java etc. His research focused on remote sensing, image processing, signal processing biomedical engineering, EEG signal, ECG Signal, IOT, block chain technology.
Rohit Raja
Dr. Rohit Raja is working as Associate Professor & Head in the IT Department at the Guru Ghasidas, Vishwavidyalaya, Bilaspur (CG) has done Ph.D. in Computer Science and Engineering in 2016 from C. V. Raman University India. His main research interest includes face recognition, Signal Processing, and Networking and Data Mining. He has filed successfully 27 patents. He has been received 3 times invitation being a Guest in Scopus Indexed IEEE/Springer Conferences. He has been invited many times being an expert in various Colleges/universities in India. He has published 100 research papers in various International/National Journals (including IEEE, Springer, etc.) and Proceedings of the reputed International/ National Conferences (including Springer and IEEE). He has received the “Excellence in Research” Award under the Category of HEI Professor by Auropath Global Awards, 2019. He has received the “Distinguished Research Award “I2OR Awards 2019 during the 4th International Conclave on Interdisciplinary Research for Sustainable Development 2020 (IRSD 2020). He has received 2nd Runner up an award in GRAND Finale of SMART INDIA HACKATHON 2017 Ministry of Skill Development and Entrepreneurship, Government of India. He is a member of a professional international society including IEEE, ISTE, CSI, ACM, etc. He is on the editor/ reviewers of many peer-reviewed and refereed journals (Including IEEE, Springer, ender science).
Sumit Srivastava
Dr. Sumit Srivastava is working as an Assistant Professor in the department of Computer Science and Engineering, Birla Institute of Technology Mesra, Ranchi, India. He has done his Ph.D. in Computer Science and Engineering from the Birla Institute of Technology Mesra, Ranchi. He has 12 years of experience in teaching and research. His areas of interest are speech processing, signal processing, cryptography and network security, embedded Systems, and machine learning. He has received several patents. He has also published several papers in various international/national journals and the proceedings of prestigious international/national conferences.
Prakash Chandra Sharma
Prakash Chandra Sharma is currently working as Associate Professor in the School of of Information Technology at Manipal University Jaipur, India. He has received his honored degree of Ph.D. from Indian Institute of Technology Indore in discipline of Computer Science & Engineering. He completed his Master of Engineering in Computer Engineering discipline from SGSITS Indore. He has experience of teaching and research of more than 18 years in various areas of Computer Science & Engineering. His research interest includes Graph Theory, Theoretical Computer Science, Artificial Intelligence, and Soft Computing. The key subjects, he has taught at UG and PG levels include Data Structures & Algorithms, Theory of Computation, Operating System, Compiler Design, Artificial Intelligence, Semantic Web, Graph Theory, Soft Computing, Discrete Mathematics and many more. He has published number of research papers in various International Journals indexed in SCI/Scopus, and in Proceedings of the reputed International/ National Conferences as well. He has also published number of book chapters in various edited book with reputed publishers like Elsevier, Springer, CRC Press, Willey etc. He is active reviewer and editorial member of various reputed International Journals in his research areas. He is a member of various Professional International Societies (including IEEE, CSI, IAENG, Institute of Engineers India). He is recipient of many awards and recognitions at national level.
Jayesh Gangrade
Jayesh Gangrade received PhD degree in Computer Science & Engineering from Maulana Azad National Institute of Technology Bhopal in 2020. He has received MTech. degree with honours in Computer Science and Engineering from Maulana Azad National Institute of Technology Bhopal in 2008. He has also worked as a project engineer in research centre in Wipro technology Bangalore. He has more than 18 years teaching and research experience in various areas of Computer Science & Engineering. He is currently working as an Associate Professor at Manipal University Jaipur, Rajasthan. He has published several research papers in various International/National Journals and in Proceedings of the reputed International/ National Conferences as well. His research interests are in the areas of computer vision, image processing and Deep learning
Manoj R
Manoj R, an academician with B.E., MTech and currently pursuing his PhD in CSE in block chain technology. He is working as an assistant professor at the Department of Computer Science & Engineering at Manipal Institute of Technology, Manipal Academy of Higher Education (MAHE), Manipal, Karnataka, India. He has an academic experience of more than 15 years. He has presented and published more than 20 papers in reputed journals and conferences of international repute. He has reviewed many research papers for reputed journals and conferences. His research interests cover cryptography and network security, and block chain and its applications.
References
- Abd El-Samie FE, Alotaiby TN, Khalid MI, Alshebeili SA, Aldosari SA. 2018. A review of EEG and MEG epileptic spike detection algorithms. IEEE Acces. 6:60673–26. doi: 10.1109/ACCESS.2018.2875487.
- Akbari H, Sadiq MT, Payan M, Esmaili SS, Baghri H, Bagheri H. 2021 Feb. Depression detection based on geometrical features extracted from sodp shape of EEG signals and binary PSO. Trait Signal. 38(1):13–26. doi: 10.18280/TS.380102.
- Akbari H, Tariq Sadiq M, Jafari N, Too J, Mikaeilvand N, Cicone A, Serra-Capizzano S. 2023. Recognizing seizure using Poincaré plot of EEG signals and graphical features in DWT domain. Bratisl Lek Listy. 124(1):12–24. doi: 10.4149/BLL_2023_002.
- Almuhammadi WS, Aboalayon KAI, Faezipour M. 2015. Efficient obstructive sleep apnea classification based on EEG signals. Undefined. doi: 10.1109/LISAT.2015.7160186.
- Anitha C. 2019. Detection and analysis of drowsiness in human beings using multimodal signalspp. 157–174. doi: 10.1007/978-3-319-93940-7_7.
- Anjum MF, Dasgupta S, Mudumbai R, Singh A, Cavanagh JF, Narayanan NS. 2020 Oct. Linear predictive coding distinguishes spectral EEG features of Parkinson’s disease. Parkinsonism Relat Disord. 79:79–85. doi: 10.1016/j.parkreldis.2020.08.001.
- Bajaj V, Taran S, Khare SK, Sengur A. 2020 Jun. Feature extraction method for classification of alertness and drowsiness states EEG signals. Appl Acoust. 163:107224. doi: 10.1016/j.apacoust.2020.107224.
- Bajaj V, Taran S, Sengur A. 2018 Dec. Emotion classification using flexible analytic wavelet transform for electroencephalogram signals. Health Inf Sci Syst. 6(1):12. doi: 10.1007/s13755-018-0048-y.
- Bhattacharjee A, Saha S, Fattah SA, Zhu W-P, Ahmad MO. 2019 May. Sleep apnea detection based on rician modeling of feature variation in multiband EEG signal. IEEE J Biomed Health Inform. 23(3):1066–1074. doi: 10.1109/JBHI.2018.2845303.
- Boonnak N, Kamonsantiroj S, Pipanmaekaporn L. 2015 Aug. Wavelet Transform Enhancement for Drowsiness Classification in EEG Records Using Energy Coefficient Distribution and neural network. Int J Mach Learn Comput. 5(4):288–293. doi: 10.7763/IJMLC.2015.V5.522.
- Boostani R, Sadatnezhad K, Sabeti M. 2009. An efficient classifier to diagnose of schizophrenia based on the EEG signals. Expert Syst Appl. 36(3 PART 2):6492–6499. doi: 10.1016/J.ESWA.2008.07.037.
- Budak U, Bajaj V, Akbulut Y, Atila O, Sengur A. 2019 Sep. An effective hybrid Model for EEG-Based drowsiness detection. IEEE Sens J. 19(17):7624–7631. doi: 10.1109/JSEN.2019.2917850.
- Chang H-H, Moura JMF. 2018 Nov. Biomedical Signal Processing. Undefined. 245–278. doi: 10.1201/9780849338595-8.
- Chaturvedi M, Hatz F, Gschwandtner U, Bogaarts JG, Meyer A, Fuhr P, Roth V. 2017 Jan. Quantitative EEG (QEEG) measures differentiate Parkinson’s disease (PD) patients from healthy controls (HC). In Front aging neurosci Vol. 9. JAN; doi: 10.3389/fnagi.2017.00003.
- Chaudhary S, Taran S, Bajaj V, Sengur A. 2019 Jun. Convolutional Neural Network Based Approach Towards Motor Imagery Tasks EEG signals classification. IEEE Sensors J. 19(12):4494–4500. doi: 10.1109/JSEN.2019.2899645.
- Chaudhary S, Taran S, Bajaj V, Siuly S. 2020 Apr. A flexible analytic wavelet transform based approach for motor-imagery tasks classification in BCI applications. Comput Methods Programs Biomed. 187:105325. doi: 10.1016/j.cmpb.2020.105325.
- de Oliveira APS, de Santana MA, Andrade MKS, Gomes JC, Rodrigues MCA, dos Santos WP. 2020 Sep. Early diagnosis of Parkinson’s disease using EEG, machine learning and partial directed coherence. Res Biomed Eng. 36(3):311–331. doi: 10.1007/s42600-020-00072-w.
- Devia C, Mayol-Troncoso R, Chile S, Parrini J, Orellana G, Ruiz A, Maldonado PE, Ignacio J. 2019 Jun. EEG classification during scene free-viewing for schizophrenia detection. IEEE Trans Neural Syst Rehabil Eng. 27(6):1193–1199. doi: 10.1109/TNSRE.2019.2913799.
- Drissi TB, Zayrit S, Nsiri B, and Ammoummou A, “Diagnosis of Parkinson’s disease based on Wavelet Transform and mel frequency cepstral coefficients,” 2019. [Online]. Available: www.ijacsa.thesai.org
- El-Dahshan ESA, Bassiouni MM, Khare SK, Tan RS, Rajendra Acharya U. 2024 Apr. ExHyptNet: an explainable diagnosis of hypertension using EfficientNet with PPG signals. Expert Syst Appl. 239:122388. doi: 10.1016/J.ESWA.2023.122388.
- Gadhoumi K, Lina JM, Mormann F, Gotman J. 2016 Feb. Seizure prediction for therapeutic devices: a review. J Neurosci Methods. 260:270–282. doi: 10.1016/J.JNEUMETH.2015.06.010.
- Galgano M, Toshkezi G, Qiu X, Russell T, Chin L, Zhao L-R. 2017 Jul. Traumatic brain injury. Cell Transplant. 26(7):1118–1130. doi:10.1177/0963689717714102.
- Garces Correa A and Laciar Leber E, “An automatic detector of drowsiness based on spectral analysis and wavelet decomposition of EEG records,” in 2010 Annual International Conference of the IEEE Engineering in Medicine and Biology, IEEE, Aug. 2010, pp. 1405–1408. doi: 10.1109/IEMBS.2010.5626721.
- Garcés Correa A, Orosco L, Laciar E. 2014 Feb. Automatic detection of drowsiness in EEG records based on multimodal analysis. Med Eng Phys. 36(2):244–249. doi: 10.1016/j.medengphy.2013.07.011.
- Health home | Johns Hopkins Medicine. 2023b Feb 2. [Online]. Available: https://www.hopkinsmedicine.org/health/
- Holdgraf C, Appelhoff S, Bickel S, Bouchard K, D’Ambrosio S, David O, Devinsky O, Dichter B, Flinker A, Foster BL, et al. 2019 Jun. iEEG-BIDS, extending the brain imaging data structure specification to human intracranial electrophysiology. Sci Data. 6(1):1–6. doi: 10.1038/s41597-019-0105-7.
- Hosseini MP, Hosseini A, Ahi K. 2021. A review on machine learning for EEG Signal Processing in bioengineering. IEEE Rev Biomed Eng. 14:204–218. doi: 10.1109/RBME.2020.2969915.
- Ince NF, Goksu F, Tewfik AH, Arica S. 2009 Jul. Adapting subject specific motor imagery EEG patterns in space–time–frequency for a brain computer interface. Biomed Signal Process Control. 4(3):236–246. doi: 10.1016/j.bspc.2009.03.005.
- Jahmunah V, Lih Oh S, Rajinikanth V, Ciaccio EJ, Hao Cheong K, Arunkumar N, Acharya UR. 2019 Sep. Automated detection of schizophrenia using nonlinear signal processing methods. Artif Intell Med. ;100:101698. doi: 10.1016/J.ARTMED.2019.07.006.
- Jeong DH, Do Kim Y, Song IU, Chung YA, Jeong J. 2016. Wavelet energy and wavelet coherence as eeg biomarkers for the diagnosis of Parkinson’s disease-related dementia and Alzheimer’s disease. Entropy. 18(1):8. doi: 10.3390/e18010008.
- Johannesen JK, Bi J, Jiang R, Kenney JG, Chen C-MA. 2016 Dec. Machine learning identification of EEG features predicting working memory performance in schizophrenia and healthy adults. Neuropsychiatr Electrophysiol. 2(1):3. doi: 10.1186/s40810-016-0017-0.
- Kevric J, Subasi A. 2017 Jan. Comparison of signal decomposition methods in classification of EEG signals for motor-imagery BCI system. Biomed Signal Process Control. 31:398–406. doi: 10.1016/j.bspc.2016.09.007.
- Khare SK, Acharya UR. 2023a Oct. Adazd-net: automated adaptive and explainable Alzheimer’s disease detection system using EEG signals. Knowl Based Syst. 278:110858. doi: 10.1016/J.KNOSYS.2023.110858.
- Khare SK, Acharya UR. 2023b Mar. An explainable and interpretable model for attention deficit hyperactivity disorder in children using EEG signals. Comput Biol Med. 155:106676. doi: 10.1016/J.COMPBIOMED.2023.106676.
- Khare SK, Bajaj V. 2020 Dec. A facile and flexible motor imagery classification using electroencephalogram signals. Comput Methods Programs Biomed. 197:105722. doi: 10.1016/j.cmpb.2020.105722.
- Khare SK, Bajaj V. 2021a Mar. Entropy-based drowsiness detection using adaptive variational mode decomposition. IEEE Sens J. 21(5):6421–6428. doi: 10.1109/JSEN.2020.3038440.
- Khare SK, Bajaj V. 2021b Jan. An evolutionary optimized variational mode decomposition for emotion recognition. IEEE Sens J. 21(2):2035–2042. doi: 10.1109/JSEN.2020.3020915.
- Khare SK, Bajaj V. 2021c Jul. Time–frequency representation and convolutional neural network-based emotion recognition. IEEE Trans Neural Netw Learn Syst. 32(7):2901–2909. doi: 10.1109/TNNLS.2020.3008938.
- Khare SK, Bajaj V. 2022 Feb. Optimized tunable Q wavelet transform based drowsiness detection from electroencephalogram signals. IRBM. 43(1):13–21. doi: 10.1016/j.irbm.2020.07.005.
- Khare SK, Bajaj V, Acharya UR. 2021a Apr. Detection of Parkinson’s disease using automated tunable Q wavelet transform technique with EEG signals. Biocybern Biomed Eng. 41(2):679–689. doi: 10.1016/j.bbe.2021.04.008.
- Khare SK, Bajaj V, Acharya UR. 2021b Aug. Pdcnnet: an automatic framework for the detection of Parkinson’s disease using EEG signals. IEEE Sens J. 21(15):17017–17024. doi: 10.1109/JSEN.2021.3080135.
- Khare SK, Bajaj V, Acharya UR. 2021c. SPWVD-CNN for automated detection of schizophrenia patients using EEG signals. IEEE Trans Instrum Meas. 70:1–9. doi: 10.1109/TIM.2021.3070608.
- Khare SK, Blanes-Vidal V, Nadimi ES, Acharya UR. 2024 Feb. Emotion recognition and artificial intelligence: a systematic review (2014–2023) and research recommendations. Inform Fusion. 102:102019. doi: 10.1016/J.INFFUS.2023.102019.
- Khare SK, Gadre VM, Acharya R. 2023 Nov. ECGPsychNet: an optimized hybrid ensemble model for automatic detection of psychiatric disorders using ECG signals. Physiol Meas. 44(11):115004. doi:10.1088/1361-6579/AD00FF
- Khare SK, Gaikwad NB, Bajaj V. 2022. VHERS: a novel variational mode decomposition and Hilbert transform-based EEG rhythm separation for automatic ADHD detection. IEEE Trans Instrum Meas. 71. doi: 10.1109/TIM.2022.3204076.
- Khare SK, March S, Barua PD, Gadre VM, Acharya UR. 2023 Nov. Application of data fusion for automated detection of children with developmental and mental disorders: a systematic review of the last decade. Inform Fusion. 99:101898. doi: 10.1016/J.INFFUS.2023.101898.
- Kim JW, Lee YS, Han DH, Min KJ, Lee J, Lee K. 2015 Mar. Diagnostic utility of quantitative EEG in un-medicated schizophrenia. Neurosci Lett. 589:126–131. doi: 10.1016/j.neulet.2014.12.064.
- Krishna AH, Sri AB, Priyanka KYVS, Taran S, Bajaj V. 2019 May. Emotion classification using EEG signals based on tunable‐ Q wavelet transform. IET Sci, Measur & Tech. 13(3):375–380. doi: 10.1049/iet-smt.2018.5237.
- Kuhlmann L, Lehnertz K, Richardson MP, Schelter B, Zaveri HP. 2018 Oct. Seizure prediction - ready for a new era. Nat Rev Neurol. 14(10):618–630. doi: 10.1038/S41582-018-0055-2.
- Lee RG, Chen CC, Hsiao CC, Wang HW, Wei MS. 2012 Apr. SLEEP APNEA SYNDROME RECOGNITION USING the GREYART NETWORK. Biomed Engi: App, Basis And Comm. 23(3):163–172. doi: 10.4015/S1016237211002505.
- Lin R, Lee R, Tseng C, Zhou H, Chao CF, Jiang J. 2006. A new approach for identifying sleep apnea syndrome using wavelet transform and neural networks. Biomedical Engineering: Applications, Basis and Communications. 18:138–143.
- Lin YP, Wang CH, Jung TP, Wu TL, Jeng SK, Duann JR, Chen JH. 2010. EEG-based emotion recognition in music listening. IEEE Trans Biomed Eng. 57(7):1798–1806. doi: 10.1109/TBME.2010.2048568.
- Liu G, Zhang Y, Hu Z, Du X, Wu W, Xu C, Wang X, Li S. 2017. Complexity Analysis of Electroencephalogram Dynamics in patients with Parkinson’s disease. Parkinsons Dis. 2017:1–9. doi: 10.1155/2017/8701061.
- Majdalawieh O, Gu J, Bai T, and Cheng G, “Biomedical Signal Processing and Rehabilitation Engineering: a review,” IEEE Pacific RIM Conference on Communications, Computers, and Signal Processing - Proceedings, vol. II, pp. 1004–1007, 2003, doi: 10.1109/PACRIM.2003.1235954.
- Mormann F, Andrzejak RG, Elger CE, Lehnertz K. 2007. Seizure prediction: the long and winding road. Brain. 130(Pt 2):314–333. doi: 10.1093/BRAIN/AWL241.
- Murugappan M, Alshuaib W, Bourisly AK, Khare SK, Sruthi S, Bajaj V, Gopinath SCB. 2020 Nov. Tunable Q wavelet transform based emotion classification in Parkinson’s disease using electroencephalography. PloS ONE. 15(11):e0242014. doi: 10.1371/journal.pone.0242014.
- Murugappan M, Ramachandran N, Sazali Y, Murugappan M, Ramachandran N, Sazali Y. 2010 Apr. Classification of human emotion from EEG using discrete wavelet transform. J Biomed Sci Eng. 3(4):390–396. 10.4236/JBISE.2010.34054
- Oh SL, Hagiwara Y, Raghavendra U, Yuvaraj R, Arunkumar N, Murugappan M, Rajendra Acharya U. 2020 Aug. A deep learning approach for Parkinson’s disease diagnosis from EEG signals. Neural Comput Appl. 32(15):10927–10933. doi: 10.1007/s00521-018-3689-5.
- Oung QW, Muthusamy H, Basah SN, Lee H, Vijean V. 2018 Feb. Empirical wavelet transform based features for classification of Parkinson’s disease severity. J Med Syst. 42(2):29. doi:10.1007/s10916-017-0877-2
- Parkinson’s disease - symptoms and causes - mayo clinic. Accessed: Feb 2, 2023c. [Online]. Available: https://www.mayoclinic.org/diseases-conditions/parkinsons-disease/symptoms-causes/syc-20376055
- Park S-H, Lee D, Lee S-G. 2018 Feb. Filter bank regularized common spatial pattern ensemble for small sample motor imagery classification. IEEE Trans Neural Syst Rehabil Eng. 26(2):498–505. doi:10.1109/TNSRE.2017.2757519
- Penzel T, Kesper K, Becker HF. 2006 Oct. Biosignal Monitoring and Recording. Information Technology Solutions For Healthcare. 288–301. doi: 10.1007/1-84628-141-5_13.
- Pernet CR, Appelhoff S, Gorgolewski KJ, Flandin G, Phillips C, Delorme A, Oostenveld R. 2019. EEG-BIDS, an extension to the brain imaging data structure for electroencephalography. Sci Data. 6:103. doi: 10.1038/s41597-019-0104-8.
- Péron J, Dondaine T, le Jeune F, Grandjean D, Vérin M. 2012 Feb. Emotional processing in Parkinson’s disease: a systematic review. Mov Disorders. 27(2):186–199. doi:10.1002/mds.24025
- Piryatinska A, Darkhovsky B, Kaplan A. 2017 Dec. Binary classification of multichannel-EEG records based on the ϵ-complexity of continuous vector functions. Comput Methods Programs Biomed. 152:131–139. doi: 10.1016/j.cmpb.2017.09.001.
- Raghavendra U, Gudigar A, Paul A, Goutham TS, Inamdar MA, Hegde A, Devi A, Ooi CP, Deo RC, Barua PD, et al. 2023 Sep. Brain tumor detection and screening using artificial intelligence techniques: Current trends and future perspectives. Comput Biol Med. ;163:107063. doi: 10.1016/J.COMPBIOMED.2023.107063.
- Rajput A, Soni P, Awasthi A. 2017 Jul. Result analysis of noise removal in ECG Signal using wavelet decomposition technique. Int J Comput Appl. 170(4):1–4. doi: 10.5120/IJCA2017914807.
- Rasheed K, Qayyum A, Qadir J, Sivathamboo S, Kwan P, Kuhlmann L, O’Brien T, Razi A. 2021. Machine learning for predicting epileptic seizures using EEG signals: a review. IEEE Rev Biomed Eng. 14:139–155. doi: 10.1109/RBME.2020.3008792.
- Repovš G. 2010. Repovš G: dealing with noise in EEG Recording and Data Analysis 18 dealing with noise in EEG Recording and Data Analysis Spoprijemanje s šumom pri zajemanju in analizi EEG signala. Informatica Medica Slovenica. 15(1):18–25.
- Ruffini G, Ibaez D, Castellano M, Dubreuil-Vall L, Soria-Frisch A, Postuma R, Gagnon JF, Montplaisir J. 2019. Deep learning with EEG spectrograms in rapid eye movement behavior disorder. Front Neurol. 10:806. doi: 10.3389/fneur.2019.00806.
- Sabeti M, Boostani R, Katebi SD, Price GW. 2007. Selection of relevant features for EEG signal classification of schizophrenic patients. Biomed Signal Process Control. 2(2):122–134. doi: 10.1016/J.BSPC.2007.03.003.
- Sadiq MT, Akbari H, Siuly S, Li Y, Wen P. 2022 May. Alcoholic EEG signals recognition based on phase space dynamic and geometrical features. Chaos Soliton Fract. 158:112036. doi:10.1016/J.CHAOS.2022.112036.
- Sadiq MT, Yu X, Yuan Z, Aziz MZ. 2020 Dec. Motor imagery BCI classification based on novel two-dimensional modelling in empirical wavelet transform. Electron Lett. 56(25):1367–1369. doi:10.1049/EL.2020.2509
- Sadiq MT, Yu X, Yuan Z, Aziz MZ, Siuly S, Ding W. 2021 Aug. Toward the development of versatile brain–computer interfaces. IEEE Trans Artif Intell. 2(4):314–328. doi: 10.1109/TAI.2021.3097307.
- Sadiq MT, Yu X, Yuan Z, China X, Aziz MZ, Rehman N. 2022. “Motor imagery BCI classification based on multivariate variational mode decomposition,” IEEE Trans Emerg Top Comput Intell. doi: 10.1109/TETCI.2022.3147030.
- Sadiq MT, Yu X, Yuan Z, Zemi R, Rehman AU, Ullah I, Li G, Xiao G. 2019. Motor imagery EEG signals decoding by multivariate empirical wavelet transform-based framework for robust brain-computer interfaces. IEEE Acces. 7:171431–171451. doi: 10.1109/ACCESS.2019.2956018.
- Shahnaz C, Minhaz AT, and Ahamed ST, “Sub-frame based apnea detection exploiting delta band power ratio extracted from EEG signals,” in 2016 IEEE Region 10 Conference (TENCON), IEEE, Nov. 2016, pp. 190–193. doi: 10.1109/TENCON.2016.7847987.
- Sharma M, Acharya UR. 2021 Aug. Automated detection of schizophrenia using optimal wavelet-based 1norm features extracted from single-channel EEG. Cogn Neurodyn. 15(4):661–674. doi:10.1007/s11571-020-09655-w
- Sharma M, Bapodara S, Tiwari J, Acharya UR. 2022 Jan. Automated sleep apnea detection in pregnant women using wavelet-based features. Inform Med Unlocked. 32:101026. doi:10.1016/J.IMU.2022.101026.
- Sharma S, Khare SK, Bajaj V, Ansari IA. 2021 Oct. Improving the separability of drowsiness and alert EEG signals using analytic form of wavelet transform. Appl Acoust. 181:108164. doi:10.1016/j.apacoust.2021.108164.
- Sharma PC, Raja R, Vishwakarma SK, Sharma S, Mishra PK, Kushwah VS. 2022 Nov. Analysis of brain signal processing and real-time EEG signal enhancement. Multimed Tools Appl. 81(28):41013–41033. 10.1007/s11042-022-12887-z
- Shim M, Hwang H-J, Kim D-W, Lee S-H, Im C-H. 2016 Oct. Machine-learning-based diagnosis of schizophrenia using combined sensor-level and source-level EEG features. Schizophr Res. 176(2–3):314–319. doi:10.1016/j.schres.2016.05.007
- Shoeibi A, Ghassemi N, Khodatars M, Moridian P, Alizadehsani R, Zare A, Khosravi A, Subasi A, Rajendra Acharya U, Gorriz JM, et al. 2022 Mar. Detection of epileptic seizures on EEG signals using ANFIS classifier, autoencoders and fuzzy entropies. Biomed Signal Process Control. ;73:103417. doi: 10.1016/J.BSPC.2021.103417.
- Siuly S, Khare SK, Bajaj V, Wang H, Zhang Y. 2020 Nov. A computerized method for automatic detection of schizophrenia using EEG signals. IEEE Trans Neural Syst Rehabil Eng. 28(11):2390–2400. doi:10.1109/TNSRE.2020.3022715
- Siuly S, Li Y. 2012 Jul. Improving the separability of motor imagery EEG signals using a cross correlation-based least square support vector machine for brain–computer interface. IEEE Trans Neural Syst Rehabil Eng. 20(4):526–538. doi:10.1109/TNSRE.2012.2184838
- Siuly S, Li Y. 2015 May. Discriminating the brain activities for brain–computer interface applications through the optimal allocation-based approach. Neural Comput Appl. 26(4):799–811. doi:10.1007/s00521-014-1753-3
- Siuly NA, Li Y, Wen P. 2013. Identification of motor imagery tasks through CC-LR algorithm in brain computer interface. Int J Bioinform Res Appl. 9(2):156. doi: 10.1504/IJBRA.2013.052447.
- Siuly Y, Li, Wen P(. 2011 Dec. Clustering technique-based least square support vector machine for EEG signal classification. Comput Methods Programs Biomed. 104(3):358–372. doi:10.1016/j.cmpb.2010.11.014
- Siuly Y, Li, Wen P(. 2014 Mar. Modified CC-LR algorithm with three diverse feature sets for motor imagery tasks classification in EEG based brain–computer interface. Comput Methods Programs Biomed. 113(3):767–780. doi:10.1016/j.cmpb.2013.12.020
- Siuly HW, Zhang Y. 2016 May. Detection of motor imagery EEG signals employing Naïve Bayes based learning process. Measurement. 86:148–158. doi:10.1016/j.measurement.2016.02.059.
- Soliman S, Fouad AM, Mourad E, Hossam S, Ehab M, Selim S, Darweesh MS. 2022 Nov. Deep learning approaches for epileptic seizure prediction: a review. Institute of Electrical and Electronics Engineers (IEEE). pp. 01–06. 10.1109/niles56402.2022.9942420.
- Subasi A. 2019 Jan. Feature extraction and dimension reduction. Practical Guide For Biomedical Signals Analysis Using Machine Learning Techniques. 193–275. 10.1016/B978-0-12-817444-9.00004-0
- Sui J et al., “Combination of FMRI-SMRI-EEG data improves discrimination of schizophrenia patients by ensemble feature selection,” in 2014 36th Annual International Conference of the IEEE Engineering in Medicine and Biology Society, IEEE, Aug. 2014, pp. 3889–3892. doi: 10.1109/EMBC.2014.6944473.
- Taran S, Bajaj V. 2018 Nov. Drowsiness detection using adaptive hermite decomposition and extreme learning machine for electroencephalogram signals. IEEE Sens J. 18(21):8855–8862. doi:10.1109/JSEN.2018.2869775
- Taran S, Bajaj V. 2019a May. Emotion recognition from single-channel EEG signals using a two-stage correlation and instantaneous frequency-based filtering method. Comput Methods Programs Biomed. 173:157–165. DOI:10.1016/j.cmpb.2019.03.015.
- Taran S, Bajaj V. 2019b Nov. Motor imagery tasks-based EEG signals classification using tunable-Q wavelet transform. Neural Comput Appl. 31(11):6925–6932. doi:10.1007/s00521-018-3531-0
- Taran S, Bajaj V, Sharma D. 2017a Aug. Robust hermite decomposition algorithm for classification of sleep apnea EEG signals. Electron Lett. 53(17):1182–1184. doi:10.1049/el.2017.1365
- Taran S, Bajaj V, Sharma D. 2017b November. TEO separated AM-FM components for identification of apnea EEG signals. Undefined. 2017:391–395. DOI:10.1109/SIPROCESS.2017.8124571.
- Taran S, Bajaj V, Sharma D, Siuly S, Sengur A. 2018 Feb. Features based on analytic IMF for classifying motor imagery EEG signals in BCI applications. Measurement. 116:68–76. DOI:10.1016/j.measurement.2017.10.067.
- Taran S, Bajaj V, Sinha GR, Polat K. 2021 Oct. Detection of sleep apnea events using electroencephalogram signals. Appl Acoust. 181:108137. DOI:10.1016/j.apacoust.2021.108137.
- Tripathy RK, Rajendra Acharya U. 2018. Use of features from RR-time series and EEG signals for automated classification of sleep stages in deep neural network framework. Biocybern Biomed Eng. 38(4):890–902. doi: 10.1016/j.bbe.2018.05.005.
- Tuncer T, Dogan S, Acharya UR. 2020 Jan. Automated detection of Parkinson’s disease using minimum average maximum tree and singular value decomposition method with vowels. Biocybern Biomed Eng. 40(1):211–220. 10.1016/j.bbe.2019.05.006
- Verma NK, Rao LSVS, and Sharma SK, “Motor imagery EEG signal classification on DWT and crosscorrelated signal features,” in 2014 9th International Conference on Industrial and Information Systems (ICIIS), IEEE, Dec. 2014, pp. 1–6. doi: 10.1109/ICIINFS.2014.7036473.
- Vishwakarma SK, Sharma PC, Raja R, Roy V, Tomar S. 2020 Oct. An effective cascaded approach for eeg artifacts elimination. International Journal Of Pharmaceutical Research. 12(4):4822–4828. doi:10.31838/IJPR/2020.12.04.653
- Wang XW, Nie D, Lu BL. 2011. EEG-based emotion recognition using frequency domain features and support vector machines. Lecture Notes In Comp Sci (Including Subseries Lecture Notes In Arti Inte & Lecture Notes In Bioinfo). 7062(PART 1):734–743. doi: 10.1007/978-3-642-24955-6_87/COVER.
- Xu S, Wang Z, Sun J, Zhang Z, Wu Z, Yang T, Xue G, Cheng C. 2020 Jul. Using a deep recurrent neural network with EEG signal to detect Parkinson’s disease. Ann Transl Med. 8(14):874–874. doi: 10.21037/atm-20-5100.
- Yaacob H, Hossain F, Shari S, Khare SK, Ooi CP, Acharya UR. 2023. Application of artificial intelligence techniques for brain-computer interface in mental fatigue detection: a systematic review (2011-2022). IEEE Acces. 11:74736–74758. doi: 10.1109/ACCESS.2023.3296382.
- Yu X, Aziz MZ, Sadiq MT, Fan Z, Xiao G. 2021. A new framework for automatic detection of motor and mental imagery EEG signals for robust BCI systems. IEEE Trans Instrum Meas. 70:1–12. doi: 10.1109/TIM.2021.3069026.
- Zhang L, “EEG signals classification using machine learning for the identification and diagnosis of schizophrenia,” in 2019 41st Annual International Conference of the IEEE Engineering in Medicine and Biology Society (EMBC), IEEE, Jul. 2019, pp. 4521–4524. doi: 10.1109/EMBC.2019.8857946.
- Zhang R, Xu P, Guo L, Zhang Y, Li P, Yao D, Xiong M. 2013 Sep. Z-Score linear discriminant analysis for EEG based brain-computer interfaces. PloS ONE. 8(9):e74433. 10.1371/journal.pone.0074433
- Zhou J, Wu X, Zeng W. 2015 Dec. Automatic detection of sleep apnea based on EEG detrended fluctuation analysis and support vector machine. J Clin Monit Comput. 29(6):767–772. doi:10.1007/s10877-015-9664-0