
 ?Mathematical formulae have been encoded as MathML and are displayed in this HTML version using MathJax in order to improve their display. Uncheck the box to turn MathJax off. This feature requires Javascript. Click on a formula to zoom.
ABSTRACT
The aims of this study were 1) to propose a simple two-dimensional (2D) video-based method to measure segment lengths in the clean and jerk during weightlifting competitions, and 2) to check concurrent validity and test-retest reliability compared to 3D video-based measurements. In the first part of the study, key body positions for the assessment of segment lengths via 2D measurement method were determined. In the second part, concurrent validity was verified, comparing the 2D segment length measurements to 3D measurements. In the third part, the test-retest reliability of the 2D approach was investigated. In the clean and in the jerk, the lift-off/start position and the position of maximum barbell velocity displayed a minimised offset between ‘real’ 3D segment lengths and 2D projections of the segment lengths. For the concurrent validity assessment, the overall random measurement error was 4.3% with concordance correlation coefficients ranging from 0.64 to 0.88. The standard error of measurement in the test-retest procedure was 2.4% on average with intraclass correlation coefficients ranging from 0.85 to 0.96. The proposed 2D video-based approach to measure body segment lengths during weightlifting exercises is proven to be a valid and reliable procedure.
1 Introduction
In Olympic Weightlifting, athletic performance is defined by the barbell load that can be lifted from the ground to the overhead position in the snatch and the clean and jerk [1]. Besides an excellent lifting technique, performance in weightlifting is highly associated with the athlete’s strength abilities (Tucholke Citation1987; Hori et al. Citation2005; Stone et al. Citation2006). For example, it has been established that higher performing weightlifters display greater lower limb maximum strength in the back squat (r = 0.79 to 0.95) and greater absolute force expression in the isometric midthigh pull (r = 0.83 to 0.84) (Stone et al. Citation2005). The athletes’ physical abilities as well as their sports technique are moderated by individual physical features. In this context, anthropometry (e.g. body segment lengths) plays a crucial role as a relevant (latent) performance indicator (Carter and Ackland Citation2009). In weightlifting, the influence of anthropometry has not yet been sufficiently studied (Ho et al. Citation2014). In other sports, the influence of anthropometrics on performance has been reported (Sammoud et al. Citation2018; Ferland et al. Citation2020; Leuciuc et al. Citation2022). In swimming, the segment length ratio (arm-span/forearm-length) was positively associated with the 100-m butterfly speed performance (Sammoud et al. Citation2018). For handball players, the anthropometric data revealed a significantly lower body height for wings and pivots compared to goalkeepers (Leuciuc et al. Citation2022). As a strength related sport, in powerlifting it was proven that the deadlift one-repetition maximum (1RM) performance was negatively correlated (r = −0.38) with the length of the athlete’s trunk (Ferland et al. Citation2020).
Although current research indicates, that anthropometry may be a factor to help explain sports performance, only a limited amount of studies exists that analysed how anthropometry (i.e. body segment lengths) influences weightlifting performance, especially in elite weightlifters. In this context, it has been reported that the length of the trunk is negatively correlated (r = −0.44) with the ranking achieved in the snatch in 36 female international weightlifters (Musser et al. Citation2014). Further, the relative lengths of the upper limbs are reported to be negatively correlated (r = −0.60) with the normalised snatch performance, while the length of the lower limbs is positively correlated with the average vertical barbell velocity (r = 0.60) in 44 male and female amateur weightlifters (Pérez et al. Citation2021).
Due to the limited research on anthropometry in weightlifting, no generalisable evidence of the effects of anthropometry on weightlifting performance exists, in particular in elite athletes. In order to point out general statements about the influence of anthropometry on athletic performance in weightlifting, a large and homogeneous group of subjects with a high performance level is required, as it can only be found at international competitions.
The assessment of body segment lengths relies on either direct manual measurements by specially trained personnel, or 3D video-based measurements as an indirect procedure which represents the current ‘gold standard’ (McLean et al. Citation2005). Manual measurements are nearly impossible to realise in international competitions and even though 3D video-based measurements are highly accurate, they rely on a minimum of two synchronised video cameras and a complex 3D calibration procedure that limits the application in international competitions (limited space and access for researchers to set up camera systems, etc.). In contrast, 2D video measurements were frequently used to analyse sagittal barbell kinematics in international weightlifting competitions (Nagao & Sandau et al. Citation2019; Nagao et al. Citation2022). Therefore, it would be beneficial to use this routine 2D video analysis setup to assess the lifters’ body segment lengths. This approach is of interest for practitioners and researchers in order to have a less comprehensive but time-saving measurement procedure.
Until now, it is unclear whether 2D video recordings are suitable to measure body segment lengths in weightlifting. Most studies that addressed a comparison of 2D and 3D assessments of kinematic data dealt with gait kinematics (Michelini et al. Citation2020). Norris and Olson (Citation2010) reported good concurrent validity (Pearson r ≥ 0.95) and test-retest reliability (ICC = 0.79 and 0.91) for the assessment of hip and knee angles during a lifting task, using 2D analysis. Concerning the validity of length measurements (i.e. height and displacement parameters of the feet), Zult et al. (Citation2019) reported mean deviations of differences between video-based 2D and 3D measurements ranging from 0.025 to 0.04 m (4% to 18%). In addition, from the aforementioned study, coefficients of relative reliability (intraclass correlation coefficient [ICC]) for body length measurements ranged from 0.924 to 0.991 (2D) and from 0.924 to 0.993 (3D) (Zult et al. Citation2019). In consideration of the reported descriptive data in the study of Zult et al. (Citation2019), measures of absolute reliability (standard error of measurement [SEM]) can be calculated a posteriori. The a posteriori calculated percentage SEM ranged from 9.1% to 15.6% (2D) and from 7.4% to 11.8% (3D), respectively (Zult et al. Citation2019). Even though the reliability of 2D video-based body length measures seems to be associated with rather large measurement errors, this cannot be generalised as the general assessment of test quality criteria (including validity) depends on the specific application (DeFroda et al. Citation2016; Michelini et al. Citation2020). In case of weightlifting, the body segments are vertically aligned in some movement positions during the clean and the jerk (e.g. start positions). If the segments are arranged in the sagittal plane, the transversal axis can be neglected for measuring segment lengths. In that case, 2D measurements of segment lengths could be measured accurately compared to a 3D setup.
Therefore, the aims of this study were 1) to propose a simple 2D video-based method to measure segment lengths during the clean and jerk, and 2) to check concurrent validity and test-retest reliability compared to 3D video-based measurements. It was hypothesised that the proposed 2D method will show strong concurrent validity (CCC >0.61) (Koch and Spörl Citation2007) and good test-retest reliability (ICC >0.75) (Koo and Li Citation2016).
2 Materials and methods
2.1 Design
The study consists of three parts (). In the first part, the focus was to assess key body positions during the lifts in the clean and the jerk with the smallest differences in body segment lengths (forearm, upper arm, trunk, thigh, shank) between 2D and 3D video-measurements. The defined body positions were used as reference-positions for further analyses in the following parts of this study. The starting positions and the maximum velocity positions of the clean and the jerk were expected to show the best results, since segments are aligned in the sagittal plane. Both positions were determined using the vertical velocity of the barbell as reference parameter.
Figure 1. Methodical procedure.
In the second part, the concurrent validity of the lengths of forearms, upper arms, trunks, thighs, and shanks measured with 2D and 3D videometry was assessed. For this purpose, the specific body positions defined in part 1 were used as reference.
In the third part, a test-retest protocol was conducted to assess the reliability for the segment length measurements of forearms, upper arms, trunks, thighs, and shanks at the defined body positions using the 2D video-recording approach. The same rater measured all segment lengths of all participants twice, separated by 10 weeks.
2.2 Participants
For the first part of the investigation, 8 male and 2 female elite weightlifters (age: 23.6 ± 3.7 years; body mass: 83.9 ± 19.4 kg; best combined total in Olympic Weightlifting: 304.9 ± 49.6 kg [data presented as mean ± standard deviation]) volunteered to participate. For the assessment of validity and reliability, additional 13 male and 3 female recreationally strength-trained people were recruited. In total 21 male and 5 female people (age: 27.7 ± 5.0 years; body mass: 81.6 ± 22.9 kg) voluntarily participated in the second and third part of the investigation. The study is in accordance with the Declaration of Helsinki and the study protocol was approved by the Institutional Ethics Board.
2.3 Methods and materials
In the first part of the study, weightlifters performed one repetition in the clean and jerk () at approximately 80% of their one-repetition maximum. All lifts were recorded via a 3D video setup. For the 3D-video-recordings, two cameras (Basler acA1920-155uc) were placed in front of the weightlifters at an angle of 90° between the optical axes. The recording frequency of the cameras was 100 frames per second. The 3D movement space was calibrated using a calibration cube and the video-data was manually digitised using the Mess3D (1.0, Leipzig, Germany) software (Drenk Citation2005).
Figure 2. Clean (top series) and jerk (bottom series) from start position to catch position.
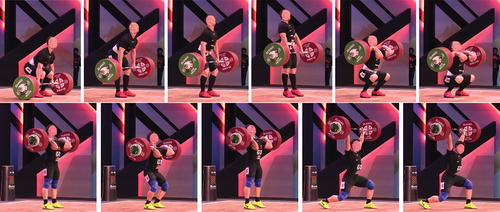
During the lifts, the lengths of the upper arm, forearm, trunk, thigh and shank were assessed by digitising of the corresponding anatomical landmarks for every video-frame from the start position to the catch position. Both camera perspectives are connected by an epipolar line which refers to the previously calibrated space. Body segments (i.e. forearm, upper arm, trunk, thigh, shank) were defined as proposed in de Leva (Citation1996) (). The lengths of the body segments were calculated as straight lines in the 2D and 3D space connecting the adjacent digitised anatomical landmarks. To compare the 2D video-based body segment lengths to those measured via 3D video-recordings, only video-data of one camera from the original 3D camera setup was used.
Table 1. Body segments and their adjacent anatomical landmarks used for segment length measurements.
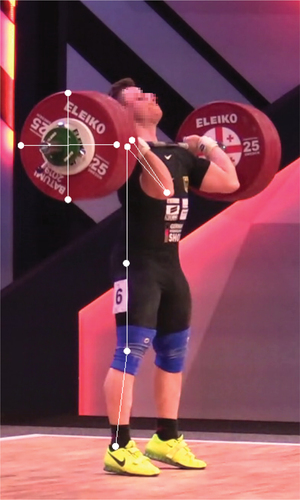
In addition, to emulate the regular 2D video-recordings for the analysis of barbell kinematics, a 2D calibration via the diameter of the barbell plates (0.45 m) was conducted (Sandau et al. Citation2019; Nagao et al. Citation2022). Digitising of the 2D anatomical landmarks followed the same procedure as described for the 3D case and was performed using Mess2D (1.0, Leipzig, Germany) software (Drenk Citation2007).
In addition to the anatomical landmarks, the barbell was tracked during the lifts (in Mess3D software) to calculate the vertical barbell velocity (from calibrated 3D movement space and recording frequency) as a reference to the corresponding lifting phase (e.g. position of maximum vertical barbell velocity = end of acceleration phase) (Böttcher and Deutscher Citation1999; Gourgoulis et al. Citation2000). After digitising, 2D and 3D segment lengths were calculated and stored as time-series data. For every body segment, absolute differences between the 2D and 3D lengths were calculated at every discrete data-point of the time-series (). Body positions corresponding to the smallest difference between the 2D and 3D assessments were used for further analyses (i.e. part two and three of this study).
Figure 3. Anatomical landmarks and plate diameter assessment in the 2D analysis.
In the second part of the study, the concurrent validity of 2D to 3D segment length assessment was analysed. Participants were instructed to hold the barbell in body positions of the clean and jerk that have been extracted as best matched positions between 2D and 3D segment lengths. Data processing (camera setup, digitising, calculation) for 3D and 2D segment length assessment for the respective body positions was completed as previously described in the first part of the study. The final lengths of the segments were calculated as mean from five consecutive measurements around the aspired reference body position. For further analyses (i.e. part 3), the smallest absolute measurement error was used as primary indicator for the selection of the ‘best’ positions to determine segment lengths.
In the third part, the test-retest reliability of the 2D approach was assessed. Only the best position for each segment (considering the results of concurrent validity, part 2) was examined. During the test-retest procedure, 2D segment lengths were measured by video as described for part 2, with the two measurements separated by 10 weeks.
The manual digitising of anatomical landmarks was conducted by the same highly experienced evaluator in all parts of the study.
2.4 Statistical analysis
For the assessment of relative concurrent validity of the 2D measurements, the concordance correlation coefficient (CCC) and its 95% confidence limits were calculated (Lin Citation1989). The strength-of-agreement criteria were categorised as <0.10 = no agreement, 0.10–0.40 = poor agreement, 0.41–0.60 = clear agreement, 0.61–0.80 = strong agreement, 0.81–1.00 = almost complete agreement (Koch and Spörl Citation2007; Akoglu Citation2018). SDD% presents the standard deviation of differences (SDD) in relation to the grand mean. Absolute concurrent validity was assessed using SDD, SDD% and Bland-Altman limits of agreement (LoA) (Bland and Altman Citation1986). In addition, the Deming regression was used to identify statistical significant constant bias (i.e. lower and upper confidence limits of the intercept did not contain 0) and proportional bias (i.e. lower and upper confidence limits of the slope did not contain 1) (Payne Citation1997). In case of statistical significant constant and/or proportional bias, measurements of 2D segment lengths were re-calibrated using the Deming regression equation before conducting the Bland-Altman analysis (Ungerer and Pretorius Citation2018).
For the assessment of the relative test-retest reliability, the ICC (2.1) was used (Koo and Li Citation2016). The ICC was categorised as poor (<0.5), moderate (0.5–0.75), good (0.75–0.9) and excellent (>0.9) (Koo and Li Citation2016). The standard error of measurement (SEM, SEM%) was used to assess the absolute test-retest reliability (Weir Citation2005). The SEM was calculated from the standard deviation of the test-retest difference scores divided by √2 (Hopkins Citation2000). The SEM% presents the SEM in relation to the grand mean. The acceptable thresholds for absolute reliability, were good <5% moderate (5–10%), and poor (>10%) (Gomez-Carmona et al. Citation2021). All statistical analyses were conducting using R (4.3.0) (RStudioTeam Citation2020).
3 Results
3.1 Part 1 - body position assessment
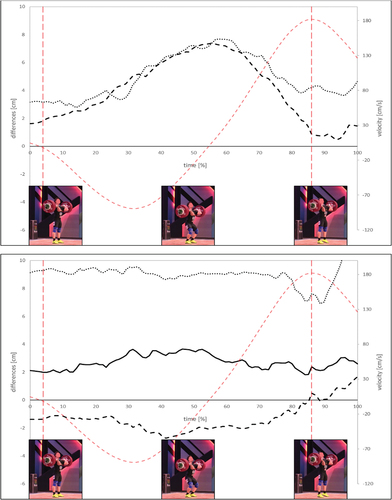
In the clean, based on the visual inspection of the time series differences for the 2D and 3D segment length, it can be concluded that the segment length of the forearm and upper arm should be assessed during the starting position (i.e. the lift-off), since differences between measurement methods are the smallest in this position. The thigh and shank show smallest differences around the maximum barbell velocity position. For the trunk, the differences between 2D and 3D assessment are equal in the starting and maximum velocity position, which is why the trunk should be assessed in both positions ().
Figure 4. Differences of the segment lengths between 2D and 3D assessment during the clean: red lines = vertical barbell velocity (vertical red lines = left - barbell lift off, right - maximum vertical barbell velocity), black lines in top graph: dotted line = thigh, dashed line = shank, black lines in bottom graph: dotted line = upper arm, dashed line = forearm, solid line =trunk.
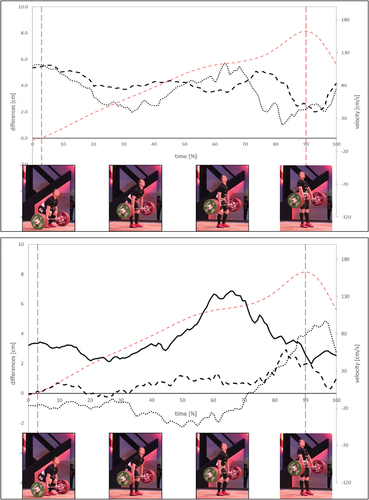
In the jerk, the smallest differences in segment length of the trunk, thigh, shank, and forearm can be detected in the starting position and at the maximum velocity position. For the upper arm, the difference between 2D and 3D is very large during the entire movement, making the jerk unsuitable to assess the upper arm segment length ().
Figure 5. Differences of the segment lengths between 2D and 3D assessment during the jerk: red lines = vertical barbell velocity (vertical red lines = left - barbell lift off, right - maximum vertical barbell velocity), black lines in top graph: dotted line = thigh, dashed line = shank, black lines in bottom graph: dotted line = upper arm, dashed line = forearm, solid line =trunk.
3.2 Part 2 - concurrent validity of 2D segment length assessment
To assess concurrent validity of 2D segment length measurements, the previously defined candidate body positions (part 1) were used. The statistical results for all segments and all candidate positions in the clean and the jerk are listed in .
Table 2. Statistical measures of concurrent validity of 2D segment length measurements. Bold data represent smallest absolute measurement error for each body segment.
The Deming regression detected a significant constant and proportional bias for the forearm lengths during the lift-off position in the clean. Therefore, the regression formula (1) was used to correct (i.e. re-calibrate) the ‘raw’ data before conducting the Bland-Altman analysis ().
Figure 6. Deming and Bland-Altman analysis of the agreement of 2D and 3D segment lengths. Only comparison with the best concurrent validity results per segment are shown. Deming regression is shown with fitted linear model (dashed line) and the identity line (2D = 3D, slope = 1; solid line). Bland-Altman plots show the lower and upper limits of agreement (dashed lines) and the systematic bias (solid lines). Bland-Altman plots of shank, thigh, trunk and upper arm show “raw” data, whereas re-calibrated data from Deming regression is shown in the Bland-Altman plot of the forearm, since significant, constant and proportional bias was found.
Overall, the absolute (SDD, SDD%) and relative (CCC) measures of concurrent validity of the 2D segment lengths showed acceptable results with almost complete agreement. The smallest absolute measurement errors (i.e. SDD) were found for the shank, the thigh, and the trunk in the jerk start position and for the upper arm and the forearm in the clean start position, respectively.
3.3 Part 3 – test-retest reliability of 2D segment lengths assesment
For the test-retest analyses, the body positions with the best results from the concurrent validity assessment were used (). The ICCs indicate good to excellent reliability (ICC = 0.75 ≤ 1.00) of the 2D-measurements, with SEM% ranging from 1.51% to 3.51%.
Table 3. Measures of test-retest reliability in 2D measurements.
4 Discussion
The aim of this study was to assess concurrent validity and test-retest reliability of a simple approach to assess 2D segment lengths using video-analysis in weightlifting competitions. In accordance with the hypothesis, the proposed method displayed at least strong concurrent validity (CCC >0.61) (Koch and Spörl Citation2007) and good test-retest reliability (ICC >0.75) (Koo and Li Citation2016).
The idea to use a 2D segment length assessment via video-analysis during weightlifting exercises is linked to the simplicity of the measurement procedure and the setup for the video-based 2D barbell analysis (Sandau et al. Citation2019; Nagao et al. Citation2022). The proposed method of measuring segment lengths using 2D video-recordings works well in the sport of weightlifting since the majority of the athlete’s movement takes place in the sagittal plane and body segments were aligned almost vertically in certain positions during the lifts.
In the first part of this investigation, we found two key positions each for the clean and the jerk, in which at least some of the body segments are aligned in the sagittal plane. That means, in the clean and in the jerk, the lift-off/start and vmax position displayed a minimised offset between ‘real’ 3D segment lengths and 2D projection of the ‘real’ segment lengths measured by videometry.
For the concurrent validity assessment (part 2), the overall random measurement error (i.e. SDD) was 4.3% (all best body positions and segment lengths), and thus in agreement with previously published measurement errors (4–18%) for the comparisons of distances derived from 2D vs 3D measurements (Zult et al. Citation2019). The small deviation between 2D and 3D measured segment lengths at the lift-off/start and maximum velocity position compared to other time-points during the lifts is implicitly confirmed by Baumann et al. (Citation1988) who reported the smallest deviations between 2D and 3D knee joint angles at lift-off and at the end of the acceleration phase during the snatch. Deming regression analysis revealed a significant constant and proportional bias of 2D measured forearm lengths in the starting position of the clean. This could be due to the fact that taller athletes need to use a wider grip in the clean. By using a wider grip, the angle between upper body segments and upper body becomes larger and therefore the influence of the transversal axis for the assessment of the forearm length increases. As a result, forearm measurements will be proportionally shorter in the assessment of taller athletes.
The SEM% in the test-retest procedure (part 3) is on average 2.4%, which can be classified as ‘good’ (Gomez-Carmona et al. Citation2021). In addition, the a posteriori calculated SEM based on the presented descriptive data of the 2D tracking of gait kinematics in the study of Zult et al. (Citation2019) ranged between 9.1% and 15.6% (mean 11.8%). In case of bodyscanners, the a posteriori adjusted SEM (i.e. SEM was re-calculated for a better comparability) ranged between 7.5% and 10.7% (mean 9.0%) (Braganca et al. Citation2018). Of note, the proposed 2D measurement approach for the assessment of anatomical length parameters in this study outperforms comparable studies assessing body parameters using 2D video tracking (Zult et al. Citation2019) and bodyscanners (Braganca et al. Citation2018).
Still, the present study has some limitations that need to be discussed. First, in part 2 and 3 of this investigation, participants were instructed to statically hold the candidate body positions during the video-recordings, to imitate the lift-off/starting position and the vmax position instead of executing the clean and jerk. That may have affected the precision compared to a real lift situation. However, even with video-recordings at 100 frames per second, clear ‘static’ body positions can be derived from the video images, also during the vmax positions. Second, the small number of 26 participants may limit the precision of the presented measurement errors. Finally, and in particular of relevance for the reliability assessment, the same experienced evaluator conducted the digitisation of anatomical landmarks in the video-recording. Therefore, the SEM may be affected if less experienced evaluators apply the proposed 2D approach in practice. If possible, specially trained personnel with good anatomical knowledge should carry out the presented method to make the measured values as reliable as possible. Further investigations should consider the assessment of inter-rater reliability. Third, if the camera perspective is too lateral, anatomical landmarks might be covered by the barbell plates. A sideview of the athlete as it might be of interest for technical analysis in weightlifting is not applicable for the 2D assessment of segment lengths. In it can be seen that the wrist joint is covered by the barbell plates. In that case, anatomical landmarks cannot be detected accurately and the camera perspective should be changed.
5 Conclusions
The proposed 2D video-based approach to measure body segment lengths during weightlifting exercises is proven to be a valid and reliable procedure. In weightlifting, there is evidence for the importance of anthropometry and its effect on sports technique and performance, but its significance has not been thoroughly investigated in the recent literature (Ho et al. Citation2014). The presented easy-to-administer procedure (i.e. one video camera, image calibration via the diameter of the barbell plates) can be used to bridge the aforementioned knowledge gap, as body segment lengths can be measured from standard 2D video-recordings that were used to measure sagittal barbell kinematics or even by pictures being photographed during international competitions. If this approach is used for determining segment lengths of weightlifters, we recommend assessing shank, thigh and trunk in the start position during the jerk, whereas the upper arm and forearm should be assessed in the lift-off position during the clean.
Author contributions
Conceptualisation, H.L., I.S. and M.W.; methodology, H.L. and I.S.; software, H.L.; validation, H.L.; formal analysis, H.L., I.S. and M.W.; investigation, H.L.; resources, H.L. and I.S.; data curation, H.L.; writing – original draft preparation, H.L.; writing – review and editing, I.S. and M.W.; visualisation, H.L.; project administration, H.L.; funding acquisition, H.L. and I.S.
Institutional Review Board statement
The study was conducted in accordance with the Declaration of Helsinki, and approved by the Institutional Ethics Committee of the Institute for Applied Training Science (protocol code ER_2022.24.03_5; NaN Invalid Date).
Informed consent statement
Informed consent was obtained from all subjects involved in the study.
Disclosure statement
No potential conflict of interest was reported by the author(s).
Data availability statement
The data presented in this study are available on request from the corresponding author. The data are not publicly available due to privacy or ethical restrictions.
Additional information
Funding
Notes on contributors
Hannes Lenz
Hannes Lenz is the head of the weightlifting research group at the Department of Strength, Power and Technical Sports at the Institute for Applied Training Science (Leipzig, Germany). He also is PhD student at the Sport Science Faculty of Leipzig University (Leipzig, Germany). His primary research interests are Olympic weightlifting and strength & conditioning in elite athletes.
Ingo Sandau
Ingo Sandau is currently the head of Department Strength, Power and Technical Sports at the Institute for Applied Training Science (Leipzig, Germany). His primary research interests are Olympic weightlifting, performance analysis and strength & conditioning in elite athletes.
Maren Witt
Maren Witt is the responsible professor of the Department of Sports Biomechanics at the Sport Science Faculty of Leipzig University (Leipzig, Germany). Her primary research interests are movement optimization in elite athletes, gait analysis and strength & power diagnostics.
References
- Akoglu H. 2018. User´s guide to correlation coefficients. Turkish J Emerg Medi. 18(3):91–10. doi: 10.1016/j.tjem.2018.08.001.
- Baumann W, Gross V, Quade K, Galbierz P, Schwirtz A. 1988. The snatch technique of world class weightlifters at the 1985 world championships. Int J Sport Biomech. 4(1):68,89. doi: 10.1123/ijsb.4.1.68.
- Bland JM, Altman DG. 1986. Statistical methods for assessing agreement between two methods of clinical measurement. Lancet. 327(8476):4. doi: 10.1016/S0140-6736(86)90837-8.
- Böttcher J, Deutscher E. 1999. Biomechanische Ergebnisse zur Bewegungstechnik im Gewichtheben (Reißen). Leistungssport. 29(4):55–62.
- Braganca S, Arezes P, Carvalho M, Ashdown SP, Castellucci I, Leao C. 2018. A comparison of manual anthropometric measurements with kinect-based scanned measurements in terms of precision and reliability. Work. 59(3):325–339. doi: 10.3233/WOR-182684.
- Carter JEL, Ackland T. 2009. Somatotypes in sport. In: Applied anatomy and biomechanics in sport. Champain: Human Kinetics; pp. 47–66.
- DeFroda SF, Thigpen CA, Kriz PK. 2016. Two-dimensional video analysis of youth and adolescent pitching biomechanics: a tool for the common athlete. Curr Sports Med Rep. 15(5):350–358. doi: 10.1249/JSR.0000000000000295.
- de Leva P. 1996. Adjustment to Zatsiorsky-Seluyanov`s segment inertia parameters. J Biomech. 29(9):1223–1230. doi: 10.1016/0021-9290(95)00178-6.
- Drenk V. 2005. 3D-Videobild-Messprogramme am IAT. In: Wagner K, editor 7. Frühjahrsschule Informations- und Kommunikationstechnologien in der angewandten Trainingswissenschaft. Leipzig: IAT; pp. 71–76.
- Drenk V. 2007. Videobildmessverfahren mess2dDV_WKL - Ein 2-D-Bildmessverfahren für DV-Videoclips mit implizierten Winkel- und KSP-Berechnungsverfahren. Leipzig: IAT.
- Ferland P-M, Laurier A, Comtois AS. 2020. Relationships between anthropometry and maximal strength in male classic powerlifters. Int J Exerc Sci. 13(4):20.
- Gomez-Carmona CD, Pino-Ortega J, Rico-Gonzalez M, Bastida-Castillo A. 2021. Global navigation satellite systems. In: Pino-Ortega J, and Rico-Gonzalez M, editors The use of applied technology in team sport. New York: Routledge; pp. 20–38.
- Gourgoulis V, Aggelousis N, Mavromatis G, Garas A. 2000. Three-dimensional kinematic analysis of the snatch of elite Greek weightlifters. J Sports Sci. 18(8):643–652. http://europepmc.org/abstract/MED/10972413.
- Ho LK, Lorenzen C, Wilson CJ, Saunders JE, Williams MD. 2014. Reviewing current knowledge in snatch performance and technique: the need for future directions in applied research. J Strength Cond Res. 28(2):574–586. doi: 10.1519/JSC.0b013e31829c0bf8.
- Hopkins WG. 2000. Measures of reliability in sports medicine and science. Sports Med. 30(1):1–15. doi: 10.2165/00007256-200030010-00001.
- Hori N, Newton RU, Nosaka K, Stone MH. 2005. Weightlifting exercises enhance athletic performance that requires high-load speed strength. Strength Cond J. 27(4):50–55. doi: 10.1519/00126548-200508000-00008.
- Koch R, Spörl E. 2007. Statistische Verfahren zum Vergleich zweier Messmethoden und zur Kalibrierung: Konkordanz-, Korrelations- und Regressionsanalyse am Beispiel der Augeninnendruckmessung. Klinische Monatsblätter für Augenheilkunde. 224(1):52–57. doi: 10.1055/s-2006-927278.
- Koo TK, Li MY. 2016. A guideline of selecting and reporting intraclass correlation coefficients for reliability research. J Chiropr Med. 15(2):155–163. doi: 10.1016/j.jcm.2016.02.012.
- Leuciuc FV, Petrariu I, Pricop G, Rohozneanu DM, Popovici IM. 2022. Toward an anthropometric pattern in elite Mal Handball. Int J Environ Res Public Health. 15(5):2839. doi: 10.3390/ijerph19052839.
- Lin LI-K. 1989. A concordance correlation coefficient to evaluate reproducibility. Biometrics. 45(1):255–268. doi: 10.2307/2532051.
- McLean S, Walker K, Ford K, Myer G, Hewett T, van den Bogert AJ. 2005. Evaluation of a two dimensional analysis method as a screening and evaluation tool for anterior cruciate ligament injury. Br J Sports Med. 39(6):355–362. doi: 10.1136/bjsm.2005.018598.
- Michelini A, Eshraghi A, Andrysek J. 2020. Two-dimensional video gait analyses a systematic review of reliability, validity, and best practice considerations. Prosthet Orthot Int. 44(4):245–262. doi: 10.1177/0309364620921290.
- Musser LJ, Garhammer J, Rozenek R, Crussemeyer JA, Vargas EM. 2014. Anthropometry and barbell trajectory in the snatch lift for elite women weightlifters. J Strength Cond Res. 28(6):13. doi: 10.1519/JSC.0000000000000450.
- Nagao H, Yamashita D, Li Y. 2022. Validation of video analysis of marker-less barbell auto-tracking in weightlifting. PloS ONE. 17(1):e0263224. doi: 10.1371/journal.pone.0263224.
- Norris BS, Olson SL. 2010. Concurrent validity and reliability of two-dimensional video analysis of hip and knee joint motion during mechanical lifting. Physiother Theory Pract. 27(7):521–530. doi: 10.3109/09593985.2010.533745.
- Payne RB. 1997. Method comparison: evaluation of least squares, Deming and passing/bablok regression procedures using computer simulation. Ann Clin Biochem. 34(3):319–320. doi: 10.1177/000456329703400317.
- Pérez DV, Martínez-Sanz JM, Ferriz-Valero A, Gómez-Vicente V, Ausó E. 2021. Relationship of limb lengths and body composition to lifting in weightlifting. Int J Env Res Pub He. 18(2):756. doi: 10.3390/ijerph18020756.
- RStudioTeam. 2020. RStudio: Integrated Development for R. 4.3.0. Boston: RStudio. http://www.rstudio.com/.
- Sammoud S, Nevill AM, Negra Y, Bouguezzi R, Chaabene H, Hachana Y. 2018. Allometric associations between body size, shape, and 100-m butterfly speed performance. J Sports Med Phys Fitness. 58(5):8. doi: 10.23736/S0022-4707.17.07480-1.
- Sandau I, Jentsch H, Bunk M. 2019. Realanalyzer HD - a real-time barbell tracking software for weightlifting. EWF Scientific Magazine. 5(3):8.
- Stone MH, Pierce KC, Sands WA, E SM. 2006. Weightlifting: a brief overview. Strength Cond J. 28(1):50–66. doi: 10.1519/00126548-200602000-00010.
- Stone MH, Sands WA, Pierce KC, Carlock J, Cardinale M, Newton RU. 2005. Relationship of maximum strength to weightlifting performance. Med Sci Sport Exerc. 37(6):1037–1043. http://europepmc.org/abstract/MED/15947731.
- Tucholke H. 1987. Theoretische Grundpositionen zur Einordnung der Struktur der sportlichen Leistung. In Die Struktur der sportlichen Leistung im Gewichtheben, 66. Leipzig: DHfK.
- Ungerer JPJ, Pretorius CJ. 2018. Method comparison – a practical approach based on error identification. Clin Chem Lab Med. 56(1):1–4. doi: 10.1515/cclm-2017-0842.
- Weir JP. 2005. Quantifying test-retest reliability using the intraclass correlation coefficient and the SEM. J Strength Cond Res. 19(1):231–240. doi: 10.1519/00124278-200502000-00038.
- Zult T, Allsop J, Tabernero J, Pardhan S. 2019. A low-cost 2-D video system can accurately and reliably assess adaptive gait kinematics in healthy and low vision subjects. Sci Rep. 9(1):18385. doi: 10.1038/s41598-019-54913-5.