
 ?Mathematical formulae have been encoded as MathML and are displayed in this HTML version using MathJax in order to improve their display. Uncheck the box to turn MathJax off. This feature requires Javascript. Click on a formula to zoom.
ABSTRACT
Digital volume correlation (DVC) is a technique for measuring 3D, internal displacements and strains in loaded structures. One application of DVC is the study of internal bone mechanics and the validation of subject-specific finite element (FE) models. While micro-computed tomography (µCT) is a common choice for DVC studies of small samples of bone, long human bones such as the tibia may exceed the spatial limitations of conventional µCT. High resolution peripheral quantitative CT (HR-pQCT) scanners, with their large bore and open-ended design, may be a viable option for long-bone DVC. However, HR-pQCT is afflicted by stitching artefacts, caused by the stacking of scan blocks to form the large scan volume, resulting in erroneous steps in DVC displacements and bands of increased strain error. This study proposed a modified HR-pQCT scanning protocol and stitching methodology to mitigate the effects of stitching artefacts on DVC measurements of displacement and strain. With the application of the proposed scanning/stitching methodology, displacements greater than 11.7µm (0.29 voxels) and strains greater than 1633µε could be repeatedly measured by DVC. These results show that HR-pQCT combined with DVC is suitable for measuring internal bone displacements in long human bones with sub-voxel precision and strains greater than 1633µε.
1. Introduction
Digital volume correlation (DVC) is a 3D extension of digital image correlation, allowing researchers to non-invasively measure displacements and strains inside heterogenous materials by comparing volumetric datasets of structures before and after deformation (Bay et al. Citation1999; Smith et al. Citation2002). Numerous studies have used DVC to investigate the internal mechanics of externally loaded bone (Tozzi et al. Citation2014; Chen et al. Citation2017; Kusins et al. Citation2019); its complex microarchitecture providing visual texture makes it an ideal material for DVC analyses.
Traditionally, micro-computed tomography (µCT) has been the imaging modality of choice for DVC studies, due to its high resolution, excellent signal-to-noise ratio (SNR) and prevalence in research labs worldwide. The displacement and strain precision of µCT-based DVC (µCT-DVC) is well studied, with reported precision values (measured as the standard deviation of the displacement field or strain for consecutive scans of an unstrained sample) below 0.05 voxels and 350 microstrain (µε), respectively (Zauel et al. Citation2006; Liu and Morgan Citation2007; Tozzi et al. Citation2017). Cabinet and desktop µCT systems have a small, closed design which imposes strict experimental constraints. The loading rigs for deforming samples take up space, limiting most µCT-DVC studies to small specimens such as excised bone cores/cubes (Zauel et al. Citation2006; Chen et al. Citation2017) or small animal bones (Oliviero et al. Citation2018). Longer human specimens, such as the proximal femur, have been successfully studied with DVC using synchrotron µCT (SR-µCT) (Martelli et al. Citation2021), which has high resolution and SNR, however its low availability and high complexity can make study design and data collection challenging. Conventional clinical CT has also been utilised for DVC analysis of the human proximal femur (Ridzwan et al. Citation2018). Fast scan acquisition and large imaging field make clinical CT an attractive option, though its coarse voxel size severely limits the spatial resolution of the resulting displacement/strain fields. Clinical high resolution peripheral quantitative CT (HR-pQCT) scanners present an interesting alternative. HR-pQCT is more readily available than synchrotron beamtime, has a higher resolution than clinical CT, and the large diameter, open-ended bore can accommodate longer specimens than cabinet/desktop µCT, as well as the equipment necessary to deform them. If sufficiently accurate, HR-pQCT-based DVC could be used to study the internal bone mechanics of long human bones such as the tibia or femur and validate subject-specific finite element models that are relevant to musculoskeletal diseases like osteoarthritis and osteoporosis. However, compared to µCT, HR-pQCT has a larger voxel size (41–82 µm) and poorer image quality as it prioritises fast scan acquisition and low radiation dose.
When imaging regions are longer than the detector, HR-pQCT scans exhibit an additional artefact: image discontinuities or ‘stitching artefacts’ are caused by the stacking of sequentially acquired scan blocks with slight misalignment, due to positioning errors in the scanner stepper motors (Kroker et al. Citation2017; Rapagna et al. Citation2019). The magnitude of these artefacts is inconsistent from one set of adjoining blocks to the next, and their effects manifest as discrete steps in the displacement field and narrow bands of increased strain error at the scan block boundaries. A few studies have utilised HR-pQCT for DVC (Basler et al. Citation2011; Rapagna et al. Citation2019), reporting displacement precision below 0.1 voxels and strain precision below 500µε. However, the analyses in these studies were primarily limited to small regions comprising one scan block, which avoided scan stitching artefacts. It is expected that the measurement error of DVC in analyses spanning multiple scan blocks will be higher. It should be noted that the practice of acquiring large scans as a sequence of stitched, smaller scans is shared by µCT and SR-µCT (Martelli and Perilli Citation2018), though the impact of the stitching process on DVC measurements has not been investigated in detail. While HR-pQCT may be one of the few viable options for studying internal bone mechanics in long human bones, further investigation is required to evaluate and mitigate the effects of stitching artefacts.
The primary objective of this study was to establish a method for HR-pQCT scan acquisition and subsequent image processing that permits DVC measures of internal bone displacement in long bones with sub-voxel displacement precision and strain errors similar to those previously reported for µCT. The secondary objective was to investigate the effects of image denoising methods on displacement and strain accuracy/precision.
2. Materials and methods
2.1 Specimen preparation and HR-pQCT scanning
Five formalin-fixed cadaveric knee joints (one female and three male donors; mean age: 80.2 years; standard deviation: 14.1 years) were obtained from the University of Saskatchewan Anatomy and Cell Biology Bequeathal Program. No information was provided on the cause of death or medical history of the individuals. The tibia was first separated from each joint and cleaned of soft tissue. Next, the bone was placed in a jig and a hand saw was used to cut the shaft transversely at a length of 10 mm (measured from the most-proximal end). The distal end of the bone was potted in PVC to a depth of 40 mm with dental cement (Denstone, Modern Materials Inc. USA), leaving 60 mm of the proximal bone exposed for imaging. All procedures were approved by the University of Saskatchewan Biomedical Research Ethics Board (Bio 09–96).
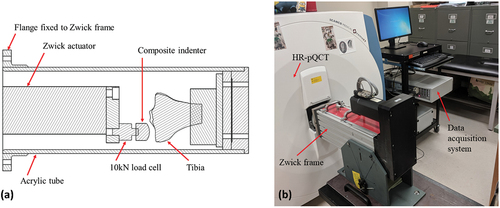
A custom, radiolucent loading rig was used to hold the specimens during image acquisition (). The loading rig consisted of a machined acrylic tube attached to a 10 kN electromechanical actuator (Zwick Z010, ZwickRoell, Germany) to allow for remote load application. With the rig inserted into the bore of a HR-pQCT scanner (XtremeCT, Scanco Medical AG, Switzerland) (), a small preload was applied to the medial compartments using displacement control with a 50N target. Load was applied via a custom composite indentor mimicking the femoral condyle. The displacement was held for the duration of the experiment to limit specimen motion during imaging. A 15-minute wait was imposed prior to imaging to allow for load relaxation and equilibrium to occur.
Figure 1. (a) Cross-section of the custom offset loading rig with a specimen inserted, (b) loading rig attached to the Zwick actuator frame and inserted into the HR-pQCT scanner bore.
Two successive scans were acquired for each specimen using the HR-pQCT’s high-resolution mode with an isotropic voxel size of 41 µm (60kV tube voltage, 1 mA tube current, 300 ms integration time, 3072 × 3072 pixel image matrix), capturing a region approximately 65 mm in length (~1600 slices, ~7 stacks). The spatial resolution (10% MTF) at this voxel size is expected to be approximately 88 µm (Tjong et al. Citation2012). To eliminate stitching artefacts that occur in long HR-pQCT scan volumes with the standard scanning protocol, a custom imaging protocol was employed. Large-volume scans were acquired as a series of 220-slice scan blocks, each overlapping by 20 slices, using a custom OpenVMS DCL script. No repositioning or additional loading occurred for the entire duration of scanning for each specimen. This condition is termed ‘zero-strain’, as although the initial preload will impose a small strain field on the specimen, there is no applied deformation between subsequent scans. Due to inaccuracies in the scanner stepper motors as well as equipment vibration, the true displacement field in this case is expected to be non-zero, with all points in the specimen displaced by the same amount, while the true strain will be zero for all points. This allows estimation of the precision and accuracy for DVC-measured strains, but only precision for displacements, due to the unknown true displacement (Bay et al. Citation1999).
Due to limited availability of the HR-pQCT scanner as well as the server time to reconstruct the tomographic projections of the large scan volumes, repeated scans of the five tibiae were only acquired using the custom imaging protocol described above. For the purposes of comparison with the standard HR-pQCT protocol, two zero-strain scans were acquired for a single 40 × 40 x 28 mm cube of synthetic trabecular bone analogue (closed-cell polyurethane foam, solid fraction ~17%) (Sawbones, USA) using the same mechanical testing apparatus and scanning parameters described above, but with the XtremeCT’s default scanning protocol. This protocol constructed the final scan volume by acquiring successive, non-overlapping 220-slice scan blocks (a total of 4) and merging them together using positioning data from the scanner stepper motors.
2.3 Scan stitching
Reconstruction of the tomographic projections was performed on the scanner workstation, using Scanco’s proprietary reconstruction software with beam hardening correction enabled. After reconstruction, all scan blocks were transferred to a desktop workstation for further processing in MATLAB (R2018a, MathWorks, USA) where the overlapping blocks comprising the tibia scans were stitched together using a custom image registration script (Supplemental Material). Prior to stitching, each scan block was processed using a wavelet-FFT correction method to remove ring artefacts (Munch et al. Citation2009). Next, optimal rigid-body translations between overlapping blocks were determined using a robust image registration routine. For each scan block, the first 30 slices were registered to the last 30 slices of the preceding block. First, the regions to be registered were convolved with a Gaussian filter of SD = 1.25 for noise suppression. Next, the whole-integer misalignment was determined by the location of maximum phase correlation using the fast Fourier transform (FFT) (Kuglin and Hines Citation1975). To achieve sub-voxel accuracy, a multiscale registration was then performed. At each registration scale, the regions being registered were resized to a fraction of their original dimensions, and the best sub-voxel shift to align the two regions was identified using the Nelder-Mead simplex optimisation method (Nelder and Mead Citation1965) with a tricubic interpolation when shifting the regions. Only translational degrees of freedom (x, y, z) were considered. The objective function for optimisation was the zero-mean normalised cross-correlation coefficient:
where and
are individual voxels of the fixed and translated image regions, respectively,
and
are the arithmetic mean of those image regions, and
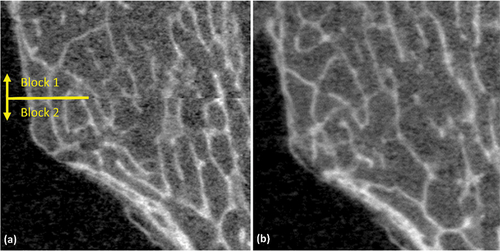
is the number of voxels in each image region. The shift from FFT was used as a starting point for the multiscale registration, and each subsequent registration scale used the shift identified by the previous. Registration scales of 50, 75 and 100% (no resizing) were used. Finally, after identifying the optimal shifts, the registered blocks were stitched together using linear alpha-weighted blending to combine overlapping regions (). The two scans of the synthetic bone cube did not require this stitching procedure, as their full scan length was assembled from their constituent 9.02 mm scan blocks as part of the standard imaging protocol.
Figure 2. Multi-block scans acquired (a) using the standard scanning procedure, and (b) using the modified scanning procedure. The seam between blocks is visible in the standard procedure, but essentially disappears with the modified protocol.
For a set of virtually translated image blocks (1.5 voxels in each direction), the multi-scale registration was able to estimate the translation within 0.01 voxels of the true value. It is important to note that this test provided a near best-case scenario, as the effects of image noise were not considered.
2.4 Image post processing
To investigate the effects of noise filtering on DVC errors, several noise reduction methods were tested on the stitched HR-pQCT tibia scans: a median filter; a bilateral filter; non-local means (NLM) denoising (Buades et al. Citation2005); and total variation denoising (TVD) (Chambolle Citation2004). All methods were implemented in MATLAB, with the filter parameters qualitatively selected to achieve balance between noise reduction and minimal blurring of the edges of trabecular/cortical bone (). Prior to use with DVC, the 16-bit signed images were converted to 8-bit unsigned values to reduce storage. Values below or above specified cut-offs (0 and 1350 mgHA/cm3 equiv.) were set to 0 and 255, respectively, while values between the cut-offs were scaled linearly to maximise contrast between the bone and the surrounding marrow/air (Bay et al. Citation1999). The upper and lower cut-offs were selected to cover the full range of grey values present in the imaged bone, with all specimens tested covering approximately the same range.
Table 1. Parameters used for denoising of HR-pQCT images prior to displacement field measurement with DVC.
2.5 Digital volume correlation
Displacement and strain fields were obtained for each set of zero-strain scans (all five tibia specimens and the synthetic bone cube) using DaVis 10.0 (LaVision GmbH, Germany), a commercial DVC programme utilising a local correlation approach. The method works by dividing the reference (first) image volume into many individual regions (subvolumes), cubic or spherical, each centred at a desired measurement site. For each subvolume, its location in the target (second) image volume is identified by finding the shift that maximises its zero-mean normalised correlation coefficient (Pena Fernandez et al. Citation2018). The DaVis software iteratively refines the displacement field by correlating with successively smaller subvolumes, using the displacement field from the previous step as an initial guess for the current one. At a given subvolume size, DaVis’ multipass algorithm, a predictor-corrector method, can be used to further decrease measurement error (Tozzi et al. Citation2017; Pena Fernandez et al. Citation2018). First, for a given subvolume in the reference image, the shift that maximises its cross-correlation in the target image is identified, termed the predictor. Next, the predictor displacements are used to deform the target image volume back to approximate the reference. The optimal shift between subvolumes in the reference image and the deformed target are once-again estimated, and this shift (the corrector) is added to the predictor to obtain a refined measurement of the displacement field. From the final displacement field, the strain field is calculated using a centred finite difference scheme.
For the present study, an initial displacement field was estimated using FFT with a subvolume edge length of 128 voxels, which was then refined to sub-voxel precision via cubic subvolume widths of 128, 96, and 64 voxels, followed by a Gaussian-weighted spherical subvolume with a 48-voxel diameter.
2.6 Statistical analysis
Points with a mean bone volume fraction less than 1% were discarded from further analysis to exclude subvolumes containing only air or marrow. Here bone volume fraction was determined for each DVC measurement point by placing a cubic stencil at the centre of the measurement point, calculating the average bone mineral density (BMD), and dividing by the BMD of fully mineralized bone (assumed to be 1200 mgHA/cm3). In addition, any DVC sample points with a normalised cross-correlation coefficient less than 0.75 were discarded (Dall’ara and Tozzi Citation2022). For all datasets tested, the correlation coefficient threshold discarded less than 0.25% of measurement points. The discarded points corresponded to image artefacts, regions containing the uniform-intensity indenter, and some points on the bone surface.
The displacement measurement precision of DVC was estimated by the standard deviation of each displacement component (x, y, z) for each zero-strain DVC dataset (Bay et al. Citation1999; Verhulp et al. Citation2004). Each displacement field contained approximately 100,000 points. The pooled precision for each displacement component was calculated as the root-mean-square standard deviation (SDrms):
where SDi is the zero-strain SD of specimen i and n is the number of specimens (n = 5). Least significant change (LSC), calculated as 2.77×SDrms (Bonnick et al. Citation2001), was used to estimate the minimum displacement measurable with 95% confidence. It is important to note that the quantification of displacement precision using the standard deviation assumes that the displacements consist of only rigid translations. The presence of rigid rotations will result in a spreading of the measured displacements and an overestimation of the precision.
The strain accuracy and precision were estimated for each DVC dataset using the mean absolute error (MAER) and standard deviation of the error (SDER) of the strain fields, respectively (Liu and Morgan Citation2007; Palanca et al. Citation2016):
where is the c-th component of strain for the i-th measurement point and
is the total number of measurement points. Similar to displacement precision, the pooled MAER and SDER (referred to as MAERrms and SDERrms, respectively) were calculated as the root-mean square of the per-specimen values. The LSC of the strain precision (SDERrms) was also calculated.
In addition to the quantifying the displacement and strain precision/accuracy for the tibia datasets, both the tibia and synthetic bone cube DVC datasets were analysed quantitatively by inspecting the measured displacement and strain fields for areas of increased measurement error, particularly at the boundaries of the HR-pQCT scan blocks. The respective displacement/strain histograms were also analysed qualitatively in order to relate observations made about the displacement/strain fields with properties of their histograms.
3. Results
For the unfiltered HR-pQCT scans of the tibiae, the DVC displacement SDrms was 3.63 µm, 3.75 µm, and 4.21 µm (~0.10 voxels) in the x, y, and z directions, respectively, corresponding to LSCs of 10.0 µm, 10.4 µm, and 11.7 µm (). The MAERrms and SDERrms were 527µε and 589µε, respectively, corresponding to an LSC of 1633µε for the SDER. The application of various denoising filters during image pre-processing had little effect on the pooled displacement precision, with SDrms ranging from 3.53 to 3.63 µm in the x-direction (medial-lateral), 3.68–3.75 µm in the y-direction (anterior-posterior), and 4.11–4.24 µm in the z-direction (inferior-superior) (). Strains were also only marginally affected by image filtering, with MAERrms and SDERrms ranging from 505 to 529 µε and 569–589 µε, respectively.
Table 2. Pooled zero-strain DVC displacement precision in each coordinate direction and corresponding strain accuracy (MAER) and precision (SDER) for various noise filtering techniques. Root-mean-square standard deviation of displacements (SDrms) is reported in µm, and root-mean-square MAER and SDER are reported in µε. The corresponding least significant change (LSC) for displacement and strain precision (SDER) is in parentheses.
The measurement error varied considerably between specimens, with displacement precision ranging from 2.30 to 5.20 µm and strain accuracy and precision ranging from 461–694µε and 467–792µε, respectively (). Both displacements and strains also exhibited greater sensitivity to image filtering at a per-specimen level. Displacement precision for some specimens marginally improved with filtering, while for others it worsened. Per-specimen, these changes were not consistent across all coordinate directions, with some coordinate directions affected more than others, and the degree as well as direction of change varied per filtering method. For strain accuracy and precision, some specimens benefitted more than others from filtering. Compared to displacements, image filtering more consistently improved strain accuracy/precision, though overall the improvements were minor.
Table 3. Per-specimen zero-strain DVC displacement precision in each coordinate direction and corresponding strain accuracy (MAER) and precision (SDER) for various noise filtering techniques. Root-mean-square standard deviation of displacements (SDrms) is reported in µm, and root-mean-square MAER and SDER are reported in µε.
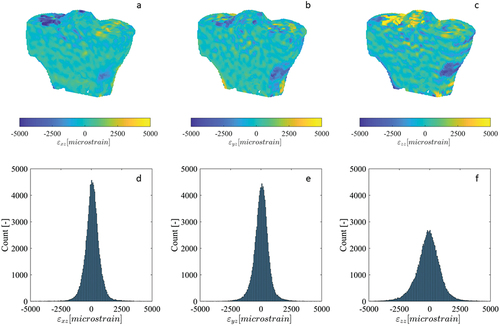
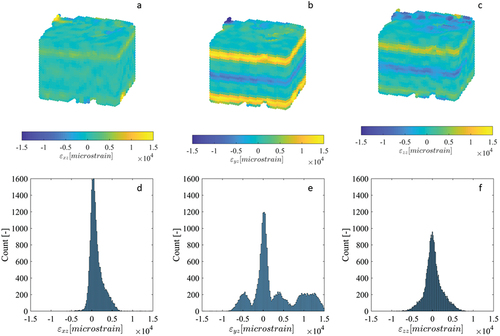
Some histograms of the zero-strain displacement fields of the tibia specimens were multimodal, representing multiple superimposed Gaussian distributions with peaks separated by less than 5 µm (), while the histograms for other displacement components were unimodal (). The displacement fields corresponding to the multimodal histograms had clear step transitions at the junctions of the adjacent scan blocks where stitching occurred (), with the magnitude of the steps approximately equal to the separation of the peaks in the histogram. Displacement fields with unimodal histograms did not exhibit these step transitions. The largest magnitude displacements were located at/near the bone surface (), where the DVC subvolumes partially enclosed air in addition to bone. Contrary to the displacements, all strain histograms were unimodal, with only a single distinct peak (). The strain fields for select components exhibited subtle, narrow bands of increased error at the scan block boundaries (), though their magnitude was similar to localised error increases in regions inside the bone and distant from the surface. Other strain fields had no discernible banding (). Like with the displacements, the largest magnitude strains were located at/near the bone surface. The displacement and strain histograms were visually similar for the different image filtering methods, with no distinct changes in shape, number of peaks, or the location of peaks, and therefore are not presented. The corresponding displacement and strain fields were also visually similar between the different image filtering methods, with the regions of greatest difference localised to small areas predominantly on the bone surface where the displacement/strain magnitude was largest.
Figure 3. Cross-sections of the displacement fields (a-c) measured by DVC for the x, y and z components of the repeated scan dataset for human tibia specimen 3, as well as their corresponding histograms (d-f). The image dataset was acquired using the modified HR-pQCT scanning procedure, as a sequence of overlapping scan blocks subsequently registered and stitched together.
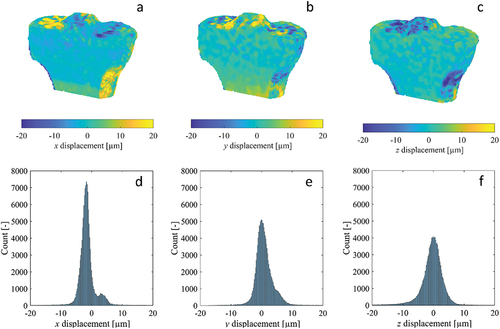
Figure 4. Cross-sections of the strain fields (a-c) (calculated from DVC displacement fields) for the εxy, εyz and εzz components of the repeated scan dataset for human tibia specimen 3, as well as their corresponding histograms (d-f). The image dataset was acquired using the modified HR-pQCT scanning procedure, as a sequence of overlapping scan blocks subsequently registered and stitched together.
For the synthetic bone cube dataset (which was imaged using the standard XtremeCT scanning protocol), two of the three displacement histograms were multimodal, with many peaks separated by distances exceeding 30 µm (). All displacement fields had clear step transitions at the scan block boundaries of varying degree (). The steps in displacements were most numerous and largest in magnitude in the y component, with multiple exceeding a full HR-pQCT voxel (41 µm). One of the strain histograms, corresponding to component εyz, had multiple distinct peaks separated by more than 5000µε (). Three of the strain fields, εxz, εyz and εzz (whose finite difference stencils would have sampled points separated in the z-direction) showed distinct bands of increased strain error, located at the scan block boundaries ().
Figure 5. Cross-sections of the displacement fields (a-c) measured by DVC for the x, y and z components of the repeated scan synthetic bone cube dataset, as well as their corresponding histograms (d-f). The image dataset was acquired using the standard HR-pQCT scanning procedure for large VOIs.
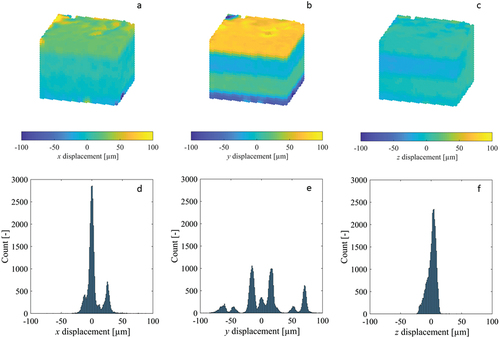
Figure 6. Cross-sections of the strain fields (a-c) (calculated from DVC displacement fields) for the εxy, εyz and εzz components of the repeated scan synthetic bone cube dataset, as well as their corresponding histograms (d-f). The image dataset was acquired using the standard HR-pQCT scanning procedure for large VOIs.
4. Discussion
This study evaluated the error of DVC displacement and strain measurements from zero-strain (undeformed), large-volume HR-pQCT scans. The effects of different image denoising methods on DVC error was also investigated. Our results indicate that HR-pQCT images (when acquired according to the revised imaging protocol and image stitching methodology outlined here), can be used with DVC to measure internal displacements in long bones with sub-voxel precision (~0.10 voxels) and strains with an accuracy of 527µε and precision of 589µε. Improvements in measurement error due to image denoising were minimal, suggesting that this step is unnecessary for the combination of imaging modality and DVC software used here.
The displacement precision reported here was one-tenth of a voxel, and strain accuracy/precision were one order of magnitude lower than the yield strain of bone (~7000µε (Morgan and Keaveny Citation2001)), indicating that the method is appropriate for the study of sub-voxel displacements, though its application to strains should be limited to strains beyond 1633µε, possibly only to the post-yield regime (Liu and Morgan Citation2007). These errors are higher than most reported in the literature for µCT-based DVC (Bay et al. Citation1999; Zauel et al. Citation2006; Liu and Morgan Citation2007; Tozzi et al. Citation2017), which is expected due to the superior spatial resolution and SNR of µCT. Two studies have reported DVC error estimates for HR-pQCT-based DVC (Basler et al. Citation2011; Rapagna et al. Citation2019); though, neither study addressed the inherent difficulties of using DVC with long scan volumes. The displacement RMSE measured by Basler et al. was 0.09 voxels, though these measures were based on virtually translated and deformed datasets rather than repeated scans, providing an unrealistic best-case scenario by eliminating errors from image noise, ring artefacts and stitching artefacts. Rapagna et al. reported displacement precision of 0.08 voxels and strain precision of 500µε, measured from repeated scans, though analysis was limited to small regions of interest (15 mm cubes), largely removing errors from stitching artefacts. Furthermore, the improved displacement and strain precision of the previous studies was likely influenced by their use of the second-generation HR-pQCT scanner and the standard scanning resolutions with 4 × 1 binning (four detector elements averaged for each pixel). To achieve a nominal isotropic voxel size of 41 µm, the first-generation HR-pQCT scanner used in this study was operated with the detector array performing 1 × 1 binning.
A modified scanning procedure was adopted for this study to reduce the stitching artefacts present in large-volume HR-pQCT scans. While visual misalignment at the block boundaries were effectively eliminated by the registration and stitching process (), small discontinuities persisted in some of the DVC-measured displacement fields, manifesting as visible stratification in the plotted fields () and multiple, separated peaks in their corresponding histograms (). These displacement steps resulted in bands of increased strain error, though their magnitude was similar to errors found in other regions within the bone and less than errors found on the surface (). In contrast, the synthetic bone scans acquired without the modified scanning procedure exhibited much more numerous and larger stitching artefacts, which translated to bands of dramatically increased strain. These observations are consistent with previous studies which noted stitching artefacts clearly visible in the reconstructed and segmented scans (Kroker et al. Citation2017; Rapagna et al. Citation2019). It is possible to mitigate the consequences of the bands of elevated strain error by constraining analyses within individual scan blocks, distant from the stitching boundaries (Rapagna et al. Citation2019), though this complicates analysis. The stratification of the displacement field poses a greater challenge for studies attempting to validate FE models, as these are most accurate when the boundary conditions are accurately replicated using displacements measured by DVC (Chen et al. Citation2017). The presence of significant stitching artefacts could introduce considerable error in the boundary conditions, resulting in a model that does not accurately reflect experimental conditions. Therefore, reducing the frequency and magnitude of these stitching artefacts is very important.
Within individual scan blocks, displacement and strain errors were normally distributed. The displacement SD was consistently highest in the z-direction (albeit by a small margin), followed by the y-direction and then the x-direction. The directional-dependance of the results may be due to the trabecular bone’s anisotropy, resulting in image texture that facilitates local registration more in some directions than others. Consistent with previous DVC studies investigating measurement error at the organ scale, the displacement and strain errors were found to increase at/near the surface of the specimen (Palanca et al. Citation2016; Tozzi et al. Citation2017), suggesting that care should be taken when interpreting results in these regions for deformed specimens. Also consistent with previous observations, the displacement and strain errors varied considerably per-specimen, highlighting the importance of performing a zero-strain check on all specimens when practical (Palanca et al. Citation2016).
Our findings regarding the lack of effect from image denoising on displacement precision agree with a previous study (Pena Fernandez et al. Citation2018). Despite improvements in overall image quality, denoising had little effect on the displacement error from DVC. Regarding strain precision, Pena Fernandez et al. found moderate improvements from image denoising for trabecular bone specimens, while the overall improvements observed here (after pooling specimens) were smaller. The relatively large subvolume size used here (48 voxels) made measurement more robust and less sensitive to image noise; displacement and strain measurements from smaller subvolumes are more likely to benefit from image denoising as they sample fewer neighbouring points and experience higher error (Palanca et al. Citation2015). Furthermore, denoising filters typically target random noise, while a large source of errors in the datasets here was the stitching artefacts. Therefore, any reductions in the errors associated with image noise are likely to pale in comparison to the remaining errors from the registration and stitching process. To remove such errors, post-processing of the DVC displacement fields may have potential, and requires further investigation. Incorporating advanced image denoising in the registration step of the stitching process, rather than after stitching, may also help to reduce these errors. It should be noted that although image denoising was found to have little effect on DVC measurements, there are other reasons to incorporate these filters in a study’s image processing methodology. For example, filters can improve the robustness of threshold-based image segmentation (Pena Fernandez et al. Citation2018), a prerequisite step for analysis of bone morphology, or for masking out the background prior to DVC analysis, a common preprocessing step which was not performed in this study (Dall’ara et al. Citation2014).
This study has several limitations that must be acknowledged. First, by only assessing the measurement error based on zero-strain scans, the estimates provided here represent a lower bound on the displacement and strain errors present in strained bone samples. However, a recent study suggests that in cases of moderate compressive strain, the error estimates provided by a simple zero-strain test are similar to DVC errors in strained samples (Comini et al. Citation2019). The specimens were also not repositioned between scans, though this is not expected to meaningfully influence the estimated precision compared to datasets where repositioning does occur (Dall’ara et al. Citation2014). Second, the HR-pQCT scanner used in this study was a first-generation XtremeCT, which is being phased out by its successor, the XtremeCT II. The second generation of HR-pQCT is better suited for DVC studies, accommodating larger specimens with a higher nominal resolution and improved SNR. It would be beneficial to repeat these tests with a XtremeCT II scanner using the scanning/stitching protocol proposed here. Third, the zero-strain scans acquired with the standard HR-pQCT imaging protocol, for comparison with the stitching approach proposed in this study, were for a single synthetic bone specimen, whose microstructure differs from that of real bone. The absolute value of displacement and strain errors is expected to vary depending on the bone morphology; however, the magnitude of the displacement steps at scan block transitions is a product of the HR-pQCT hardware, and will not depend on the particular specimen being imaged. Fourth, formalin-fixed specimens were used, rather than the gold standard of fresh-frozen. The effects on DVC outcomes is expected to be insignificant, as imaged trabecular bone morphology has been observed to be unaltered by fixation (Baum et al. Citation2015). Fifth, given that displacement and strain errors varied considerably per-specimen, it would have been useful to correlate errors with trabecular microstructure (e.g. bone volume fraction, trabecular bone volume fraction, trabecular spacing, trabecular number, trabecular thickness, etc), thereby providing researchers with a pre-emptive means of identifying specimens prone to high DVC errors. However, given our small sample (n = 5), we were underpowered for such an analysis. Accordingly, it would be prudent to repeat this study with a larger sample to derive relationships between DVC errors and microstructural parameters. That being said, there is a lack of agreement regarding the strength of these relationships in the literature, with some studies reporting a significant relationship between bone volume fraction and strain errors (Liu and Morgan Citation2007), while others report a much weaker one (Dall’ara et al. Citation2014; Palanca et al. Citation2015) or none at all (Cavazzoni et al. Citation2023). The relationships between DVC errors and other microstructural parameters have also been weak or non-existent (Cavazzoni et al. Citation2023). Sixth, to reduce storage, 16-bit signed images were converted to 8-bit unsigned images prior to use with DVC. This decision was made as this approach is a commonly applied technique with DVC studies (Bay et al. Citation1999), and because pilot tests indicated no meaningful change in the measured displacement fields when using the original 16-bit signed images versus converted 8-bit unsigned images. However, our pilot testing was not rigorous. Accordingly, it would be prudent to repeat this study using the original 16-bit signed data. Seventh, the registration approach used during image stitching was limited to three translational DOFs for simplicity. Including rotational DOFs during stitching may lead to further reductions in stitching artefacts and warrants future investigation.
In conclusion, this study investigates the precision and accuracy associated with DVC-measured displacements and strains in long scan volumes. With the application of a revised scanning protocol and image stitching methodology, HR-pQCT is a viable imaging modality for studying the internal mechanics of long bones with sub-voxel displacement precision and strain precision adequate for study beyond 1633µε. For the subvolume size tested (48 voxels), the local DVC approach is robust and does not benefit from image denoising prior to correlation.
Supplemental Material
Download Text (7.4 KB)Acknowledgements
We would like to thank all study donors who bequeathed their bodies for medical science. We wish to acknowledge Rob Peace for assistance with mechanical testing. The authors also acknowledge the Natural Sciences and Engineering Research Council (NSERC) (Discovery Grant RGPIN-2016-05301 (SAK) and RGPIN-2015-06420 (JDJ)) for funding support. The authors have no professional or financial affiliations that may have biased this study.
Disclosure statement
No potential conflict of interest was reported by the author(s).
Supplemental material
Supplemental data for this article can be accessed online at https://doi.org/10.1080/21681163.2024.2313871
Additional information
Funding
Notes on contributors
Dylan E Zaluski
Dylan E Zaluski (MSc) is a graduate of the Department of Mechanical Engineering at the University of Saskatchewan. His expertise pertains to image processing, mechanical testing and finite element modelling.
Saija A Kontulainen
Saija A Kontulainen (PhD) is a Professor with the College of Kinesiology as well as the Division of Biomedical Engineering at the University of Saskatchewan. Her research interests are focused on bone and joint health as well as fracture prevention across the life span. Her expertise pertains to musculoskeletal imaging, musculoskeletal health, as well as growth and development.
James D Johnston
James D Johnston (PhD) is a Professor with the Department of Mechanical Engineering as well as the Division of Biomedical Engineering at the University of Saskatchewan. His research interests are focused in the areas of orthopaedic biomechanics and musculoskeletal imaging, with an emphasis on investigating links between mechanics and musculoskeletal disease and injury. His expertise pertains to image processing, mechanical testing and finite element modelling.
References
- Basler SE, Mueller TL, Christen D, Wirth AJ, Muller R, van Lenthe GH. 2011. Towards validation of computational analyses of peri-implant displacements by means of experimentally obtained displacement maps. Comput Methods Biomech Biomed Engin. 14(2):165–11.
- Baum T, Grande Garcia E, Burgkart R, Gordijenko O, Liebl H, Jungmann PM, Gruber M, Zahel T, Rummeny EJ, Waldt S, et al. 2015. Osteoporosis imaging: effects of bone preservation on MDCT-based trabecular bone microstructure parameters and finite element models. BMC Med Imaging. 15:22.
- Bay BK, Smith TS, Fyhrie DP, Saad M. 1999. Digital volume correlation: three-dimensional strain mapping using X-ray tomography. Exp Mech. 39(3):217–226.
- Bonnick SL, Johnston CC, Kleerekoper M, Lindsay R, Miller P, Sherwood L, Siris E. 2001. Importance of precision in bone density measurements. J Clin Densitom. 4(2):105–110.
- Buades A, Coll B, Morel JM. 2005. A non-local algorithm for image denoising. 2005 IEEE Computer Society Conference on Computer Vision and Pattern Recognition; San Diego, CA, USA (CVPR’05).
- Cavazzoni G, Cristofolini L, Dall’ara E, Palanca M. 2023. Bone metastases do not affect the measurement uncertainties of a global digital volume correlation algorithm. Front Bioeng Biotechnol. 11:1152358.
- Chambolle A. 2004. An algorithm for total variation minimization and applications. J Math Imaging Vis. 20(1):89–97.
- Chen Y, Dall’ara E, Sales E, Manda K, Wallace R, Pankaj P, Viceconti M. 2017. Micro-CT based finite element models of cancellous bone predict accurately displacement once the boundary condition is well replicated: a validation study. J Mech Behav Biomed Mater. 65:644–651. doi: 10.1016/j.jmbbm.2016.09.014.
- Comini F, Palanca M, Cristofolini L, Dall’ara E. 2019. Uncertainties of synchrotron microCT-based digital volume correlation bone strain measurements under simulated deformation. J Biomech. 86:232–237.
- Dall’ara E, Barber D, Viceconti M. 2014. About the inevitable compromise between spatial resolution and accuracy of strain measurement for bone tissue: a 3D zero-strain study. J Biomech. 47(12):2956–2963.
- Dall’ara E, Tozzi G. 2022. Digital volume correlation for the characterization of musculoskeletal tissues: Current challenges and future developments. Front Bioeng Biotechnol. 10:1010056.
- Kroker A, Zhu Y, Manske SL, Barber R, Mohtadi N, Boyd SK. 2017. Quantitative in vivo assessment of bone microarchitecture in the human knee using HR-pQCT. Bone. 97:43–48. doi: 10.1016/j.bone.2016.12.015.
- Kuglin CD, Hines DC. 1975. The phase correlation image alignment method. IEEE Conference on Cybernetics and Society; New York, NY, USA. p. 163–165.
- Kusins J, Knowles N, Ryan M, Dall’ara E, Ferreira L. 2019. Performance of QCT-Derived scapula finite element models in predicting local displacements using digital volume correlation. J Mech Behav Biomed Mater. 97:339–345.
- Liu L, Morgan EF. 2007. Accuracy and precision of digital volume correlation in quantifying displacements and strains in trabecular bone. J Biomech. 40(15):3516–3520.
- Martelli S, Giorgi M, Dall’ Ara E, Perilli E. 2021. Damage tolerance and toughness of elderly human femora. Acta Biomater. 123:167–177.
- Martelli S, Perilli E. 2018. Time-elapsed synchrotron-light microstructural imaging of femoral neck fracture. J Mech Behav Biomed Mater. 84:265–272.
- Morgan EF, Keaveny TM. 2001. Dependence of yield strain of human trabecular bone on anatomic site. J Biomech. 34(5):569–577.
- Munch B, Trtik P, Marone F, Stampanoni M. 2009. Stripe and ring artifact removal with combined wavelet–Fourier filtering. Opt Express. 17(10):8567–8591.
- Nelder JA, Mead R. 1965. A simplex method for function minimization. Comput J. 7(4):308–313. doi: 10.1093/comjnl/7.4.308.
- Oliviero S, Giorgi M, Dall’ara E. 2018. Validation of finite element models of the mouse tibia using digital volume correlation. J Mech Behav Biomed Mater. 86:172–184.
- Palanca M, Cristofolini L, Dall’ara E, Curto M, Innocente F, Danesi V, Tozzi G. 2016. Digital volume correlation can be used to estimate local strains in natural and augmented vertebrae: An organ-level study. J Biomech. 49(16):3882–3890.
- Palanca M, Tozzi G, Cristofolini L, Viceconti M, Dall’ara E. 2015. Three-dimensional local measurements of bone strain and displacement: comparison of three digital volume correlation approaches. J Biomech Eng. 137(7):071006.
- Pena Fernandez M, Barber AH, Blunn GW, Tozzi G. 2018. Optimization of digital volume correlation computation in SR-microCT images of trabecular bone and bone-biomaterial systems. J Microsc. 272(3):213–228.
- Rapagna S, Berahmani S, Wyers CE, van den Bergh JPW, Reynolds KJ, Tozzi G, Janssen D, Perilli E. 2019. Quantification of human bone microarchitecture damage in press-fit femoral knee implantation using HR-pQCT and digital volume correlation. J Mech Behav Biomed Mater. 97:278–287.
- Ridzwan MIZ, Sukjamsri C, Pal B, van Arkel RJ, Bell A, Khanna M, Baskaradas A, Abel R, Boughton O, Cobb J, et al. 2018. Femoral fracture type can be predicted from femoral structure: A finite element study validated by digital volume correlation experiments. J Orthop Res. 36(3):993–1001.
- Smith TS, Bay BK, Rashid MM. 2002. Digital volume correlation including rotational degrees of freedom during minimization. Exp Mech. 42(3):272–278. doi: 10.1007/BF02410982.
- Tjong W, Kazakia GJ, Burghardt AJ, Majumdar S. 2012. The effect of voxel size on high-resolution peripheral computed tomography measurements of trabecular and cortical bone microstructure. Med Phys. 39(4):1893–1903.
- Tozzi G, Dall’ara E, Palanca M, Curto M, Innocente F, Cristofolini L. 2017. Strain uncertainties from two digital volume correlation approaches in prophylactically augmented vertebrae: local analysis on bone and cement-bone microstructures. J Mech Behav Biomed Mater. 67:117–126.
- Tozzi G, Zhang QH, Tong J. 2014. Microdamage assessment of bone-cement interfaces under monotonic and cyclic compression. J Biomech. 47(14):3466–3474.
- Verhulp E, van Rietbergen B, Huiskes R. 2004. A three-dimensional digital image correlation technique for strain measurements in microstructures. J Biomech. 37(9):1313–1320.
- Zauel R, Yeni YN, Bay BK, Dong XN, Fyhrie DP. 2006. Comparison of the linear finite element prediction of deformation and strain of human cancellous bone to 3D digital volume correlation measurements. J Biomech Eng. 128(1):1–6.