
 ?Mathematical formulae have been encoded as MathML and are displayed in this HTML version using MathJax in order to improve their display. Uncheck the box to turn MathJax off. This feature requires Javascript. Click on a formula to zoom.
ABSTRACT
Diabetes is a fast-developing medical issue that causes most renal and cardiac illnesses. Thus, diabetes management requires regular glucose monitoring. One potential technology is non-invasive glucometer monitoring. This work aims to develop a user-friendly near-infrared sensor-based non-invasive glucose monitoring system, correlating sensor output voltage variations with glucose levels, to provide accurate and convenient glucose monitoring for diabetes management. The objective is to validate the system’s accuracy against existing fingerpick methods and analyze its performance across different age groups and food intake conditions through experimental testing and Clarke grid analysis. In our research, we propose a near-infrared sensor-based non-invasive-type glucose monitoring technique which is a user-friendly system. The experimental setup and prototype system are designed and implemented for measuring the variation of glucose level with respect to a sensor output voltage. Using Beer Lambert’s law, the established results correlated the absorbance property of light with the sample concentration level. Demonstration of testing for different aged people was done under various food intake conditions. The obtained results are tabulated and validated with the existing fingerpick method and achieved an accuracy of 97.8%. Also, Clarke grid analysis has been done and depicted the pattern obtained.
1. Introduction
In this contemporary world, diabetes has become a common metabolic disorder where the blood glucose concentration is abnormal (Peng et al. Citation2022). It occurs when our body does not produce effective insulin. Over half of the Indian population is supposed to have diabetes with estimated 77 million individuals in 2019, which is alarmingly supposed to reach almost 140 million around 2050 (Pradeepa and Mohan Citation2021). In this urbanisation period, sedentary habitual life increases social stress which also leads to the risk of diabetes. Hence, diabetes is an escalating medical problem with life risk factors which has to be viewed seriously and research is blooming to tackle the complications.
Type I and type II and gestational are the categories of diabetes. Type 1 diabetes might be caused when there is a deficiency in secretion of insulin in the pancreas, which is an immunological disease (Notkins Citation2002). Here, the biological immunity network damages the beta cells in the pancreas. Type 2 occurs when the body is subjected to insulin resistance and sugar content develops in our blood (Vashist Citation2013). Genetic factors and lifestyle factors become the predominant cause of diabetes type 2. Gestational diabetes occurs during pregnancy period where the placenta in women creates insulin blocking hormones leading to high blood sugar levels. Diabetes can lead to adverse complications such as cardiovascular, neurological and retinopathy health problems. It can also lead to hearing loss, foot infections with sores, skin prone to bacterial infections and depression and dementia.
Various medications are available to treat diabetes including insulin injections, diet charts, exercise plans, and so on. Despite all this, once diabetes is diagnosed, health care monitoring becomes routine, and in specific, self-testing of blood sugar levels at frequent times in a day would be mandatory to track the progress of treatment irrespective of age and type of diabetes. Traditionally, blood sugar levels are determined invasively either by using a Blood Drawn Test (BDT) or finger stick blood test. In BDT, a large volume of blood is collected from the subject using a syringe in the test lab, and then by adding a reagent, the blood glucose concentration is measured. Whereas the finger stick method (Haxha and Jhoja Citation2016) collects blood samples by pricking the finger and determining the glucose level in the blood. In the glucose monitoring phase, the patient has to prick their finger at frequent intervals in a day which creates pain, hurt, tissue damage and also skin punctures.
In the Continuous Glucose Monitoring (CGM) method, the sensor with transmitter and receiver determines interstitial fluid rather than the bloodstream (Klonoff Citation2007). It also requires twice fingerpricks per day for accurate CGM measurement. Stress before blood collection, pain suffered by patients, risk of external environmental infection, and irritation are major issues in invasive methods. In addition, the strip used for the fingerprick method may show inaccurate results due to improper storage of the strip and when exposed to external environmental factors. In underdeveloped countries, disposable needles are reused due to the expensive cost of needles.
Hence, research interest focuses on non-invasive techniques to detect glucose levels without creating much damage to human tissues. Various non-invasive methods include optical glucose monitoring methods, fluid sampling, microwave methods, and minimally invasive and electrochemical methods. Optical methods ranging in the near-infrared (NIR, 680–2500 nm) have a great contribution to blood glucose detection, where light can penetrate body fluids and soft tissues for less than 0.05 cm, whose scattering ability is less than the ultraviolet or visible light range and also measured by both reflection and transmission sensing nature (Tang et al. Citation2020).
2. Related work
In this research work (Sridevi et al. Citation2021) they have used light-emitting diode of about 940 nm along with a photodiode for the non-invasive technique. To verify the sensitivity of the device, a vitro test was done in different glucose concentrations which were performed using an Easy Touch GCHb glucometer. The results show that voltage decreases with a rise in glucose level due to absorption of light intensity. In this paper (Saleh et al. Citation2018) authors have proposed near-infrared (NIR) transmittance spectroscopy to measure the amount of glucose content in the blood. Artificial mixing of sugar mixed with aqueous distiled water identified the glucose concentration by emulating the body region. The noise power level is reduced by notch filter usage, and correspondingly accuracy has been elevated. Collective optical signals are utilised to estimate glucose levels (Segman Citation2018) where tissue glucose concentration at the fingertip is predicted based on the colour image sensor.
Predicted the blood glucose from the subject’s wrist using a visible and near-infrared (Vis-NIR) optical-based wearable sensor (Rachim and Chung Citation2019). The voltage value is computed for four different channels of wavelength (950 nm, 850 nm, 660 nm, and 535 nm) for analysing the average correlation coefficient. The in vivo experiment was done using a limited number of 12 different subjects. The sensitivity and correlation coefficient for the different subjects is around 6.16 mg/dL and 0.86. In the research work [13], they conducted in-vitro experiments and in-vivo testing for glucose concentration identification. An infrared source of 940 nm is an illuminated ray of light with a PIN photodiode onto the human fingertip to detect the light transmitted. It has been evaluated by obtaining the correlation between output potential and glucose level.
In this paper (Althobaiti and Al-Naib Citation2021) it has been proposed that a dual channel near-infrared sensor at 1200 nm to 1900 nm is used to analyse the responsivity of the top and middle layers of skin (epidermis and dermis). The main aim of this analysis is to eliminate the interfering noisy signal from the skin’s top layer for accurately detecting the glucose content in the blood. A consumer-based wearable non-invasive device (iGLU 2.0) (Joshi et al. Citation2020) was used to measure serum glucose. For predicting serum glucose, polynomial regression and neural network were followed. The smart healthcare technique is adopted by linking the Internet of Medical Things framework with end users. In this paper (Li and Li Citation2015) authors proposed a monitoring system using glucose aqueous solutions in which a laser diode is a transmitter, and a light power probe (S302C) is a detector of the light source. It was found that a high correlation exists between glucose level and output power. In vitro testing of glucose samples was performed using a dilute solution and in vivo experiment was performed using a sensor patch over the forearm. The glucose concentration is extracted from the acquired data by adopting a suitable signal-processing technique for a limited number of subjects (Yadav et al. Citation2014).
In this review of numerous pieces of research, it has been found that signal-to-noise ratio has a great impact on near infrared-based glucose detection method as measurement site plays a key role which may be easily affected by external factors. Measurement tools have been deduced to be designed with great care to have high accuracy and proper sensitivity to have a good signal-to-noise ratio. Filtering can be performed to eliminate frequency-sensitive noises in the baseband optical signal. Also, the major challenge falls in the design of wearable devices to accurately measure blood serum glucose, which should also be applicable for various diabetic conditions.
From all the observed flaws and challenges, to tackle the problems stated, we propose a non-invasive measurement device to measure blood serum glucose by continuous means to provide data accurately. The process has been explained in detail in the following sections.
3. Methodology
In this article, two different approaches, namely the experimental approach and prototype system are presented to inspect the glucose level in the blood frequently. All methods were carried out in accordance with relevant guidelines and regulations. All experimental protocols were approved by Easwari Engineering College (NO. TH5684239) and also informed consent was obtained from all the participants.
4. Experimental setup
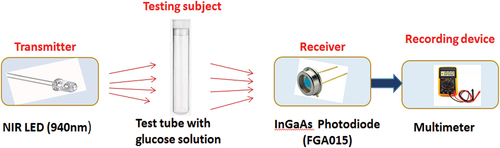
The complete workflow diagram for the experimental setup with glucose samples is shown in . If the light is incident on a material, a particular amount of passed beam gets consumed based on the concentration of the subject material. In the proposed methodology, the artificial mixing of aqueous distiled water with sugar helps to identify the glucose concentration by emulating the body region. A designed electrical circuit comprising NIR LED (940 nm wavelength) as a transmitter and the receiver is Avalanche photodiode (FGA015) of 940 nm wavelength. In the middle of the NIR LED and photodiode, a glucose solution is positioned. When the NIR LED transmits light, a portion of it is consumed by the liquid phantom. The receiver photodiode will spot the amount of transmitted light and develop an equivalent electrical current for the respective concentration of the glucose solution. The relationship between the glucose concentration and current is studied and analysed.
Figure 1. Experimental setup workflow diagram.
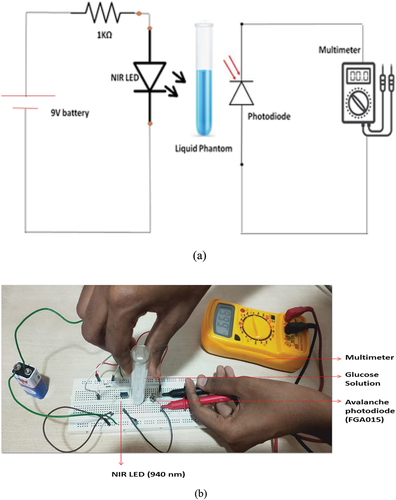
The accurate weight of the sugar is determined by the precise weight equipment (ELB300 PLATFORM BALANCE) is shown in . The complete experimental setup to identify the amount of current and its proportional voltage flow due to light absorbed by the sample is shown in .
Figure 2. Experimental setup (a) circuit diagram (b) experimental setup.
5. Prototype system
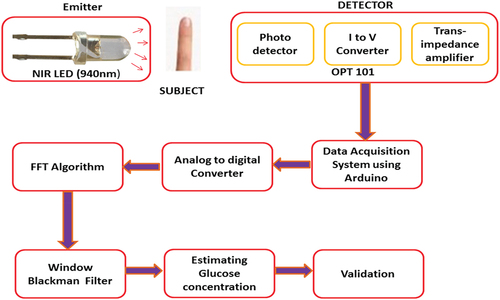
The complete workflow diagram for the blood glucose level monitoring system using the prototype system is shown in .
Figure 3. Workflow diagram for the blood glucose monitoring system.
5.1. Transmitter section
Initially, the source identification is crucial as the light incident on the subject should be properly intact with the fingertip. Also, tiny-sized with not much heavyweight type of light sources are preferred for illumination. The near-infrared wavelength of 940 nm is found to be optimal, which has the characteristics of diffusing into organic tissue without much absorption by other biological components present in human membranes like water, lipids, and proteins. The compound semiconductor Al GaAs would be the best choice for source base material which could radiate at the optimal wavelength in a range of 20 mW to 30 mW. To achieve the area coverage exactly in the penetration region, the LED is positioned at a right angle to the fingertip.
5.2. Receiver section
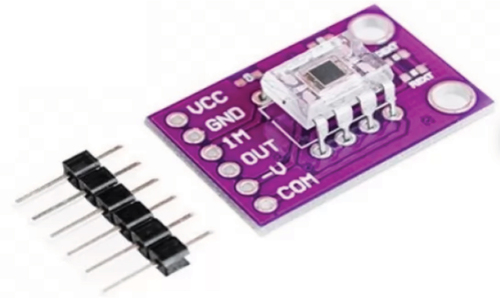
The transmitted light could pass through 0.4 to 0.8 inches of dermis layer, and hence the detector should be fair enough to respond to it for the absorption of near-infrared light by glucose component in the blood molecules. Below the fingertip, is the detector, which consists of the OPT101 sensor. The sensor used in the detector is made up of optoelectronic type along with current to voltage converters followed by operational amplifiers which are integrated with a single IC as shown in . OPT101 has good sensitivity towards 940 nm wavelength being transmitted and has added merits of small size, low cost, compact in nature, high responsivity of 0.57 V/µW, less leakage error and more suitable for wearable devices.
Figure 4. OPT101 light intensity sensor.
5.3. Data acquisition system
The data acquisition system has a data sensing unit and an ADC unit. The data acquisition unit consists of Arduino interfaced with MATLAB which transmits the output obtained from OPT101 to the Laptop via a USB connection. It analyses the collected sensor data and processes the acquired voltage value by considering attenuation to its equivalent corresponding wavelength. MATLAB stores the data as variables in text files. The Arduino program is set to process each sample with a delay of 0.5 s estimating 120 data units for every 1-min duration. The ADC converts the analog voltage input collected from the sensor output into digital values between 0 and 1023.
5.4. FFT
The digital information obtained from the data acquisition system, which is in the time domain, is processed into the frequency domain by FFT algorithms before being subjected to filtering operation. FFT helps to analyse spectral content as well as phase information.
5.5. Blackman filter
The digitalised data is then filtered to remove the noise due to environmental effects such as water, fat, protein and so on present in the blood (Ingle and Crouch Citation1988). In the proposed system, the Blackman filter is used to remove the low-frequency and high-frequency tones ranging from 2.34 Hz to 1.59 kHz.
Blackman window equation for the length N is
5.6. Estimating glucose concentration
Beer-Lamberts law clearly states the absorbance property of materials on any kind of sample. It takes into account sample concentration, medium thickness, platform temperature, and wavelength of radiation. It is defined as the amount of light absorbed in a homogeneous medium that is directly proportional to the concentration and thickness of the sample as shown in and . When a light beam passes over a uniform sample, the intensity of the transmitted radiation declines with the increase in thickness and concentration of the liquid phantom.
Figure 5. Passing of light beam in liquid phantom.
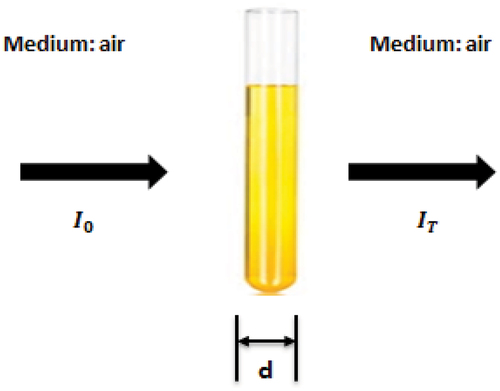
Figure 6. Passing of light beam in human fingertip.
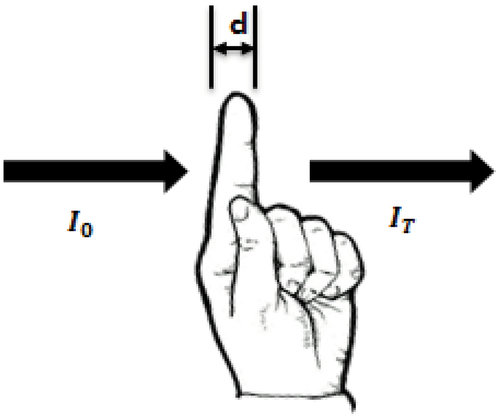
The transmittance of the liquid phantom is based on absorbance (A) and the optical depth
Or
where, is the term of transmittance, absorbance, and optical depth,
corresponds to transmitted radiant flux,
is the received radiant flux, the intensity of light entering the liquid sample is
whereas leaving the sample is
.
As per the Beer-Lambert law
Or equivalently
Where represents path length;
represents attenuating material number density;
represents attenuation coefficient;
is the cross-section of the attenuation material;
represents attenuating material molar concentration.
Under consistent attenuation, the equation follows as
Hence Beer-Lambert law shows the correspondence between the concentration and absorbance of light by a sample.
6. Results and discussion
In this section, the results of both the experimental approach and prototype system are presented and explained in detail.
6.1. Experimental approach results
The accurate weight of the sugar is determined by the precise weight measure equipment notably ELB300 PLATFORM BALANCE, as shown in . A liquid phantom or sample is created by mixing sugar with distiled water of 30 ml is used for the experimentation.
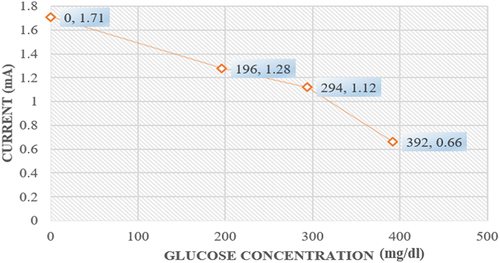
The experimental results obtained from the setup in for identification of the amount of current and its proportional voltage flow due to light absorption by a sample are presented in as a graphical representation. It is clearly shown that the current from the receiver photodetector end decreases when the concentration of glucose in the liquid phantom increases. Hence, a downward pattern is observed in which clearly helps to conclude that the blood glucose concentration (mg/dl) is inversely proportional to the current emitted from the photodetector.
Figure 7. Variation in voltage flow for the corresponding glucose concentration.
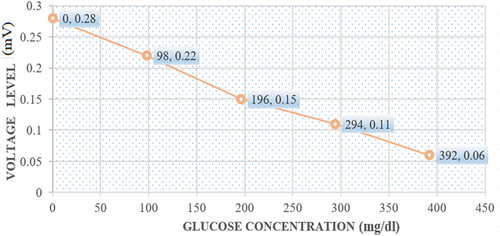
Figure 8. Variation in current flow for the corresponding concentration of glucose.
Similarly, the voltage from the photodetector declines with the increase in glucose concentration because of light-intensity absorption by the glucose molecules present in the liquid phantom. Hence, a downward pattern of voltage is observed in . Therefore, it is concluded that the concentration of glucose (mg/dl) in the blood is inversely proportional to the voltage generated by the photodetector.
6.2. Prototype results
A group of different age people with diabetic and non-diabetic conditions were preferred to analyse the performance of the proposed prototype system. The concentration of blood glucose examined in the proposed prototype system for a girl of age 20 years is shown in . The entire prototype setup is demonstrated by arranging the optical transmitter and receiver over the breadboard with Arduino as shown in . Later, the fingertip subject is placed above the optoelectronic sensor (OPT 101) to test the concentration of glucose in the blood sample as shown in . Afterwards, the NIR LED is placed in contact above the forefinger to transmit the light as shown in . To assure maximum detector efficiency, it is essential to block or minimise the amount of ambient light in the room. Accordingly, the entire set-up of the prototype is completely screened by black cloth as shown in .
Figure 9. Prototype of the complete glucose estimation system (a) prototype setup (b) fingertip subject placed over OPT101 (c) transmission and reception of optical light (d) entire set-up covered with black cloth.
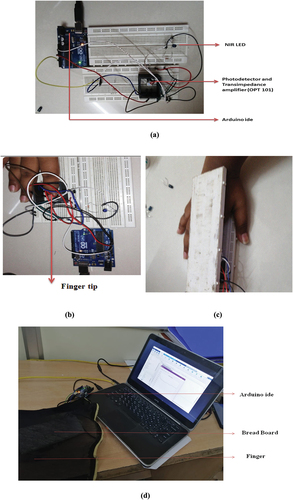
In the first stage of the data acquisition, a girl of age 20 years old is examined for the identification of concentration variation in blood glucose. Initially, with respect to the prototype, power supply is given to the NIR LED (AlGaAs LED) to emit the invisible light. The forefinger of the subject is placed above the optoelectronic sensor (OPT 101) to test the concentration of glucose in the blood sample through optical mode. Later, the NIR LED is placed in contact above the forefinger to receive the light passing through the medium. The subject took the test for four different conditions namely fasting, after one hour of food intake, after one and half hours of food intake, and after two hours of food intake in the morning, the estimated values are shown in .
Figure 10. Estimated glucose level using non-invasive technique.
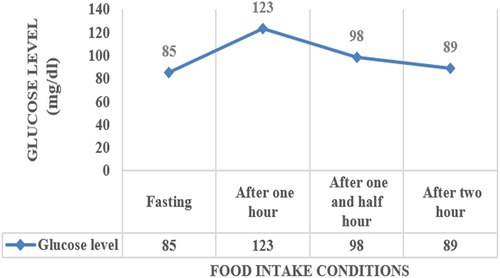
Initially, the subject (girl) underwent blood glucose testing in an optical mode without having food. During fasting conditions, the intensity of light received between the NIR LED and the optical receiver is found to be less. The concentration of blood glucose level during fasting (without food) is measured as 85 mg/dl. As per the Beer-Lamberts law, the light traversing through a subject possessing blood would absorb the photon molecule. As the concentration of glucose level increases, the amount of photon molecules absorbed by the blood also increases. Therefore, with respect to transmitted light intensity, blood glucose concentration value varies at the proposed system output.
Afterwards, high carbohydrate food (bread and milk) has been taken by the subject (girl). The food is digested in the small intestine, and the carbohydrates are absorbed as glucose in the blood. Meanwhile, the intensity of light received by the OPT 101 decreases from the previous intensity level. The estimated glucose level in the blood after one hour is 123 mg/dl. Likewise, the glucose level in the blood is estimated after one and a half hours and after two hours of food intake which is shown in .
7. Validation
The results obtained are validated by the comparison experimentation using the existing invasive fingerpick method which is shown in . lists the results obtained from four different people at three conditions namely fasting, one hour after food intake, and one and a half hours after food intake using both existing invasive technique and the proposed non-invasive technique. The accuracy level is tested by error analysis using the percentage error formula.
Figure 11. Validation of Non-invasive technique using an invasive device for a person.
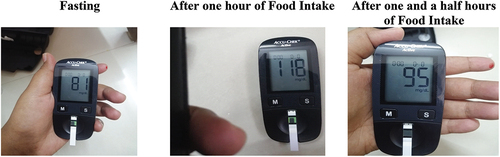
Table 1. Correlation between the commercially available fingerprick method (invasive) and sensor-based method (non-invasive) on four volunteers.
Percentage error = [Measured value (non-invasive method) – Actual value (invasive method)]/Actual value] *100
8. Clarke error grid analysis
Clarke error grid study shows the accuracy level of the proposed method, glucose level monitoring by non-invasive, optical-based NIR technique in comparison with the predicted concentration is shown in . Here, the region spread by A represents the clinically accurate conditions and the region spread by B and C represents an acceptable range, whereas D and E are erroneous for treatment.
Figure 12. Clarke grid error analysis.
9. Conclusions
This research article employs a unique approach to demonstrate the relationship between the glucose concentration and the sensor output voltages based on the received light intensity from Near Infrared LED, where the sensor voltage decreases with an increase in glucose concentration. The proposed NIR LED-based glucose sensor prototype is a promising invasive monitoring technique for the glucose levels in the blood. The prototype proposed has been experimented, and results are obtained and depicted in . The test results are displayed within 50 s of duration. The proposed non-invasive prototype is validated against the traditional invasive methods for four different volunteers under three different conditions namely fasting, after one hour and one and a half hours after food intake. The proposed non-invasive method is almost accurate with respect to the invasive method and shows a high correlation between the variation in photon intensity received from the photodetector and glucose level. Finally, from Clarke grid analysis, data points obtained from the test measurements are at a satisfactory level, showing that our developed non-invasive glucose monitoring system has better accuracy. In the future, the impact of sensor system performance due to skin roughness and body fluids concentration can be analysed to improve the calibration and system sensitivity.
Disclosure statement
This study was performed as a part of the employment of the author(s).
Data availability statement
The data used to support the findings of this study are included in the article.
Additional information
Notes on contributors
S. Vanaja
Dr. S. Vanaja is an Assistant Professor in the Department of Electronics and Communication Engineering, Easwari Engineering College, Chennai-600089, India. She received his Ph.D. degree in Electronics and Communication Engineering from Anna University, Chennai, India. She has published over 10 SCI Indexed journals and 5 Scopus Indexed journals.
Ravi Babu T
Dr. T. Ravi Babu is an Assistant Professor in the Department of Electrical and Electronics Engineering, Institute of Aeronautical Engineering, Hyderabad, Telangana, India. He received his Ph.D. degree in Electrical and Electronics Engineering from Anna University, Chennai, India. He has published over 15 SCI Indexed journals and 8 Scopus Indexed journals.
K. Malathi
Dr. K. Malathi is an Assistant Professor in the Department of Electronics and Communication Engineering, at Rajalakshmi Institute of Technology, India. She received his Ph.D. degree in Electronics and Communication Engineering from Anna University, Chennai, India. She has published over 10 SCI Indexed journals and 3 Scopus Indexed journals.
Kuldeep K Saxena
Prof. Kuldeep K Saxena has 13+ years of experience in academics, research, and industry. Prof. Saxena holds expertise in the hot deformation behavior of materials, microstructural characterization of materials, and micromanufacturing. He has served as Senior Research Fellow (SRF) for 2 years and 8 months on a project sponsored by the Board of Research in Nuclear Sciences (BRNS), a research unit of Bhabha Atomic Research Centre, Trombay, Mumbai. He is the author of many book chapters published by reputable publishers such as Elsevier and many more. He has authored 272+ research papers which are published in reputed international journals indexed by SCI/ Scopus. He has organized many International Conferences in India and Abroad. He is currently working as a Professor and Head of the Department of Research Impact and Outcome (LFTS) in the Division of Research and Development, Lovely Professional University, Phagwara, India. He is an active member of The Indian Institute of Metals (IIM) and Secretary of The Indian Institute of Metals Mathura Chapter. He is also a guest editor in many reputed journals.
J. Joselin Jeya Sheela
Dr. J. Joselin Jeya Sheela is an Assistant Professor in the Department of Electronics and Communication Engineering, Saveetha School of Engineering, Chennai- 600124, India. She received his Ph.D. degree in Electronics and Communication Engineering from Anna University, Chennai, India. He has published over 25 SCI Indexed journals and 8 Scopus Indexed journals.
S. Suruthi
Dr. S. Suruthi is an Assistant Professor in the Department of Electronics and Communication Engineering, Easwari Engineering College, Chennai-600089, India. She received his Ph.D. degree in Electronics and Communication Engineering from Anna University, Chennai, India. He has published over 2 SCI Indexed journals and 4 Scopus Indexed journals.
Stalin .B
Dr. B. Stalin is an Assistant Professor in Mechanical Engineering at Anna University, Regional Campus Madurai, Madurai 625 019, Tamil Nadu, India. He received his Ph.D. degree in Mechanical Engineering from Anna University, Chennai, India. His research interests include the Design and manufacturing of composite structures and Structural analysis using FEA. He has published over 100 SCI Indexed journals and 50 Scopus Indexed journals.
N. Nagaprasad
Dr. N. Nagaprasad is an Associate Professor in Mechanical Engineering at ULTRA College of Engineering and Technology, Madurai, Tamilnadu, India. He received his Ph.D. degree in Mechanical Engineering from Anna University, Chennai, India. His research interests include the Design and manufacturing of composite structures and Structural analysis using FEA. He has published over 78 SCI Indexed journals and 15 Scopus Indexed journals.
Ramaswamy Krishnaraj
Dr. R. Krishnaraj is a Professor in the Department of Mechanical Engineering at Dambi Dollo University, Dembi Dollo, Ethiopia. He received his Ph.D. degree in Mechanical Engineering from Anna University, Chennai, India. His research interests include Environmental Pollution and Structural analysis using FEA. He has published over 100 SCI Indexed journals and 45 Scopus Indexed journals.
Din Bandhu
Dr. Din Bandhu is presently working as an Assistant Professor (Senior Scale) in the Department of Mechanical and Industrial Engineering at Manipal Institute of Technology (MIT), MAHE Bengaluru Campus, Karnataka, India. Before joining MIT, he worked as an Assistant Professor in Mechanical Engineering at IIITDM, Kurnool (An Institute of National Importance, Govt. of India). He holds a Ph.D. in Mechanical Engineering from IITRAM Ahmedabad (A Research-Based Autonomous University) in Gujarat. He has over 12 years of academic and research experience at many prestigious Indian institutions. Advanced welding techniques, welding metallurgy, characterization, composite materials, performance optimization, and biofuels are among his research interests. So far, he has published 75 SCI/SCIE/ESCI and Scopus-indexed research papers in various international journals and conferences of repute. He has also written one book titled ‘A Guide to Injection Moulding Techniques’. He is also a potential reviewer for many peer-reviewed international journals and conferences.
Uma Reddy
Dr. Uma Reddy is a Professor & Head of the Artificial Intelligence and Machine Learning Department at New Horizon College of Engineering, Bangalore, Karnataka. She has published several articles in reputable journals and conferences.
References
- Althobaiti M, Al-Naib I. 2021. Optimization of dual-channel near-infrared non-invasive glucose level measurement sensors based on monte-carlo simulations. IEEE Photonics J. 13(3):1–10. doi: 10.1109/JPHOT.2021.3079408.
- Haxha S, Jhoja J. 2016. Optical based noninvasive glucose monitoring sensor prototype. IEEE Photonics J. 8(6):1–11. doi: 10.1109/JPHOT.2016.2616491.
- Ingle JD, Crouch SR. 1988. Spectrochemical analysis. 1st ed. New Jersey: Prentice Hall.
- Joshi AM, Jain P, Mohanty SP, Agrawal N. 2020. iGLU 2.0: A new wearable for accurate non-invasive continuous serum glucose measurement in IoMT framework. IEEE Trans Consum Electron. 66(4):327–335. doi: 10.1109/TCE.2020.3011966.
- Klonoff DC. 2007. The benefits of implanted glucose sensors. J Diabetes Sci Technol. 1(6):797–800. doi: 10.1177/193229680700100601.
- Li X and Li C, 2015, October. Research on non-invasive glucose concentration measurement by NIR transmission. In 2015 IEEE International Conference on Computer and Communications (ICCC) p. 223–228.
- Notkins AL. 2002. Immunologic and genetic factors in type 1 diabetes. J Biol Chem. 277(46):43545–43548. doi: 10.1074/jbc.R200012200.
- Peng X, Yan YX, Liu H. 2022. On the use of fiber lasers in non-invasive blood glucose monitoring. Opt Fiber Technol. 68:102822. doi: 10.1016/j.yofte.2022.102822.
- Pradeepa R, Mohan V. 2021. Epidemiology of type 2 diabetes in India. Indian J Ophthalmol. 69(11):2932. doi: 10.4103/ijo.IJO_1627_21.
- Rachim VP, Chung WY. 2019. Wearable-band type visible-near infrared optical biosensor for non-invasive blood glucose monitoring. Sens Actuators B Chem. 286:173–180. doi: 10.1016/j.snb.2019.01.121.
- Saleh G, Alkaabi F, Al-Hajhouj N, Al-Towailib F, Al-Hamza S. 2018. Design of non-invasive glucose meter using near-infrared technique. J Med Eng Technol. 42(2):140–147. doi: 10.1080/03091902.2018.1439114.
- Segman Y. 2018. Device and method for noninvasive glucose assessment. J Diabetes Sci Technol. 12(6):1159–1168. doi: 10.1177/1932296818763457.
- Sridevi P, Arefin AS, Ibrahim ASM. 2021. A feasibility study of non-invasive blood glucose level detection using near-infrared optical spectroscopy. Bangla J Med Phys. 14(1):1–13. doi: 10.3329/bjmp.v14i1.57313.
- Tang L, Chang SJ, Chen CJ, Liu JT. 2020. Non-invasive blood glucose monitoring technology: a review. Sensors. 20(23):6925. doi: 10.3390/s20236925.
- Vashist SK. 2013. Continuous glucose monitoring systems: a review. Diagnostics. 3(4):385–412. doi: 10.3390/diagnostics3040385.
- Yadav J, Rani A, Singh V and Murari BM, 2014, February. Near-infrared LED based non-invasive blood glucose sensor. In 2014 International Conference on Signal Processing and Integrated Networks (SPIN); Noida, India. IEEE. p. 591–594.