
ABSTRACT
Accurate representation of spinal geometry is necessary in biomechanical modelling to properly understand the function of the spine. The objective of this study was to create a large database of image-derived digital spine surface models for geometric studies and computational biomechanics investigation. Computed tomography scan data was acquired from 60 asymptomatic subjects (30 males and 30 females). Subjects ranged in age from 20 to 68 with equal numbers selected in each 10-year age bracket. Three-dimensional geometric surface models were generated for each subject’s spine. A series of distance measures were also computed for each vertebral body to assess variation in the population. Geometric measures were able to show the significant variation in vertebrae size and shape within the subject population and as a function of vertebral level, gender, and age. This database enables the biomechanical evaluation of the variation in spinal loads that occurs within the population due to geometry.
1. Introduction
The geometry of the spine’s vertebral bodies is quite complex. The anterior portion consists of a cylindrical-shaped block, while the posterior consists of a ring from which numerous bony processes extend. This multifaceted shape provides protection for the neural elements, allows for the attachment of intervertebral discs and various ligaments, and permits mechanical articulation in the facet joints. With such a complex shape and range of functions, an accurate representation is necessary to faithfully evaluate the biomechanics of the spine, particularly in computational spine modelling.
Early biomechanical models relied on anatomy texts and in vitro measurements to represent vertebral bodies (Sharma et al. Citation1995). Geometry data derived from biomedical imaging became available in more recent years (Shirazi-Adl et al. Citation2002). Most current spine models rely on computed tomography (CT) scan data (Kumaran et al. Citation2021), though some have used magnetic resonance imaging (MRI) (Zanjani-Pour et al. Citation2016). Creating three-dimensional geometric models from imaging data usually requires either manual tracing/digitisation or a combination of image processing procedures to segment out the structures of interest. Manual tracing requires expert knowledge of the spine’s anatomy and can be very time consuming. This method was acceptable with earlier models derived from relatively coarse CT scans that consisted of a small number of image slices. This is much more difficult with recent imaging data as the large number of slices make manual tracing time prohibitive. Thus, most models are now created using image processing techniques that operate on the properties of the individual image voxels. Thresholding or region growing techniques are frequently used, but others employ more advanced methods like active contour segmentation or level set methods. Each of these can be combined with various morphological and image filtering processes. Interestingly, most models that do include geometry from imaging data give very little description about the segmentation process employed or justification for the threshold values selected.
Unfortunately, even with these advanced methods, the creation of spine geometry from imaging data for biomechanical modelling is still very difficult and as a result, often requires several simplifications. Vertebrae are often assumed to have sagittally-symmetric geometry, the same basic vertebral shape is often reused for multiple vertebral levels, and other simplifications performed to further idealise the models to facilitate computation (Lo et al. Citation2019). One of the most common simplifications happens in the facet joints owing to the extreme difficulty in modelling them in the segmentation process. Instead of including geometry from imaging data, the facet surfaces are often derived from literature data and the mating surfaces represented as flat planes (Abouhossein et al. Citation2011). Facet simplification can have a strong influence on displacements, forces, and stress distributions (Holzapfel and Stadler Citation2006). Even with these simplifications, most detailed spine studies still only include a model developed from a single specimen (Knapik et al. Citation2022). Thus, they do not include the influence of the variation in size and shape that occurs in the population.
Unfortunately, all these simplifications result in far less accurate and realistic vertebral body models, and in the case of single-subject models, they do not account for variations from subject to subject. When used in biomechanical models, these inadequacies could lead to inaccurate spinal load data and an incomplete understanding of how loads vary in the population. Many simplified biomechanical models have shown that manually manipulating different aspects of the spine’s geometry can have a significant impact on spine loading (Lavaste et al. Citation1992; Robin et al. Citation1994; Natarajan and Andersson Citation1999; Meijer et al. Citation2010, Citation2011; Niemeyer et al. Citation2012; Kim et al. Citation2013; Bashkuev et al. Citation2018, Citation2020). In addition, other cadaveric studies have found relationships between various geometric measures and different disorders such as degenerative spondylolisthesis, isthmic spondylolysis, disc herniation, osteoarthritis in the facets, and spinal stenosis (Panjabi et al. Citation1993; Grobler et al. Citation1993; Kim and Lee Citation1995; Boden et al. Citation1996; Berlemann et al. Citation1998; Love et al. Citation1999; Fujiwara et al. Citation2001; Kalichman et al. Citation2009). Furthermore, both two-dimensional (Meakin et al. Citation2009; Pavlova et al. Citation2017) and three-dimensional (Hollenbeck et al. Citation2018; Sciortino et al. Citation2022; Tang et al. Citation2022) statistical shape models developed from imaging data have shown shape modes of variation associated with patient stature, age, gender, disc herniation, and spondylolisthesis. One study developed 35 synthetic spines using statistical shape modelling and found variation in spinal loads with geometry as a function of the various mode shapes (Campbell et al. Citation2016).
Given these current limitations in the spine biomechanical modelling literature and the significant expected impact of patient spine geometry, this research was undertaken to create a large database of image-derived digital spine surface models. In addition to permitting a multitude of geometric studies, this database could also be used to understand the impact of geometric variation on spinal loads using computational modelling. A series of geometric measures were also computed to evaluate variation in the population and the impact of vertebral level, gender, and age.
2. Materials and methods
2.1. Subjects
This retrospective study developed highly detailed three-dimensional vertebral body models from radiology archive imaging data. Sixty subjects (30 males and 30 females) were selected from the Ohio State University Wexner Medical Center Radiology archive. To ensure that subjects would have imaging with relatively small slice thickness and high image quality but had healthy spines with no prior history of low back pain, certain diagnoses were targeted. Patients that had imaging for diagnoses of aortic aneurysms, aneurysm repair, mesenteric ischaemia, abdominal pain, iliac aneurysm, iliac aneurysm repair, endoleak, IVC thrombosis, venous thrombosis, renal artery stenosis, hypertension, aortic injury, trauma, aortic dissection, or vasculitis as part of standard medical care were included. Other studies have used similar methods to obtain imaging of asymptomatic patients (Belfi et al. Citation2006; Kalichman et al. Citation2009). The images were reviewed by a radiologist and subjects demonstrating lumbar spines that were beyond the normal limits for age were excluded (including but not limited to congenital anomalies of the spine, fractures, prior lumbar surgery, neoplasm, severe degenerative disease, discitis, or osteomyelitis). Images were also inspected to ensure the entire lumbar section was present in the field of view (S1 to T12), subjects were lying in a supine posture without significant lateral or axial rotation, and image quality. Given the mixture of scanner types and large variety of source imaging in the radiology archive, scan parameters varied between subjects. The in-plane CT pixel size ranged from .56 mm to .98 mm and the slice thickness ranged from .625 mm to 1.25 mm. Medical records were accessed to exclude subjects with a prior history of back pain or radiculopathy. The subject’s age, gender, height, and weight were also recorded from the medical record (age: 44.8 (14.6) years, mass: 85.9 (18.9) kg, and height: 170.9 (11.2) cm). Subjects ranged in age from 20 to 68 with equal numbers selected in each 10-year age bracket. Each age bracket had six males and six females. The study was approved by the University Institutional Review Board.
2.2. Model development
A series of processes were required in order to convert the acquired imaging data into three-dimensional geometric models for each subject’s spine. The makeup of the spine necessitates different techniques for different portions of the spine. The anterior portion of the vertebral body is a thick mass composed primarily of blood rich cancellous bone with a relatively thin shell of dense cortical bone covering the outside. The posterior portion is composed primarily of cortical bone and the bony processes are in close proximity to adjacent vertebral bodies. This overall structural makeup can result in relatively dark returns in the anterior portion and very bright returns in the posterior portion. The close proximity of the posterior elements often results in erroneous connections between adjacent vertebral bodies. In addition, the proportions of cortical and cancellous bone changes from level to level. Most studies only employ a single threshold for the entire spine when creating geometric models (Rasoulian et al. Citation2013), which does not account for all these complexities. In fact, the use of multi-threshold methods has been found to create significantly more accurate geometric models from CT data (Rathnayaka et al. Citation2011). In this study, for each subject, separate processes were employed for the anterior and posterior portions of each vertebral body and unique thresholds were selected for each vertebral level.
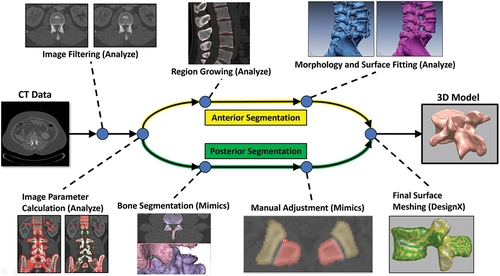
First, the CT image sets were imported into Analyze 12.0 (Mayo Clinic, Rochester, MN, USA), a software package for biomedical image processing, visualisation, and analysis. Next, a Median Spatial Filter was used to remove some of the baseline noise and smooth the dataset, while still preserving much of the edge data. From here the appropriate voxel greyscale ranges for thresholding were determined separately for each vertebral body, in each spine. Three-dimensional regions of interest within the bony elements of each vertebral body as well as regions from the surrounding tissue were selected and then analysed to quantify the variation of greyscale values in the voxels. Each of these values were then used to determine suitable threshold ranges for each individual vertebral body. From here, for the anterior portion of the spine, the determined threshold values were applied in a region growing operation to select the representative voxels to be included in the model. A seed point was manually placed in the anterior portion of each vertebral body. All voxels connected to the seed point and within the desired threshold range were included. Next a series of morphological operations (erosion, dilation, opening, closing) and hole filling were applied to refine the segmentation. From here, surface models were fit to each individual segmentation using Analyze 12.0’s Adapt Deform surface fitting algorithm. This adaptive model iteratively adjusts the position and density of the surface mesh to balance reconstruction accuracy, surface smoothness, and polygon count (Analyze User Guide). For the posterior portion of each vertebral body, the CT image sets were imported into Mimics 23.0 (Materialise, Leuven, Belgium) medical imaging processing software. Mimics’ advanced CT bone algorithm was used to semi-automatically create unique segmentations for the posterior of each vertebral body. The mating surfaces in each facet joint pair were then adjusted manually on each CT image slice with a Cintiq pen display (Wacom, Toyonodai, Kazo-shi, Saitama, Japan). From here, surface models were fit to each individual segmentation using custom parameters. The separate surfaces for the anterior and posterior portions of each vertebral body were then combined into a single surface mesh in Geomagic DesignX (3D Systems, Rock Hill, SC, USA) and optimised for downstream computational modelling. This segmentation workflow was found to yield very accurate surface models with mean deviations below CT scan resolution in canine cervical spines (Bertran et al. Citation2012). In this study, CT scans were obtained from canine specimens which were then dissected and stripped of all soft tissue. Each vertebral body was scanned with a high accuracy laser scanner. The resulting surface models then acted as the ground truth to which the CT-derived models could be compared to assess accuracy of the model development process. shows each step of the model development process and the associated software employed.
Figure 1. Model pipeline showing each step in the development process. The software used in each step is shown in parentheses.
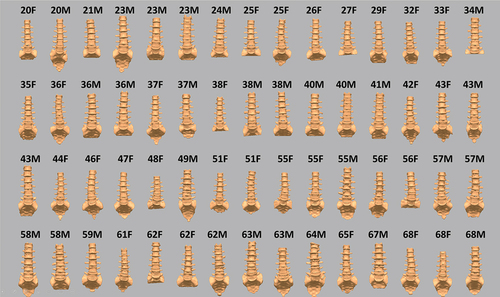
Full lumbar spine models were created for each of the 60 subjects. Six subjects exhibited partial or fully bony fusion at the L5/S1 level or had an extra lumbar vertebrae (L6) present that was fused to the sacrum. These levels were excluded from the following geometric analysis. In certain spines, small portions of the T12 and S1 models were cut-off due to the limits of the imaging field of view. In those cases, the impacted geometric measures were excluded from the geometric analysis. shows the entire database of spine models formatted specifically for further biomechanical analysis and simulation.
Figure 2. Spine geometry database. The label above each spine identifies the subject age and gender.
2.3. Geometric output measures
A series of distance measures were computed for each vertebral body to assess the impact of subject age, gender, and level of the spine on vertebral dimensions and symmetry. These measures could then also be compared to analogous anatomic studies in the literature.
In order to create accurate distance measures from each vertebral body model, in Geomagic DesignX, virtual datum points were automatically extracted from relevant geometry landmarks and least squares fitting algorithms were used to calculate feature centroids or other values (e.g. facet surface centroids, maximum lateral extent of transverse processes). Similarly, virtual datum planes were also extracted from the vertebral body surfaces (e.g. plane best fit through the vertebral endplates, cardinal planes use to establish the local coordinate system for each vertebral body). An example virtual datum plane extracted from a vertebrae model is displayed in . This automated process removed any errors or bias related to selecting datum points for distance measures by hand. All length and distance measures were calculated in custom code written in MATLAB (MathWorks Inc., Natick, MA, UA). Each of the measures are displayed in . These measures were not meant to be an exhaustive quantitative description of the entire anatomy of the vertebral body, rather they were meant to succinctly describe the natural variability present in the established normative database. The ultimate goal for this database was the exploration of the impact of subject-specific geometry on various biomechanical measures. Future studies could measure and assess other vertebral body dimensions from the database.
Figure 3. Example showing the creation of a datum plane representing the superior vertebral endplate extracted from surface data.
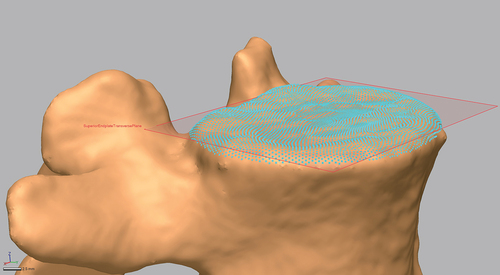
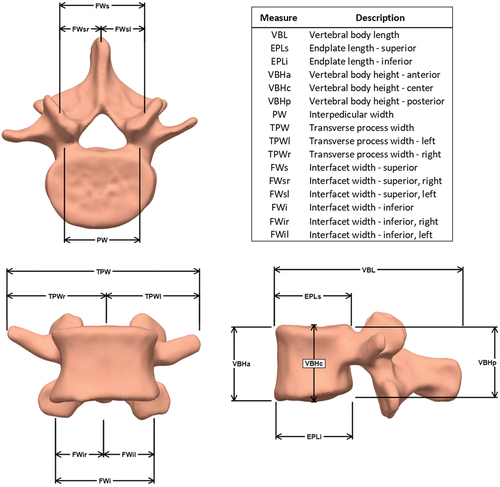
Figure 4. Vertebral body geometric measures.
2.4. Statistical analysis
Each of the dependent geometric measures was tested for normality prior to statistical analysis. Patient gender, age (grouped by decade), vertebral level, and all interactions on the dependent measures were input into a generalised linear mixed model with subject, and interaction effects involving subject as random effects. Paired T-tests were used to compare between measures on the left and right side of each vertebral body to assess bilateral symmetry in the geometry. Post-hoc analyses were performed using Tukey HSD and Student’s T-Tests where appropriate. All data were interpreted relative to a significance level of α = 0.05. All statistical analyses were performed using JMP Pro 15 software (SAS Institute, Cary, NC, USA). JMP is a statistical analysis package designed for exploratory data investigation and visualisation with automated scripting to ensure reproducible models and analyses.
3. Results
Statistically significant main and interaction effects for each of the measures are shown in . The subject random effect was statistically significant for all measures and showed the large variation between individual subjects. The vertebral level and gender main effects were also significant for all measures. Age was significant for just a few measures. Many interactions were significant, but these were mainly indicative of the overall variability and some crossover between groups.
Table 1. Statistically significant main and interaction effects for each of the geometric measures. Bold elements denote a statistically significant result (p < 0.05). See figure 4 for a description and visual representation of each measure in the table.
3.1. Vertebral body lengths and heights
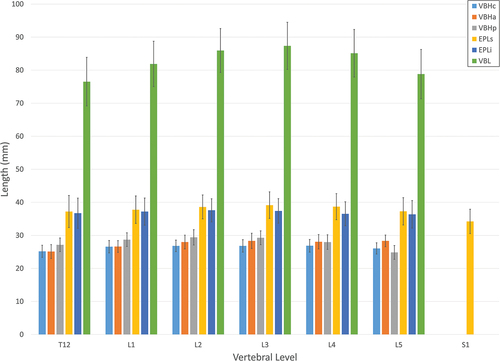
Vertebral body length and height measures are shown in . Overall, vertebral body and inferior and superior endplate length measures as a function of vertebral level increased from T12 to L3 and then decreased from L4 to L5. Males were larger than females for each of the length measures. The age main effect also had a significant impact on the lengths. Each of the length measures increased in a somewhat linear fashion with age peaking in the 60s age group. There was a significant vertebral level*gender interaction for the inferior endplate length. Male lengths did not change with level while female lengths increased from T12 to L3 and then decreased from L4 to L5. The vertebral level main effect had a significant and unique impact on each of the height measures. Anterior height increased from T12 to L2 in a linear fashion and then remained about the same to L5. The centre height was similar from L1 to L4, while both T12 and L5 were significantly smaller. The posterior height increased from T12 to L2 and then decreased down to L5. The net effect of the changes in these three measures throughout the spine was a change in the overall shape of the anterior portion of the vertebrae over the vertebral levels. As with most of the other measures, males were larger than females.
Figure 5. Vertebral body height and length measures as a function of vertebral level.
3.2. Interpedicular, interfacet, and transverse process widths
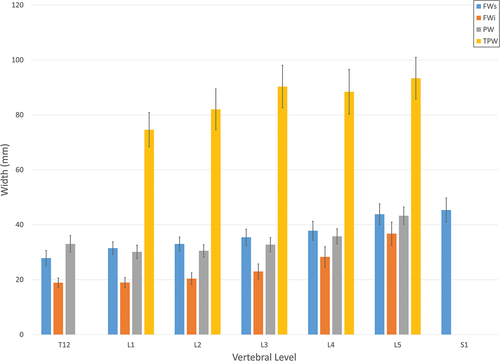
shows the interpedicular, interfacet, and transverse process width measures. Interpedicular width as a function of vertebral level decreased from T12 to L1 and then increased to L5. Each of the transverse process measures increased in the caudal direction in a generally linear pattern except for the L4 level that was slightly less than the L3 level. The gender main effect was significant for each of these measures with males once again being significantly larger. There were very few differences between the left and right width measures. The paired T-tests comparing the left and right superior and inferior facets widths did not show significant asymmetry. One exception were the left and right-side transverse process widths that did show a significant difference (t < .0079), demonstrating some left/right asymmetry. The vertebral level main effect had a significant impact on each of the interfacet width measures. Each of the superior width measures increased in a linear fashion in the caudal direction, peaking at S1. Each of the inferior width measures also increased caudally, but in a more exponential shape. Males were significantly larger than females for all the facet width measures, though the differences were greater in the superior facets.
Figure 6. Interfacet, interpedicular, and transverse process width measures as a function of vertebral level.
4. Discussion
This work was able to create a highly detailed digital database of asymptomatic subject-specific, image-derived lumbar spine models. Special care was taken to maximise accuracy and minimise partial volume and other errors by selecting unique threshold values for every single vertebral body modelled and using separate techniques for the anterior and posterior portions of the vertebrae. The equal numbers of subjects for each gender and in each age bracket were selected to approximate a normative population. The end result was a detailed lumbar spine digital database. While many other spine geometry databases have been created in the past, those often consisted of a series of discrete measures. This study is unique in that it created a large database of digital geometric models. Several measurements are presented for each vertebral body here for initial analysis, but since this created actual three-dimensional surface models, many other measurements could be extracted in the future. In addition, these models can be used for a variety of biomechanical investigations. Given that most modelling studies in the literature rely on only a few or just one spine model, this database provides a unique and comprehensive resource to study biomechanical responses throughout a large population and assess individual variability.
As expected, the subject random effect was significant for every measure and demonstrates the variability in spine size and shape in the population. The values in this study are generally consistent with other studies (). Though, there are some differences between studies which could be the result of several different factors. Differences in the subject population could be one factor. This study included an even distribution of ages and equal numbers of males and females, while others were not so evenly distributed. The way each measure was defined and calculated could also have resulted in variations. For example, in this study the endplate length measures were calculated by finding the outermost anterior and posterior margins of each endplate. Most other studies measured the endplate length only in the midsagittal plane, which generally results in a smaller measure and is the reason for the slightly larger values in this study. The differences in interfacet distances could also be attributed to the methodology employed. In this study, centroids were calculated from the surface profile of each facet. The distance between these centroids was then defined as the interfacet distance. Other studies may have calculated their centroids differently or selected a larger or smaller extent of the facet surface for the calculation. These differences could have caused the contrast in values. The vertebral body height and length and transverse process width measures match the other studies very closely. Collectively, these measures show that the overall size of the vertebrae in this study are comparable to others in the literature.
Table 2. Vertebrae measurement comparison with previous geometry studies (mm). See figure 4 for a description and visual representation of each measure in the table.
The overall variability shifted from one measure to another. The coefficient of variation was largest for the interfacet width measures (18.36–28.99%). This broadly matches various shape analysis studies that have found variation in different geometric aspects of the vertebrae within specific mode shapes. The magnitude of variation is especially significant when considering its impact on biomechanical modelling. Numerous studies have found that relatively small variation in model inputs can create a very large range of outputs (Espino et al. Citation2003; Noailly et al. Citation2007; Campbell et al. Citation2016). The large variation present in the interfacet measures in particular could have a considerable impact on spinal loads. Previous parametric modelling studies have found facet position measures to be among the most influential parameters on spinal loads (Niemeyer et al. Citation2012). Thus, the geometric variability present in this database may result in a large range of biomechanical outcomes.
The significant variation in measures with vertebral level demonstrates the changing shape and function of the vertebrae throughout the spine. The pattern of the level-to-level variation is generally consistent with other studies, even allowing for differences in methodology. These patterns did differ between measures, indicating that each vertebral body is not uniformly scaled from level to level, but instead changes in shape. These changes in shape reflect the variation in loads throughout the spine and differing role each vertebral body plays in the spine system.
The main effect of gender was also found to have a significant impact on all the measures. As expected, male vertebrae were generally larger than those of females (Zhou et al. Citation2000; Pavlova et al. Citation2017; Tang et al. Citation2022). The difference in measures between males and females was not uniform, so not only were male vertebrae generally larger, but the proportions were also different as well. Consequently, female vertebrae are not simply a scaled version of males’ but require specific consideration as well, especially in biomechanical modelling.
There were relatively few significant effects in regard to age. This generally matches the size measures of others (Masharawi et al. Citation2005; Wang et al. Citation2012), though several of the statistical shape model studies did find age-related shape changes (Tang et al. Citation2022; Clouthier et al. Citation2023). The only exceptions were the vertebral body and endplate length measures that increased with age, most likely from bone remodelling and osteophyte growth. All the measures considered in this study were gross dimensions of vertebrae size and did not capture smaller details that might change with age and could play an important role in spine biomechanics. One study found various specific facet measures that increased with age which could have a large impact on spinal loads in the facets and other structures (Otsuka et al. Citation2010). Thus, while many of the global measures were not sensitive to age, there is still evidence to support the important shape differences with ageing that should be considered in biomechanical modelling.
As with any study, several limitations should be discussed. This study created a normative database of highly detailed lumbar spine models from CT images. To obtain high-resolution images of the low back from subjects without a history of spinal disorders, subjects with CT angiograms or similar scans were targeted. As a result, it is possible that this group of subjects may not generalise to the population given the possible presence of other, non-spine related issues. Though, the risk of these specific pathologies having an impact on the structure of the spine was expected to be low. Furthermore, a radiologist reviewed each of the image sets to exclude spines demonstrating evidence of disorders.
In order to remove subjectivity and human error, the model development process was highly structured, systematic, and automated where possible. Though, the final steps in the process did include some manual cleanup that could be subject to human error. Fortunately, even this was carefully controlled as threshold filters were applied in the manual markup process to ensure only voxels within the calculated threshold ranges were modified. Thus, this would have a small impact on the overall model.
This study developed a large, highly detailed collection of digital lumbar spine models from CT images of asymptomatic subjects using advanced segmentation techniques. Geometric measures were able to show the significant variation in vertebrae size and shape within the subject population and as a function of vertebral level, gender, and age. The creation of digital models, rather than just simple measures, enables future studies to evaluate other geometric measures as well as statistical shape modelling to evaluate other spine characteristics, to create virtual subjects for analysis, and to aid with future image segmentation. This database will also play an important role in future biomechanical studies. Follow-on studies from this work propose to create computational spine models from each spine in this database to investigate the impact subject-specific spine geometry has on dynamic biomechanical loading in the intervertebral discs, facets joints, and spinal ligaments. Most studies in the literature only develop a detailed model of a single subject or create a range of simplified models. This database will hopefully provide unique insight by examining the behaviour of the spine as a function of its detailed geometry and its variation across a large range of different subjects.
Disclosure statement
No potential conflict of interest was reported by the author(s).
Additional information
Funding
Notes on contributors
Gregory G. Knapik
Gregory G. Knapik, PhD is the Associate Director of the Ohio State University Spine Research Institute and a Research Professor in the Department of Integrated Systems Engineering. His research focuses on computational spine modeling and its applications in industrial and clinical biomechanics. He specializes in clinical data collection and laboratory testing, occupational biomechanics testing and industrial surveillance, machine learning and data analysis, and dynamic simulation. His recent work involves the development of personalized biomechanical models utilizing physiologic measures and biomedical imaging data to provide quantitative measures to promote spine disorder prevention and improved treatment. Dr. Knapik has authored peer-reviewed research articles on various biomechanics topics including causal pathways for spine disorders, laboratory biomechanical studies, and person-specific computational spine modeling, and he has given numerous presentations and invited talks.
Ehud Mendel
Ehud Mendel, MD, MBA is a neurosurgeon and director of the Spine Oncology Program at Smilow Cancer Hospital’s Disease Center. A renowned leader in spinal surgery procedures, Dr. Mendel removes spinal tumors and has spearheaded research in reconstructive surgery following tumor removal. With areas of specialty including spinal cancer, spine sarcoma, and spinal cord tumors, he has built specific protocols for removal of spinal cord tumors. The entire tumor must be removed, or cancer cells invade other parts of a patient’s body. Dr. Mendel’s research includes examination of the characteristics of osteoblastomas(a rare, noncancerous bone tumor), the physics of lower back disorders, and the use of radiosurgery, MRIs, and other surgical tools. Additionally, Dr. Mendel is division chief of the Spine Surgery Program and the executive vice chair in the Yale School of Medicine Department of Neurosurgery.
Eric Bourekas
Eric C. Bourekas MD, MBA, FACR is a Diagnostic and Interventional Neuroradiologist and Professor of Radiology, Neurology and Neurological Surgery at the Wexner Medical Center and The Arthur G. James Cancer Hospital and Richard J. Solove Research Institute at The Ohio State University. A Fellow of the American College of Radiology, former Chief of Neuroradiology, Vice Chair of Clinical Operations and President of the Ohio Radiological Society, his clinical and research interests include spinal procedures, vertebral augmentations and in particular vertebroplasty, in the setting of spinal tumors and as an adjunct in the setting of Radiation Therapy and is part of a multispecialty group studying the effects of radiation on bone integrity through the use of vertebral bone computer modeling. Dr. Bourekas has been recognized in Top Doctors in Columbus, Ohio since 2016 as one of only 2 Neuroradiologists.
William S. Marras
William S. Marras is the Distinguished University Professor and holds the Honda Endowed Chair in Integrated Systems Engineering at the Ohio State University. He serves as the Director of the Spine Research Institute at the Ohio State University where he leads NIH, NSF, DoD and privately funded research efforts. Dr. Marras also holds joint academic appointments in the Departments of Orthopaedic Surgery, Neurosurgery, and Physical Medicine & Rehabilitation. His research is focused on understanding multidimensional causal pathways for spine disorders through quantitative epidemiologic evaluations, laboratory biomechanical studies, personalized mathematical modeling, and clinical studies of the lumbar and cervical spines. Professor Marras has been active in the National Research Council having served on over a dozen boards and committees and has served as Chair of the Board on Human Systems Integration for multiple terms. He has also served as Editor-in-Chief of Human Factors is currently Deputy Editor of Spine and has served as the President of the Human Factors and Ergonomics Society. Dr. Marras holds Fellow status in six professional societies and is an elected member of the National Academy of Engineering, recorded a TEDx talk entitled “Back Pain and your Brain” and has been featured on NPR’s All Things Considered.
References
- Abouhossein A, Weisse B, Ferguson SJ. 2011. A multibody modelling approach to determine load sharing between passive elements of the lumbar spine. Comput Methods Biomech Biomed Engin. 14(6):527–11. doi: 10.1080/10255842.2010.485568
- Bashkuev M, Reitmaier S, Schmidt H. Relationship between intervertebral disc and facet joint degeneration: a probabilistic finite element model study. J Biomech. 2020 Mar 26 102:109518. doi: 10.1016/j.jbiomech.2019.109518.
- Bashkuev M, Reitmaier S, Schmidt H. 2018. Effect of disc degeneration on the mechanical behavior of the human lumbar spine: a probabilistic finite element study. Spine J. Oct 18(10):1910–1920. doi:10.1016/j.spinee.2018.05.046
- Belfi LM, Ortiz AO, Katz DS. 2006. Computed tomography evaluation of spondylolysis and spondylolisthesis in asymptomatic patients. Spine. 31(24):E907–E910. doi: 10.1097/01.brs.0000245947.31473.0a
- Berlemann U, Jeszenszky DJ, Bühler DW, Harms J. 1998. Facet joint remodeling in degenerative spondylolisthesis: an investigation of joint orientation and tropism. Eur Spine J. 7(5):376–80. doi: 10.1007/s005860050093
- Berry JL, Moran JM, Berg WS, Steffee AD. 1987. A morphometric study of human lumbar and selected thoracic vertebrae. Spine. 12(4):362–367. doi: 10.1097/00007632-198705000-00010
- Bertran J, Knapik GG, Marras WS, Noel F, Allen M 2012. Comparison of optical white light scanning and computed tomography for the generation of 3D models of the canine cervical spine. Poster session presented at: American College of Veterinary Surgeons Veterinary Symposium; 2012 Nov 1–3, National Harbor, MD.
- Boden SD, Riew KD, Yamaguchi K, Branch TP, Schellinger D, Wiesel SW. 1996. Orientation of the lumbar facet joints: association with degenerative disc disease. J Bone Joint Surg Am. Mar 78(3):403–11. doi:10.2106/00004623-199603000-00012
- Campbell JQ, Coombs DJ, Rao M, Rullkoetter PJ, Petrella AJ. 2016. Automated finite element meshing of the lumbar spine: verification and validation with 18 specimen-specific models. J Biomech. 49(13):2669–2676. doi: 10.1016/j.jbiomech.2016.05.025
- Clouthier AL, Wenghofer J, Wai EK, Graham RB. Morphable models of the lumbar spine to vary geometry based on pathology, demographics, and anatomical measurements. J Biomech. 2023 Jan. 146:111421. doi:10.1016/j.jbiomech.2022.111421
- Espino DM, Meakin JR, Hukins DW, Reid JE. 2003. Stochastic finite element analysis of biological systems: comparison of a simple intervertebral disc model with experimental results. Comput Methods Biomech Biomed Engin. 6(4):243–248. doi: 10.1080/10255840310001606071
- Fujiwara A, Tamai K, An HS, Lim TH, Yoshida H, Kurihashi A, Saotome K. 2001. Orientation and osteoarthritis of the lumbar facet joint. Clin Orthop Relat R. 385:88–94. doi: 10.1097/00003086-200104000-00015.
- Gilad I, Nissan M. 1986. A study of vertebra and disc geometric relations of the human cervical and lumbar spine. Spine. 11(2):154–157. doi: 10.1097/00007632-198603000-00010
- Grobler LJ, Robertson PA, Novotny JE, Pope MH. 1993. Etiology of spondylolisthesis. Assessment of the role played by lumbar facet joint morphology. Spine. 18(1):80–91.
- Hollenbeck JFM, Cain CM, Fattor JA, Rullkoetter PJ, Laz PJ. 2018. Statistical shape modeling characterizes three-dimensional shape and alignment variability in the lumbar spine. J BiomechJ Biomech. 69:146–155. doi:10.1016/j.jbiomech.2018.01.020
- Holzapfel GA, and Stadler M. 2006. Role of facet curvature for accurate vertebral facet load analysis. Eur Spine J. 15(6):849–856. doi:10.1007/s00586-004-0874-2
- Kalichman L, Suri P, Guermazi A, Li L, Hunter DJ. 2009. Facet orientation and tropism: associations with facet joint osteoarthritis and degeneratives. Spine. 34(16):E579–E585. doi: 10.1097/BRS.0b013e3181aa2acb
- Kim HJ, Chun HJ, Lee HM, Kang KT, Lee CK, Chang BS, Yeom JS. 2013. The biomechanical influence of the facet joint orientation and the facet tropism in the lumbar spine. Spine J. Oct 13(10):1301–8. doi:10.1016/j.spinee.2013.06.025
- Kim NH, Lee JW. 1995. The relationship between isthmic and degenerative spondylolisthesis and the configuration of the lamina and facet joints. Eur Spine J. 4(3):139–44. doi: 10.1007/BF00298237
- Knapik GG, Mendel E, Bourekas E, Marras WS. 2022. Computational lumbar spine models: a literature review. Clin Biomech. 100:105816. doi: 10.1016/j.clinbiomech.2022.105816.
- Kumaran Y, Shah A, Katragadda A, Padgaonkar A, Zavatsky J, McGuire R, Serhan H, Elgafy H, Goel VK. 2021. Iatrogenic muscle damage in transforaminal lumbar interbody fusion and adjacent segment degeneration: a comparative finite element analysis of open and minimally invasive surgeries. Eur Spine J. 30(9):2622–2630. doi: 10.1007/s00586-021-06909-x
- Lavaste F, Skalli W, Robin S, Roy-Camille R, Mazel C. 1992. Three-dimensional geometrical and mechanical modelling of the lumbar spine. J Biomech. Oct 25(10):1153–64. doi:10.1016/0021-9290(92)90071-8
- Lo HJ, Chen CS, Chen HM, Yang SW. 2019. Application of an interspinous process device after minimally invasive lumbar decompression could lead to stress redistribution at the pars interarticularis: a finite element analysis. BMC Musculoskelet Disord. 20(1):213. doi: 10.1186/s12891-019-2565-5
- Love TW, Fagan AB, Fraser RD. 1999. Degenerative spondylolisthesis. Developmental or acquired? J Bone Joint Surg Br. Jul 81(4):670–674. doi:10.1302/0301-620X.81B4.0810670
- Masharawi Y, Rothschild B, Salame K, Dar G, Peleg S, Hershkovitz I. 2005. Facet tropism and interfacet shape in the thoracolumbar vertebrae: characterization and biomechanical interpretation. Spine. 30(11):E281–E292. doi: 10.1097/01.brs.0000164098.00201.8d
- Meakin JR, Gregory JS, Aspden RM, Smith FW, Gilbert FJ. 2009. The intrinsic shape of the human lumbar spine in the supine, standing and sitting postures: characterization using an active shape model. J Anat. Aug 215(2):206–11. doi:10.1111/j.1469-7580.2009.01102.x
- Meijer GJ, Homminga J, Hekman EE, Veldhuizen AG, Verkerke GJ. 2010 May 28. The effect of three-dimensional geometrical changes during adolescent growth on the biomechanics of a spinal motion segment. J Biomech. 43(8):1590–7. 10.1016/j.jbiomech.2010.01.028
- Meijer GJ, Homminga J, Veldhuizen AG, Verkerke GJ. 2011 Jun 15. Influence of interpersonal geometrical variation on spinal motion segment stiffness: implications for patient-specific modeling. Spine (Phila Pa 1976). Spine. 36(14):E929–35. 10.1097/BRS.0b013e3181fd7f7f
- Natarajan RN, Andersson GB. 1999. The influence of lumbar disc height and cross-sectional area on the mechanical response of the disc to physiologic loading. Spine. 24(18):1873–1881.
- Niemeyer F, Wilke HJ, Schmidt H. 2012. Geometry strongly influences the response of numerical models of the lumbar spine–a probabilistic finite element analysis. J Biomech. 45(8):1414–1423. doi: 10.1016/j.jbiomech.2012.02.021
- Noailly J, Wilke HJ, Planell JA, Lacroix D. 2007. How does the geometry affect the internal biomechanics of a lumbar spine bi-segment finite element model? Consequences on the validation process. J Biomech. 40(11):2414–2425. doi: 10.1016/j.jbiomech.2006.11.021
- Otsuka Y, An HS, Ochia RS, Andersson GB, Espinoza OríOríAs AA, Inoue N. 2010. In vivo measurement of lumbar facet joint area in asymptomatic and chronic low back pain subjects. Spine. 35(8):924–928. doi: 10.1097/BRS.0b013e3181c9fc04
- Panjabi MM, Goel V, Oxland T, Takata K, Duranceau J, Krag M, Price M. 1992. Human lumbar vertebrae. Quantitative three-dimensional anatomy. Spine. 17(3):299–306. doi: 10.1097/00007632-199203000-00010
- Panjabi MM, Oxland T, Takata K, Goel V, Duranceau J, Krag M. 1993. Articular facets of the human spine. Quantitative three-dimensional anatomy. Spine. 18(10):1298–1310. doi: 10.1097/00007632-199308000-00009
- Pavlova AV, Saunders FR, Muthuri SG, Gregory JS, Barr RJ, Martin KR, Hardy RJ, Cooper R, Adams JE, Kuh D, et al.Statistical shape modelling of hip and lumbar spine morphology and their relationship in the MRC national survey of health and development. J Anat. Aug2017;2312:248–259.doi:10.1111/joa.12631
- Rasoulian A, Rohling R, Abolmaesumi P. 2013. Lumbar spine segmentation using a statistical multi-vertebrae anatomical shape+pose model. IEEE Trans Med Imaging. 32(10):1890–1900. doi: 10.1109/TMI.2013.2268424
- Rathnayaka K, Sahama T, Schuetz MA, Schmutz B. 2011. Effects of CT image segmentation methods on the accuracy of long bone 3D reconstructions. Med Eng Phys. 33(2):226–233. doi: 10.1016/j.medengphy.2010.10.002
- Robin S, Skalli W, Lavaste F. 1994. Influence of geometrical factors on the behavior of lumbar spine segments: a finite element analysis. Eur Spine J. 3(2):84–90. doi: 10.1007/BF02221445
- Sciortino V, Pasta S, Ingrassia T, Cerniglia D. 2022 Aug 22. A population-based 3D atlas of the pathological lumbar spine segment. Bio Eng. 9(8):408. 10.3390/bioengineering9080408
- Sharma M, Langrana NA, Rodriguez J. 1995. Role of ligaments and facets in lumbar spinal stability. Spine. 20(8):887–900. doi: 10.1097/00007632-199504150-00003
- Shirazi-Adl A, Sadouk S, Parnianpour M, Pop D, El-Rich M. 2002. Muscle force evaluation and the role of posture in human lumbar spine under compression. Eur Spine J. 11(6):519–526. doi: 10.1007/s00586-002-0397-7
- Tang L, Hu Z, Lin YS, Hu J. A statistical lumbar spine geometry model accounting for variations by age, sex, stature, and body mass index. J Biomech. 2022 Jan. 130:110821. doi:10.1016/j.jbiomech.2021.110821
- Wang Y, Battié MC, Videman T. 2012. A morphological study of lumbar vertebral endplates: radiographic, visual and digital measurements. Eur Spine J. 21(11):2316–2323. doi: 10.1007/s00586-012-2415-8
- Zanjani-Pour S, Winlove CP, Smith CW, Meakin JR. 2016. Image driven subject-specific finite element models of spinal biomechanics. J Biomech. 49(6):919–925. doi: 10.1016/j.jbiomech.2016.02.025
- Zhou SH, ID M, AH M, Coombs RR, Hughes SP. 2000. Geometrical dimensions of the lower lumbar vertebrae–analysis of data from digitised CT images. Eur Spine J. 9(3):242–248. doi: 10.1007/s005860000140