
ABSTRACT
Digital pathology using whole-slide imaging (WSI) scanners aids pathologists challenged by diagnostic volume and novel diagnostic methods. Colour reproducibility of WSI scanners is crucial for accurate digital diagnoses. We propose an objective and quantitative method for evaluating colour reproduction in digital images of pathological specimens from two perspectives: true colour value reproduction and colour discrimination. We define 57 critical features for evaluation, extract tissue structures, and establish diagnostic criteria. Our method is unique and useful for clinical use. We tested a prototype scanner, and it satisfied all criteria for true colour value reproduction (all the colour samples corresponding to the selected tissue evaluation points were experimentally within the acceptable range) and colour discrimination (the colour difference ΔE2000 calculated from the corresponding colour sample combinations exceeded the lower permissible limit for the selected discrimination points). This evaluation method and WSI scanner can contribute to accurate colour reproduction in digital pathology.
Introduction
Pathological diagnosis is an important diagnostic tool for confirming a disease. Traditionally, pathologists have made diagnoses by observing pathological specimens using optical microscopes and have reported the results. Recently, owing to the decline in the number of pathologists compared to that needed, their work has become more challenging (Robboy et al. Citation2013). In addition, with the spread of personalised precision medicine, for example, the diagnostic skills required of pathologists are increasing (Vranic and Gatalica Citation2021). Digital pathology is expected to support pathologists facing these challenges by adopting digital techniques for pathological diagnosis.
Whole-slide imaging (WSI) scanners and related systems that optically scan pathology specimen slides and convert them into digital pathology images have been developed in recent years (Feldman Citation2017; Park et al. Citation2012; Higgins Citation2015). In WSI-based digital pathology, pathologists observe digital pathological images on a monitor; simultaneously, whole-slide images can be shared, and the diagnostic process is transparent on a digital platform. In addition, there is a trend towards using information technology in pathological diagnosis based on feedback from the observations of digital pathology images provided by pathologists. Such innovative process improvements are expected to solve these issues by reducing the individual burden of pathologists.
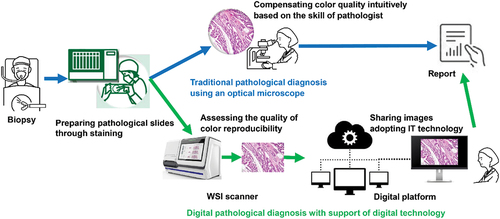
To put digital pathology into practical use, it is necessary to maintain the quality of the WSI at the level required for pathological diagnosis. In traditional pathological diagnosis using an optical microscope, imaging quality is not considered an important issue because pathologists make diagnoses by themselves while intuitively compensating for image quality. As this method depends on the skill of a pathologist, there are concerns that variations in image quality may affect diagnostic accuracy. In digital pathology, however, the image quality of a WSI system should be kept stable at the required level to homogenise the performance of pathological diagnoses based on a digital platform. In particular, colour reproducibility is one of the most important factors influencing WSI quality. Image quality is given higher importance because pathological specimens are generally stained to enhance the optical visibility of thinly sliced tissue. Haematoxylin and eosin staining methods are widely adopted for high-contrast observation of tissue structures, especially in tissue diagnosis. In pathological diagnosis, appropriate colour reproduction of staining conditions is crucial for accurate and homogeneous diagnosis. Therefore, assessing colour reproducibility corresponds to evaluating the ease of diagnosis due to differences in colour reproducibility, an essential feature of images displayed on a monitor. Our concept, described above, is shown in .
Figure 1. Conceptual comparison between the color management processes of traditional and digital pathological diagnoses.
The importance of colour reproducibility for digital pathology became widely recognised at the Summit on Colour in Medical Imaging held at the FDA White Oak Campus (Summit on Color in Medical Imaging Citation2013), particularly through a presentation about colour standardisation in digital microscopy (Color aspects and Color Standardization in Digital Microscopy Citation2013). Leveraging this opportunity, the Medical Imaging Working Group was formed at the International Colour Consortium (ICC Medical Imaging Working Group Citation2013), and some researchers have been actively studying and discussing colour imaging management for digital pathology. In particular, multispectral imaging methods have been developed to enable precise colour analyses and novel visual functions based on a quantitative physical approach (Image analysis technology for quantitative pathology Citation2016).
As a notable topic for practical application, the FDA (Citation2016) has established guidance recommending technical characterisation data for regulatory evaluation of WSI scanners. As an evaluation method for colour reproducibility at the system level, this FDA guidance provides a framework for evaluating the difference between the true value of the measured colour of a target slide and the colour output by the WSI scanner to be evaluated when the target slide is input. Moreover, the FDA provides information provided by the ICC as a practical reference for colour reproduction. In particular, the difference between the true value of the colour of an IT8 target transparent film target slide and the colour output by the WSI was evaluated when the target slide was inputted using the CIE-deltaE2000 as an index. This approach was reported as a method corresponding to the colour reproducibility evaluation framework of the FDA guidance (Shrestha and Hulsken Citation2014).
In addition to ‘reproducibility of true values’, as recommended in the FDA framework, in this study, we considered ‘ease of discrimination’ between two colours as an aspect of colour reproducibility, contributing to ease of diagnosis. Our method, based on these two perspectives, includes criteria defined from the perspective of a pathological diagnostic expert. This concept, which has rarely been adopted by other research institutions, makes our idea unique and useful for adapting WSI scanners for clinical use. Consequently, we propose a colour reproduction evaluation method and experimentally evaluate it on a prototype WSI scanner.
Materials and methods
Evaluation of color reproduction from two perspectives
The tissue structures necessary for diagnosis must be confirmed to be in a highly visible state before performing an accurate and homogeneous pathological diagnosis. This process requires a WSI system capable of delivering high colour reproducibility. We focused on ‘reproducibility of true value’ and ‘ease of identification’ as perspectives for evaluating the colour reproduction of digital pathology images acquired by a WSI scanner. We defined 57 specimens as critical features for pathological diagnosis in the evaluation process. We extracted several tissue structures essential for pathological diagnosis from these two perspectives and established diagnostic criteria based on medical expert knowledge.
The ‘reproducibility of true value’ refers to how closely a colour reproduced on the monitor matches the actual colour (true value). The closer the colour on the monitor is to the actual colour, the easier the diagnosis. This evaluation corresponds to the case with which the pathologist records the colours observed under the microscope as true values and recognises features important for diagnosis by the colours in the image reproduced on the monitor compared to stored colours. ‘Ease of identification’ refers to whether the difference between two colours presented on the monitor is reproduced in a way that is easy to identify, regardless of the actual colour (true value). The larger the colour difference is, the easier the diagnosis. This evaluation corresponds to the case where the pathologist recognises features important for diagnosis by the colour difference between two areas in the image reproduced on the monitor.
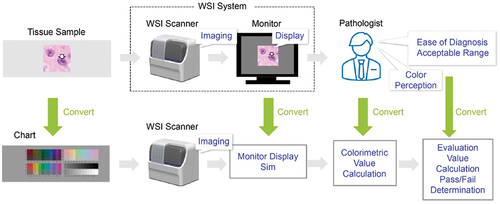
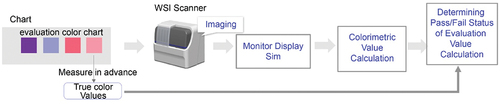
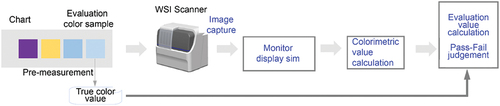
Digital pathology images are provided as shared information in a WSI system, and the colour reproducibility must be evaluated with objective quantitative values for reproducibility. Accordingly, we set up the evaluation as follows. First, instead of a pathology specimen, a colour chart was used as the imaging subject to enable a standard evaluation without colour variations due to the staining process. The colour displayed on the monitor was estimated via simulation based on a physical model so that it did not depend on individual monitoring differences. To ensure that colour perception did not depend on individual differences between pathologists, monitor display colours were expressed as colorimetric values based on standards. Subsequently, an acceptable range was set for the colorimetric values to evaluate whether the colour reproduction ability of the WSI system was appropriate. Moreover, whether the values were within this range was evaluated. The aforementioned setup is summarised in .
Figure 2. Configuration of the objective evaluation method for WSI system color reproduction.
Evaluation of true color value reproduction
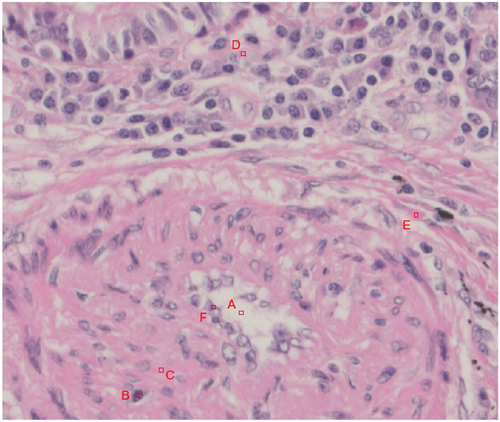
The true colour value reproduction evaluation method was used to determine the true colour value as the colour perceived by a person when they observed it through a microscope eyepiece. The L*a*b* values specified by the International Commission on Illumination (CIE Technical Report: Colorimetry Citation2004) were used as objective quantitative values for colour, where L* represents perceptual lightness and a* and b* represent chromaticity, corresponding to red‒green and yellow‒blue components, respectively. Our method evaluates colours by selecting features associated with colours of important factors in diagnosis, which is effective for assessing accurate, true colour value reproduction suitable for practical use. An expert engineer helped select such tissue features. The tissue features were extracted from the pathology specimen images and defined as evaluation points. As an example, illustrates the evaluation points set for the feature of a small artery. L*a*b* values were obtained for the features of tissues subjected to true colour quantification to quantify the colours objectively.
Figure 3. Example of an evaluation point set for the feature of a small artery. Evaluation points a through F were selected as candidates for evaluating the reproducibility of the true color values. (A. Angiocentric void, B. smooth muscle cell nucleus, C. smooth muscle cell cytoplasm, D. surrounding cell cytoplasm, E. connective tissue, F. endothelial cell nucleus).
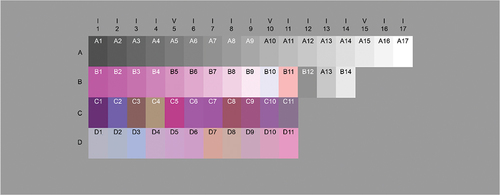
The proposed true colour value evaluation method enables a stable quantitative evaluation by using a chart of multiple colours as a substitute for the specimen slide with corresponding target true colour values. For this colour chart, a set of colour samples approximating the IT8 chart (ISO 12641 Citation1997) was created. This calibration chart can be used for image input devices. This approach enables the selection of colour samples close to the colour of the evaluation points to develop prototype slide charts that can be placed on the microscope stage. illustrates this slide chart. Ideally, colour samples should be selected to obtain the same evaluation results as the evaluation points of the pathology specimen. However, as the spectral characteristics of HE-stained pathology specimens and colour films differ substantially, colour samples with similar L*a*b* values were selected for this method. Therefore, the L*a*b* values of the colour samples approximating the IT8 chart were obtained from experimental measurements, and the colour samples with the smallest difference in colour from the selected tissue feature evaluation points were selected for evaluation. The colour difference measures the magnitude of the difference. In this study, the CIE ΔE2000 (CIE Technical Report: Improvement to industrial color-difference evaluation Citation2001) was used. However, because the transmittance of the colour chart was uniformly lower than that of the pathology specimen, the gain was adjusted when measuring the colour difference.
Figure 4. Prototype slide chart.
The colour samples of the slide chart were imaged by a WSI scanner and displayed on a monitor. In this objective evaluation method, the monitor display colour by the WSI system was replaced with a value estimated by simulation to ensure that ‘the difference monitor performance caused by manufacturing process do not affect the evaluation. For this purpose, the input/output characteristics of the monitor were measured in advance, and the data were used as parameters for the simulation. L*a*b* values were used as a quantification index for human perception of colour from monitors, and the colour difference ΔE2000 was used as an index to evaluate the difference from the true colour value. The colour difference ΔE2000 between the L*a*b* value, which is the true colour value of the colour sample, and the simulated L*a*b*, which is the monitor display colour of the colour sample image captured by the WSI scanner, was calculated using the aforementioned method. This difference was used as the evaluation value.
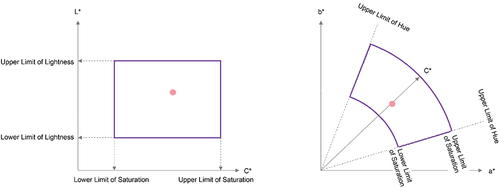
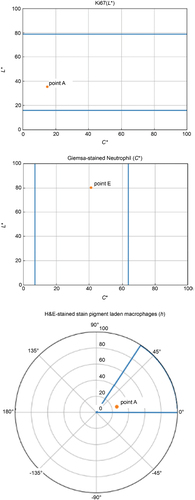
An acceptable range of colour differences that can be diagnosed by a pathologist for each evaluation point of the tissue feature must be established. Therefore, pathological specimens containing tissue features considered important for diagnosis were captured using a WSI scanner, and images for evaluation were created using these original images and by slightly modulating their colour. An expert evaluated these images to define the acceptable range for each evaluation point. This acceptable range was used to determine whether the WSI system passed or failed in terms of true colour value reproduction. In particular, the following method was used. First, consider a space of lightness L*, chroma C*ab, and hue hab (CIE Technical Report: Colorimetry Citation2004), defined by adding the prescribed transformations to the quantitative colour L*a*b* values. In this 3-dimensional space, the acceptable range of each evaluation point established by the expert was defined by setting upper and lower limits along each spatial axis of L*C*h. In particular, when the L*C*h value of the colour sample was within the acceptable range, the WSI system passed. shows a conceptual diagram of the acceptable ranges for the true colour evaluation set through this method.
Figure 5. Conceptual diagram of acceptable ranges set in L*a*b* (L*c*h) space for evaluating the reproducibility of true color values. Left: Acceptable range defined by the upper and lower limits along each axis in the cross-section of lightness L* and chroma C*. Right: Acceptable range defined by the upper and lower limits for hue hab and chroma C*ab in the a*b* plane, respectively.
summarises the steps of the above process.
Figure 6. Overall configuration of the method for evaluating the reproducibility of true color values.
Color discrimination evaluation
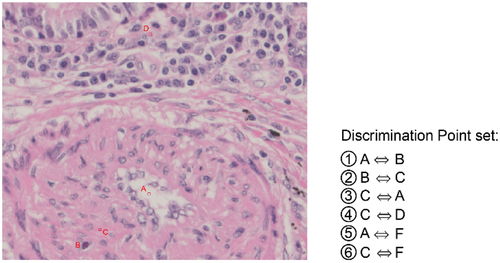
The set of colours required to identify the features important for diagnosis was determined using discrimination points on the image of the pathology specimen slide based on expert guidance. In particular, the discrimination points were defined by combining two evaluation points extracted from the set in the true colour value reproducibility evaluation. For small arteries, candidate discrimination points such as A⇔B and B⇔C were extracted using evaluation points, as shown in . These evaluation points for colour discrimination were defined using candidate discrimination points by limiting the evaluation points to features where colour was crucial for diagnosis and the colour area was somewhat large and uniform.
Figure 7. Example of a discrimination point set for a small artery feature.
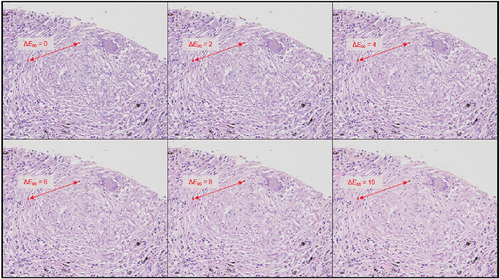
The evaluation index for colour discrimination was defined as the colour difference ΔE2000 between two discrimination points displayed on the monitor. The larger the colour difference is, the easier the diagnosis. A lower limit for the acceptable range at which diagnosis is possible must be defined for pass-fail judgement. This limit was set according to the evaluation of an expert, as in the case of the reproducibility evaluation of true colour values. The image used for evaluation was created by modulating the colour difference between the two evaluation points corresponding to the discrimination point, with an image obtained similar to the evaluation image for the acceptable range in the reproducibility evaluation of the true colour value as the original image. The actual method of modulating the colour difference is to modulate the colour of one point along a straight line connecting the two points in the L*a*b* colour space such that the colour difference between the two points is equally small. In this case, the colours close to each of the two points are simultaneously modulated because changing only the colours of the two points would make them look strange or feel difficult to distinguish from each other in the image, increasing the complexity involved in the evaluation. shows an image evaluation example.
Figure 8. Overall configuration of the color discrimination evaluation method. The figure shows discrimination between the color of the cell nucleus within the granuloma and the color of the fibrous tissue outside the granuloma. Modulation was conducted so that the difference between the two colors near the center increased from left to right in the upper row and then left to right in the lower row.
Each of the two evaluation points defining the discrimination point was mapped to a colour sample in a similar manner to the evaluation of true colour value reproducibility. Similarly, the gain was adjusted to compensate for the low transmittance of the colour chart. A discrepancy existed between the actual discrimination point and the true colour value of the corresponding colour sample; thus, this evaluation corrected this discrepancy while setting the lower limit of the acceptable range for the colour sample.
The colour discrimination evaluation based on the above method was performed as follows. Two sets of colour samples corresponding to the discrimination points contained in the colour chart were imaged by the WSI scanner, and the average of the colours in each colour sample image area was calculated as a quantitative value. For this set of quantitative colour values, a pass-fail judgement was performed after estimating the monitor display colour through simulations and calculating the colorimetric and evaluation values. The colour difference of the estimated monitor display colour of the colour sample set was calculated as the evaluation value, and the colour difference of the set colour sample set was compared with the minimum permissible limit to judge a pass-fail. illustrates the process followed.
Figure 9. Overall configuration of the color discrimination evaluation method.
Experiments
Experimental setup and conditions
Using the two-colour reproduction evaluation methods proposed in this study, we experimentally evaluated a prototype WSI scanner built by Evident (Japan). The slide chart was prototyped at Fujifilm Imaging Systems and was created by inserting a silver halide film for printing, developed by RGB laser exposure of the colour chart layout pattern, between the glass slide and cover glass. A 27-inch monitor was used in sRGB mode.
Features of tissues of diagnostic importance were extracted and listed following the staining method and appropriate magnification. In addition, pathology specimen slides containing each tissue feature were prepared, and evaluation points corresponding to each tissue feature were defined to evaluate true colour values. Discrimination points were defined by combining two evaluation points to evaluate colour discrimination.
The white colour and spectral radiance data of the light source must be defined to calculate the CIE L*a*b* values required as objective quantitative values of colour for colour samples. In this experiment, a transparent region of glass from the pathology specimen with no tissue present was selected for analysis. A light-emitting diode light source (Evident BX53F2, United Kingdom) was used, and the light emitted from the eyepiece was measured via introduction into a spectroradiometer (Photo Research PR670) using a fibre probe. The spectral radiance data of the light source were measured over the wavelength range of 380 nm to 780 nm at intervals of 2 nm. Moreover, the spectral transmittance of the evaluation points corresponding to the characteristics of the tissue was measured to obtain their L*a*b* values. In this regard, spectral images of the tissue specimens were obtained to determine the spectral transmittance. A monochrome camera (IMX174LLJ-C) and a liquid crystal tunable filter (Phototechnica VariSpec) were used to capture images in the wavelength range from 400 nm to 720 nm at wavelength intervals of 5 nm. The spectral transmittance at the evaluation points was calculated from the spectral radiance data of the evaluation points extracted from the obtained spectral images and the spectral radiance data of the light source. The wavelength intervals of the data obtained from the tissue specimen spectral transmittance data and the light source spectral radiance data differed. Accordingly, in the calculation of L*a*b*, each data point was interpolated with a wavelength interval of 1 nm for the spectral transmittance data of the tissue specimen. The same values were extrapolated to the short and long wavelength sides at 380 nm to 780 nm, respectively.
Experimental results
We evaluated the WSI scanner’s reproduction of true colour values following the method described in Section 2.2. The colour samples associated with the evaluation points corresponding to the tissue features were imaged with a WSI scanner to obtain a RAW image. After appropriately adjusting the gain in the RAW images, the images were converted into RGB colour images by digital image processing. The processed images were used as the image data captured by the WSI scanner, and the monitor display colour was estimated by simulations based on a model set up in advance and expressed in L*a*b* values. To compare the data with the true colour values of the colour samples, the colour difference ΔE2000 was calculated from the two L*a*b* values and used as the evaluation value. Furthermore, the L*a*b* values obtained from the monitor display simulation of the colour samples were converted into L*C*h values. The values were compared to the acceptable ranges set for each colour sample in advance to determine whether the WSI scanner passed or failed. shows the evaluation results of the true colour value reproduction of the WSI scanner prototype according to the proposed method. The true colour value reproduction was within the acceptable range for all colour samples corresponding to the selected tissue evaluation points. As such, the WSI scanner passed the performance evaluation test from the true colour value reproduction perspective.
Figure 10. Results of the true color value reproduction evaluation experiment for the WSI scanner prototype.
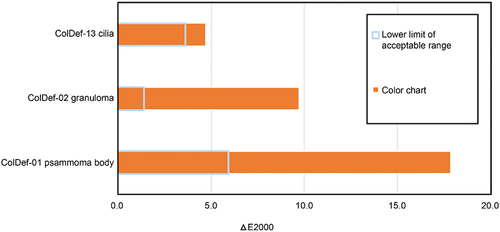
Furthermore, we evaluated the WSI scanner from the colour discrimination perspective using the method described in Section 2.3. In the evaluation of colour discrimination, discrimination points were defined by selecting two of the evaluation points for colour reproduction evaluation. The estimated L*a*b* values of the monitor display of the colour samples corresponding to each of the evaluation points were obtained by the same method as in the experiment for true colour value reproduction evaluation. The estimated L*a*b* values of the colour sample corresponding to its two component evaluation points were obtained for each discrimination point. The difference in ΔE2000 between these two colours was calculated as the evaluation value. The WSI scanner passed if the colour difference ΔE2000 found following this process was greater than the predefined lower limit of the acceptable range. shows the results of the colour discrimination evaluation of the WSI scanner prototype. The colour difference ΔE2000 calculated from the corresponding colour sample combinations exceeded the lower permissible limit for all the selected discrimination points. As such, the WSI scanner passed the performance evaluation test from the perspective of colour discrimination.
Figure 11. Results of the color discrimination evaluation experiment for the WSI scanner prototype.
Discussion
Methods for evaluating tissue structures for pathological diagnosis are essential. Thus, we propose colour reproduction evaluation from two perspectives for digital imaging of pathology specimens. The results suggest that the proposed method effectively evaluates the colour reproduction of WSI scanners. This section discusses current issues and considers improvements for increasing reliability.
Regarding true colour value reproduction, a highly reproducible method was defined by replacing the measurement of evaluation points of tissue structures important for pathological diagnosis with colour samples and by simulating the monitor display to reduce the effect of individual monitor differences. Regarding reproducibility evaluation, the effect of the imaging variability of the WSI scanner is maintained at a sufficiently low level by optimising the exposure conditions and white balance in each instance of imaging. The spectral measurement of the evaluation points of the pathological specimen and the corresponding colour samples and the process of obtaining the quantitative colour values from the measured values are factors affecting accuracy. However, the results indicate that the accuracy of this method is sufficient compared to the acceptable range for evaluating the reproducibility of true colour values.
The current approach requires medical expertise to establish evaluation criteria, challenging the implementation of the method. The setting of the acceptable range for defining a pass or fail true colour value criterion is complex because of the focus on local evaluation points alone. Moreover, comparisons with surrounding colours and structures may affect judgement. Therefore, in our experiment, we asked the experts to evaluate the colour reproduction of the evaluation points by focusing on the appropriateness of the colour reproduction of these points rather than on the acceptability of the points for diagnosis. As the evaluation points on the pathological specimen and the spectral characteristics of the colour sample differed, we set the acceptable range by referring to the quantitative colour value L*a*b and correcting for the discrepancy between the two. A discussion on the validity of this approach is a future task.
Similar issues can be raised concerning colour discrimination evaluation. Although the expert was asked to set a lower limit for colour difference while focusing on the two evaluation points constituting each discrimination point, the effect of surrounding colours other than the evaluation points might be nonnegligible. This trend may be attributed to the pathological diagnosis being performed by integral observation of tissue conditions over a certain range instead of considering only two evaluation points. In this experiment, when understanding the reality of such a pathological diagnosis, we asked the expert to cooperate in assessing the method following the intended purpose of this methodology.
As described above, the proposed method exhibited excellent reproducibility and accuracy as an objective and quantitative colour reproduction evaluation method. Future work will focus on improving the proposed method by reflecting medical findings in the evaluation criteria.
Conclusion
We proposed two approaches for evaluating the colour reproduction of WSI scanners considering two perspectives: true colour value reproduction and colour discrimination. These are objective and quantitative perspectives for evaluating the colour reproduction of WSI scanners with excellent reproducibility and accuracy. Moreover, these criteria for evaluating the colour information of tissue, which is crucial for pathological diagnosis, were assessed by a pathological expert’s subjective evaluation. As a result of evaluating the colour reproduction of a WSI scanner prototype using these two approaches, all the predefined evaluation criteria were clarified. These methods effectively demonstrated that the colour reproduction characteristics of WSI scanners are appropriate for pathological diagnosis and can be practical in managing the accuracy of colour reproduction in pathological diagnosis using digital images.
Authors contributions
A. Kubota, M. Shibata, and T. Yoneyama conceived and planned the experiments. A. Kubota and M. Shibata carried out the experiments and analysed the data. S. Kikuchi and A. Kubota drafted the manuscript. T. Yoneyama supervised the project.
Acknowledgments
This study was conducted with the cooperation of Sept. Sapie and Fujifilm Imaging Systems. We would like to take this opportunity to express our deep appreciation for your support.
Disclosure statement
No potential conflict of interest was reported by the author(s)
Data availability statement
The datasets used and/or analysed during the current study are available from the corresponding author on reasonable request.
Additional information
Notes on contributors
Akihiro Kubota
Akihiro Kubota is an image-processing engineer with four years of experience developing microscopic imaging systems, including microscope cameras. He worked at Olympus for three years and at Evident for one year. He received a Master’s degree in optoelectronics from Keio University in Japan.
Motohiro Shibata
Motohiro Shibata is an image-processing engineer for microscopic imaging systems. He worked at Olympus and Evident for more than 10 years. He received a Master’s degree from the University of Electro-Communication.
Susumu Kikuchi
Susumu Kikuchi was engaged in R&D on image processing at Olympus for more than 30 years through his career as a general manager and chief fellow and is currently appointed as a technology supporter at Evident. He completed a Master’s degree at Tohoku University and received a Ph.D. from the Tokyo Institute of Technology.
Takashi Yoneyama
Takashi Yoneyama holds a Master’s degree from the Musashi Institute of Technology. He has been involved in microscope development for more than 30 years and has worked as a project manager.
References
- CIE Technical Report: Colorimetry. 2004.
- CIE Technical Report: Improvement to industrial color-difference evaluation. 2001.
- Color aspects and Color Standardization in Digital Microscopy. 2013. Yukako Yagi. http://www.color.org/events/medical/Yagi.pdf.
- FDA. 2016. Technical Performance Assessment of Digital Pathology Whole Slide Imaging Devices - Guidance for Industry and Food and Drug Administration Staff.
- Feldman M. 2017. Clinical Studies DeNovo Philip’s Intellisite Pathology System. America: University of Pennsylvania.
- Higgins C. 2015. Applications and challenges of digital pathology and whole slide imaging. Biotech Histochem. 90(5):341–9. doi: 10.3109/10520295.2015.1044566.
- ICC Medical Imaging Working Group. 2013. International Color Consortium. https://www.color.org/groups/medical/medical_imaging_wg.xalter.
- Image analysis technology for quantitative pathology. 2016. Masahiro Yamaguchi. https://www-oid.ip.titech.ac.jp/pg105.html.
- ISO 12641. 1997. Graphic technology — prepress digital data exchange — colour targets for input scanner calibration.
- Park S, Pantanowitz L, Parwani AV. 2012. Digital imaging in pathology. Clin Lab Med. 32(4):557–584. doi: 10.1016/j.cll.2012.07.006.
- Robboy SJ, Weintraub S, Horvath AE, Jensen BW, Alexander CB, Fody EP, Crawford JM, Clark JR, Cantor-Weinberg J, Joshi MG, et al. 2013. Pathologist workforce in the United States: I. Development of a predictive model to examine factors influencing supply. Arch Pathol Lab Med. 137(12):1723–1732. doi: 10.5858/arpa.2013-0200-OA.
- Shrestha P, Hulsken B. 2014. Color accuracy and reproducibility in whole slide imaging scanners. J Med Imag. 1(2):027501. doi: 10.1117/1.JMI.1.2.027501.
- Summit on Color in Medical Imaging. 2013. International color consortium. https://www.color.org/events/medical/medical_summit_2013.xalter.
- Vranic S, Gatalica Z. 2021. The role of pathology in the era of personalized (precision) medicine: a brief review. Acta Med Acad. 50(1):47–57. doi: 10.5644/ama2006-124.325.