
 ?Mathematical formulae have been encoded as MathML and are displayed in this HTML version using MathJax in order to improve their display. Uncheck the box to turn MathJax off. This feature requires Javascript. Click on a formula to zoom.
ABSTRACT
Advancements in technology has accelerated the evolution of bone age assessment (BAA) methodologies, one of which is deep learning algorithms, which overcome the drawbacks of conventional approaches. In spite of excellent effectiveness of deep neural networks in detection of the correct class for bone age, they have a significant degree of complexity due to the numerous parameters they employ for each region of interest (ROI). In this paper, we propose a BAA method using a hybrid knowledge distillation (KD) paradigm in order to conquer this difficulty by mapping different ROIs into a single ROI. In this regard, the student receives knowledge from a teacher network that has been pre-trained on six ROIs including bones of five fingers and the wrist, transfers the knowledge of its final response layer and internal layers to the student. Then, six student models each of which is constructed based on just one of these ROIs, while receiving the information of the teacher model. Empirical results on digital hand atlas report that our student model trained on one ROI obtains 95% accuracy on 19 classes of bone age.
1. Introduction
In recent years, bone age assessment (BAA) which is one of the significant medical measurements for bone maturity in radiological estimation, particularly in paediatric radiology has received a lot of attention. It detects the difference between bone age and chronological age, which could be a sign of anomalies in skeletal growth (Liu et al. Citation2019). BAA can correctly indicate level of maturity in human because bone age is a major indicator of the actual human growth, and the human skeleton is continuously growing (Bui et al. Citation2019). Paediatric endocrine problems and growth abnormalities are frequently diagnosed with BAA. Furthermore, a precise skeletal age assessment facilitates the estimation of height in adolescents, and diagnoses a number of diseases, including idiopathic dwarfism and early puberty (Ren et al. Citation2019; Deshmukh and Khaparde Citation2022). The BAA technique can help effectively in other similar research like calculating bone fracture risk through evaluation of cortical bone fracture resistance curves (Liu et al. Citation2019). The most popular approach to identify the level of skeletal maturity is the analysis of the left hand and wrist X-ray images due to its low operational cost, short exposure time for the subject to X-rays, and simplicity (An Ding et al. Citation2020; Saini et al. Citation2021). Traditionally, the Greulich-Pyle (GP) and Tanner-Whitehouse (TW) methods have been used to determine the age of bones. The GP method compares an X-ray image of a patient with an atlas made up of a number of standard bone age images to identify the patient’s skeletal age. The TW approach, in contrast, uses a scoring system that evaluate the degree of skeletal maturity in certain region of interest (ROI) in the bones of the hand and wrist. Depending on the maturity levels, a numerical score is then given to each ROI, and finally these scores are added to determine the overall maturity score. Despite the simplicity of the GP, and accuracy of TW, they both depend on the expertise of radiologists, and there is always a substantial intra and inter-observer variability (Simu et al. Citation2017; Chen et al. Citation2020).
Ongoing progress in computer technology accelerates the development of techniques resolving these problems; thus, numerous automated BAA approaches have been proposed based on image processing and computer vision techniques (Mouloodi et al. Citation2020; Salim and Ben Hamza Citation2021; Rzecki et al. Citation2021). They often deal with BAA as a classification or regression problem containing fundamental stages as hand segmentation, ROI detection, feature extraction and classifier or regressor model (Liu et al. Citation2019). Deep neural network methods especially convolutional neural networks (CNNs) are one of the promising solutions for a variety of medical image analysis applications so as it can be advantageous to BAA issue. To address BAA problem, a number of deep learning-based works have been introduced recently that learn distinguished attributes from a collection of training images automatically (Bui et al. Citation2019; Liang et al. Citation2019; Wu et al. Citation2019).
In Bui et al. (Citation2019), a deep learning-based technique is presented by combining the TW3 and CNN based on extracted ROI. CNNs are trained to learn the maturity stage from each ROI of the TW3 approach in order to extract the feature engineering. A deep learning strategy for BAA is suggested in Han and Wang (Citation2020), where a Resnet extract features from 17 important regions in the left-hand X-ray image, and the CNN is utilised for automated determination of the bone age. An Ding et al. (Citation2020) suggest an automatic BAA approach from images of carpal radiography by extracting 14 ROIs, and classifying with a CNN. In Lu et al. (Citation2021), 14 bones from the left hand are chosen as ROI, and a trained CNN determines the likelihood that each bone is in a particular developmental stage using each bone’s ROI. Chen et al. (Citation2020) introduce a TW3-based BAA system using deep neural networks that classify levels of the skeletal maturity by extracting 13 ROIs. Although the aforementioned approaches attain high accuracy, they have complicated architecture as utilising multiple convolutional and pooling layers in their structure which impose a huge processing power on BAA systems because of computing millions of parameters. This volume of calculation requires high computational capacity and large storage that bring about difficulties in internet of medical things (IoMT). Since IoMT devices have constricted computing power and low capacity memory, these deep learning based BAA methods cannot be implemented on them. To deal with these constraints, several compression and acceleration techniques have been introduced recently like parameter pruning and sharing, transferred compact convolutional filters and knowledge distillation (KD). KD is one of the effective options among them in which a student network is trained under monitoring a progressive teacher network. Indeed, the student attempts to emulate the teacher’s action in a straightforward way in KD framework with least amount of loss (Fu et al. Citation2021; Sepahvand and Abdali-Mohammadi Citation2022).
This paper presents a novel BAA method with the help of KD paradigm using several ROIs extracted from X-ray images. To this end, a teacher network that is trained ahead with different ROIs and offers highly accurate results, supervises the training mechanism of a student network which is performed using one ROI with capability of easy deployment on healthcare internet of things (IoT). The teacher model is composed of advanced CNN design, whereas the student model is formed of a plain CNN structure makes it suitable for implementing in IoMT real time devices. Teacher model as source of knowledge provides information about different ROIs for the student in knowledge transfer phase in order to have more similar acting like the teacher by conveying knowledge to the student. In this paper, the transferred knowledge is a combination of the final response layer and intermediate feature map knowledge which result in performance improvement. Several tests are conducted on digital hand atlas (DHA) Database for evaluating our proposed method one of which is the complexity comparison between the teacher and the student model. This dataset is a comprehensive evaluation tool for automated bone age estimating methods which consists of digital left hand radiographs collected from children between the ages of 0 and 18 and different races. Outcomes reveal that student model estimate bone age with average accuracy of 85%, which is slightly less accurate than teacher models but far less complex. Other findings demonstrate our method’s superiority over other cutting-edge BAA techniques based on deep learning. Finally, the main contributions in this study are listed below.
• Developing a novel BAA method that employs KD paradigm with the minimum accuracy reduction rather than high complicated deep neural network models.
• Using feature maps from intermediate layers in combination with final layer output in teacher model in order to use as new knowledge that is conveyed to student model.
• This model is appropriate for deploying in IoMT due to its great accuracy and lightweight structure.
The rest of the paper is arranged as follows. Section 2 reviews recent studies carried out in BAA using deep neural networks. In Section 3, our proposed method is explained in particularity, while in Section 4, the experimental results are related. Finally, a conclusion is given in Section 5.
2. Related work
BAA using radiographic images of the left wrist is an important subject in machine learning due to its simplicity and numerous ossification centres. It has many applications, such as diagnosing growth disorders, human trafficking and competitive sports (Crawley Citation2007). In recent years, deep learning has presented various image processing algorithms, leading to major breakthroughs in related practical fields, such as medical imaging. In BAA with radiographic images, deep learning has overcome the need for expert knowledge and manual feature extraction with remarkable results. BAA studies based on the deep learning algorithm are explained in the following. In He and Jiang (Citation2021), a compression module with 15 convolution layers and 4 pooling layers for big data compression and combined SE (squeeze-and-excitation) and ResNet with over 16 feature extraction and classification layers has presented. Spampinato et al. (Citation2017) have introduced a 15-layer convolutional network called BoNet for BAA. Both methods (Spampinato et al. Citation2017; He and Jiang Citation2021) have compared the proposed networks’ performance with pre-trained networks such as VGG, R-CNN, GoogLeNet and OxfordNet, demonstrating the proposed methods’ superiority. In Li et al. (Citation2022), an unsupervised learning method has been used with convolution layers to extract the largest area as the hand region. Then, the MobileNetV3 model was implemented for feature extraction and age detection as the head and backbone of multi-layer perceptron prediction. The model proposed in Deshmukh and Khaparde (Citation2022) covers three main stages: (a) segmentation using Otsu’s method, (b) feature learning based on Faster R-CNN and (c) classification using the RNN algorithm. The method in Salim and Ben Hamza (Citation2021) used a Mask R-CNN network for segmentation by first drawing a bounding box around the hand image. The proposed BAA model uses the VGG-19 CNN. Although none of these methods segmented hand components, segmenting the different parts of the hand image and using more networks and layers can help extract higher-level features and improve learning from data. In An Ding et al. (Citation2020) and Lu et al. (Citation2021), 14 ROI (finger and wrist joint) ossification centers from the hand image have been extracted in the preprocessing stage. After extracting the joints, An Ding et al. (Citation2020) used the pre-trained VGG-19, GoogleNet and AlexNet to classify models. For classification, the proposed method in Lu et al. (Citation2021) has used an AlexNet network to check the growth state of each ROI and determine bone age based on the total score of the 14 ossification centers and the age comparison table. Studies in Bui et al. (Citation2019) and Son et al. (Citation2019), Chen et al. (Citation2020) have used Faster R-CNN to segment and extract the sensitive ossification regions in hand images. Bui et al. (Citation2019) have employed the Inception architecture to extract six ROI regions and has investigated the growth state of each by integrating three continuous convolutions and max-pooling layers, a global average pooling layer, and two logits and softmax layers. For final age detection, each Inception network sent 1536 neurons from the last feature map as input for the support vector regression (SVR) network for age estimation. Chen et al. (Citation2020) have classified the R-CNN network’s output vectors using a ST-Resnet network. In Han and Wang (Citation2020), the features have been extracted and then the age of each ROI has been determined using a VGG-13 network, and the final results were obtained by an ensemble between VGG models using voting.
Segmenting the different parts of hand image and using deep learning models separately for each part has improved learning from data and the accuracy of models. In addition to improving accuracy, the greater number of neural networks has significantly increased the number of parameters and the model implementation complexity. For example, study in Son et al. (Citation2019) has used 13 VGG-13 networks for extracting 13 ROIs for age detection; A VGG-13 network with 112 112 input images has
generated parameters. By using double precision storage (8-byte) for each sample, the volume of this model equals
MB, or about
MB for each ROI segment. This size increases further for larger images, more ROIs and deeper networks. Thus, although implementing BAA methods based on segmentation and deep learning can improve feature extraction and remove redundant image areas while providing greater accuracy than models without preprocessing and segmentation, they are inadequate due to their massive number of parameters and large computational burden. It is important to note that new fields such as IoMT and edge intelligence have tried to distribute some of the computational and recognition process to smartphones (with limited computing power) for efficient server use. However, this is infeasible with deep learning models due to their large size. represents some of the BAA methods that have used deep learning approaches while their advantages and disadvantages are given, too.
Table 1. Review of some recent BAA methods.
3. Proposed method
3.1. Preprocessing
In this section, we will describe all the steps of selecting six ROIs from the X-ray hand images in detail. First of all, the input image () is converted to the binary ones by applying a threshold based approach on it, according to EquationEquations 1(1)
(1) and Equation2
(2)
(2) . The threshold (Tx,y) is defined as the average intensity of the image, and then binary image (B) is achieved by comparing each pixel of the image to the threshold ().
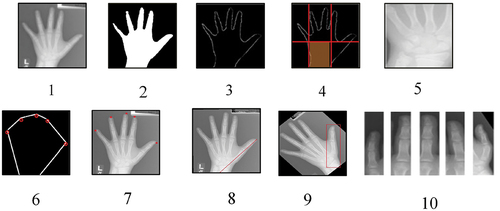
Figure 1. Steps of six ROIs’ extraction from an X-ray image from DHA database.
In these equations, and
are height and width of the image, respectively and
is the pixel intensity. In the second step, hand part is extracted from image B with regionprops MATLAB function and then the largest region is obtained which belongs to hand. Next step aims to extract wrist bones region in such a way that first edges of the image B is detected using Sobel edge detector and the coordination of edges is stored in a vector (). Next, Hough algorithm is applied, and then a straight line is drawn from the middle of the wrist while rotating the image relative to this line so as to obtain hand image in a straight direction. At last, two lines are drawn vertically, parallel to the edges of the wrist, and a horizontal line is then drawn to the center of the hand that segments the hand (). Lastly, the wrist segment is elicited from these segments (). In the last step, finger ROIs are extracted using convex hull algorithm. In this algorithm, hand is converted to a polygon that fingertips are located at the vertices of the convex region (), and to determine their coordinates, the coordinates of the vertices of the convex region must be determined. For this purpose, a line slope calculation idea is utilised in such a way that coordination of convex regions is kept in a vector, and then line slope of consecutive points are calculated and store in a vector likewise. Points with maximum slope are fingertips or so close to the fingertips (). In the end, two points are specified as marker points from the fingertip to the center of the hand or from the fingertip to the center of the wrist, and a line is drawn between these two points (). Then, the image is rotated on the basis of this line to pose the intended finger in a straight position (). The region associated with each finger is identified according to the fingertip’s coordinate. This process is repeated for all five fingers. Finally, when all ROIs are determined, cropping is performed on the image B to extract ROIs ().
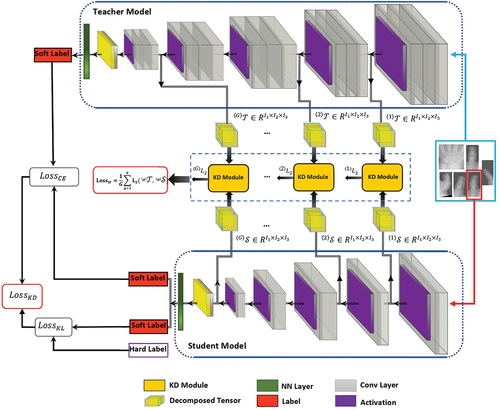
3.2. KD module
The design of the KD model used in BAA using DHA database is depicted in . There are a teacher model consists of an advanced CNN with convolution layers and a simple student model with
convolution layers in its CNN network, both of which followed by a fully connected layer and a softmax layer. While the teacher has been trained by six ROIs extracted from DHA images beforehand, the student will be trained with one of these extracted ROI. In KD, the student model attempts to emulate the teacher behavior so that provides comparable performance with respect to the teacher model besides using lightweight architecture. This can be accomplished by using the information of the teacher network known as dark knowledge, during training which is transmitted to the student model as a procedure called knowledge transfer. As it can be observed from the figure, two different types of knowledge, i.e. response-based and feature-based are combined and transferred from the teacher to the student, and at last the total error of the method is defined by a hybrid error comprises response-based KD loss
and the feature-based KD loss
that is shown in EquationEquation (3).
(3)
(3) In this equation, gamma is a hyper-parameter that controls the relative importance of
and
coefficients. The two following subsections analyse the performance of the proposed method in terms of each of these losses.
Figure 2. Diagram of student’s learning procedure based on hybrid KD model.
3.2.1. Response-based KD loss
The objective behind response-based knowledge is to directly transfer the output of the last layer such as soft targets, which come in the form of a logit vector, to the student side in order to mimic the teacher model’s final prediction. Thus, to measure how well the student can imitate the teacher’s manner, distillation loss is computed as:
represents the discrepancy in the logits between the student and teacher models that is formulated as:
and
indicate the likelihood that input x matches to the
th class in the teacher and student network, respectively, which are calculated through a softmax function as:
Where and
refers to the logit vector of teacher and student for the
th class, correspondingly. The teacher model uses
to predict soft targets which contains the dark knowledge used as a supervisor to transmit knowledge to the student. Unlike hard targets (ground-truth labels) that are used in conventional classification and feature on-hot coding, soft targets are created by dividing hard targets by a controlling variable called temperature (T), where a greater temperature results in a softer probability distribution among classes. In particular, the probability for each class would be identical by increasing T to infinity, and the soft targets change into hard labels as T nears to zero value (Hinton et al. Citation2015). Therefore,
will be achieved by cross-entropy loss function according to EquationEquation 5
(5)
(5) which measures the distance between the teacher and student’s logits in the final layer. Distillation conveys valuable information to the student by the teacher through the logits comparison with higher values of
. In addition to soft targets, the ground-truth label is important for improving the student model’s accuracy. So, the student’s error
is considered in distillation loss
, and is calculated by the cross-entropy loss between the soft error of the student and the hard target as below:
Where is the label of the input x, and
is calculated as EquationEquation 6
(6)
(6) except that here the value of T is considered 1. Back to EquationEquation 4
(4)
(4) ,
and
are calculated separately and then integrated with each other by a hyper-parameter
. It regulates the proportion of each of the two coefficients’ effect.
3.2.2. Feature-based KD loss
Deep neural networks have performed well in learning features at different levels of their internal layers by increasing abstraction. This is known as representational learning; Therefore, both the output of the last layer and the output of the intermediate layers, i.e. feature maps, can be used as knowledge to supervise the training of the learner model. In particular, knowledge based on feature extraction from intermediate layers is a good generalisation of response-based knowledge. Especially for training shallow networks by deep networks. The teacher model consists of number of layers and the student model consists of
number of layers. From both teacher and student models, the number
of the selection layer and their feature mapping matrix are extracted. The knowledge distance of these layers is checked with each other and the optimisation function of this method tries to minimise this distance.
For teacher and student deep neural networks, which are composed of and
layers, respectively, the output of each layer is transferred to the next layer. If the output of each layer is a function of
, then the output of the final layer for each of the models is equal to EquationEquation 9
(9)
(9) :
where and
refer to the bias and weight tensor of the xth layer, respectively. The structure of tensors is complicated and difficult to calculate the difference between tensors due to their high dimensions. For this reason, the proposed model tries to break down this complexity by using Tucker’s decomposition and create a simpler example of tensors for faster calculations. To decompose the tensors related to the teacher and student layers, in the proposed model, the weight tensor
of the layers is first decomposed. EquationEquation 10
(10)
(10) refers to the decomposed form of a weight tensor
using the Tucker decomposition:
where represents the weight kernel tensor of the
th layer,
to the factor matrix in the
th order and
to the product between Kernel tensor and factor matrices are pointed. Also, each example of EquationEquation 9
(9)
(9) can be expressed in the form of Equationequation 11
(11)
(11) :
The decomposed deep model for the teacher model is obtained by substituting EquationEquation 11(11)
(11) in EquationEquation 9
(9)
(9) as follows:
In the following, if refers to the tensor of the feature mapping of the
th layer obtained from each function
in the teacher model, the resulting Tucker format for the tensor of each layer of the teacher model is as follows:
refers to the decomposed kernel tensor from the
th layer of teacher’s model. Also,
refers to the factor matrix in the
th order of the teacher’s model. Each case of EquationEquation (13)
(13)
(13) is represented as EquationEquation (14)
(14)
(14) .
The deep student model consists of number of layers, the output of each layer is transferred to the next layer. If the output of each student layer is a function of
, then EquationEquation 15
(15)
(15) refers to the deep decomposed student model:
The resulting Tucker format for the tensor of each layer of the student model is in the form of EquationEquation 16(16)
(16) :
where is the feature mapping tensor of the
th layer obtained from each function
in the student model. Also,
and
, respectively, refer to the kernel tensor resulting from the analysis of the feature mapping and the factor matrix in the
th order. Each example of this equation can be rewritten in the following form:
After extracting the tensors of the decomposed core of the feature maps from the middle layers of the student and teacher models, the last step in knowledge transfer is based on the feature of knowledge transfer from teacher to student in the form of a transfer module. For this reason, the function is defined based on Euclidean soft
, which monitors the performance of the student model by using the
coefficient. In general, the error of this method can be formulated as follows:
3.3. Student model training
In this section, training process of the student model under supervision of the pre-trained teacher is expressed in the form of algorithm 1. The pre-trained teacher and one ROI extracted from DHA dataset in the form of
are fed into this algorithm as input. Each of the steps of training procedure is performed on all of the samples in X. To this end, first, the response based loss
is computed by calculating
and
in order to obtain
and
as explained in EquationEquations 4
(4)
(4) –Equation8
(8)
(8) After that, error of feature based
student is calculated as follows. Four internal layers are derived from teacher and student models, and are given to four modules to compute the distance between their feature maps tensors by measuring Euclidean norm of their mode-n unfolding form through EquationEquation 12.
(12)
(12) Then, these differences are summed to obtain
. In the last step, overall loss of our KD model is computed as weighted sum of
and
according to EquationEquation 3
(3)
(3) and the parameters are optimised through the backpropagation process in each iteration.
Table
4. Experimental result
This section illustrates the effectiveness of our suggested strategy using the DHA database while comparing it with other state-of-the-art approaches. Moreover, simulation and execution process are briefly discussed.
4.1. Dataset
DHAFootnote1 serves as a thorough and public evaluation tool for automated bone age estimation techniques. It is made up of 1400 digital left hand radiographs taken from uniformly distributed normally developing Caucasian (CA), Asian (AS), African-American (AA), and Hispanic (HI) male (M) and female (F) children, aged 0 to 18 years old. Additionally, each image includes two bone age estimates provided by two radiologists. The entire process of experiments and analysis has been implemented on a computer with an Intel i7-9750 H processor, 64 GB of RAM, and an Nvidia RTX 2060 GDDR6 SLI GPU with 12 GB of memory. Through the Adam optimiser, the weights for the student and teacher networks were determined. Each of experiments is executed with 200 iterations with a learning rate of 0.006 for the student model, and in each quarter, a rate of 0.01 was increased. The value of and
is set to 0.9. In order to gain reliable performance in evaluation, dataset is partitioned into train, validation and test sets in proportions of 70%, 15% and 15%, accordingly. The criteria used to assess the outcomes include accuracy, precision, recall, specificity and mean absolute error (MAE). These metrics’ calculation are as below:
4.2. Performance of student model
As discussed in the preceding section, the teacher model uses all six DHA ROIs – fingers 1 through 5 and the wrist – in training process while the student model only uses one of these ROIs. There are, in fact, six student models, referred to as student-1, student-2, student-3, student-4, student-5 and student-6, each of which has been trained on a different ROI. presents the findings of the evaluation of these models and the teacher model. It demonstrates that the student model could, on average, attain accuracy of 85%, precision of 56%, recall of 56%, F-score of 56% and specificity of 88% for 19 age categories at each ROI. In contrast, the teacher model performed on average at accuracy of 97%, precision of 76%, recall of 76%, F-score of 76%, specificity of 98% and MAE of 0.013. These results reveals that the student model performs almost as well as its teacher, with a slight decrease of about 12% in accuracy, 20% in precision, 20% in recall, 20% in F-score, 10% in specificity, and 13% in MAE. Furthermore, suggests that student-6 which is built based on wrist region higher competence than other students with accuracy of 95%, precision of 65%, recall of 65%, F-score of 65%, specificity of 87% and MAE of 0.022 than other students. Therefore, student-6 is taken into account to do a more thorough analysis with the teacher and other methods.
Table 2. Evaluation results of six students and the teacher model.
The complexity and size of the networks in the train and test sets for the student-6 and teacher models are compared in . The results clearly show that the student model is less sophisticated than the teacher model; during the training phase, the student has about 2.34 million parameters, and classification is completed in 2.57 billion floating-point operations per second (GFLOPs) while 1.43 G of graphics processing unit (GPU) memory is used. Also, it has a 124.34 compression rate, making it lightweight. In addition to offering high accuracy, this feature makes it appropriate for deployment in edge devices.
Table 3. Comparison of the student-6 and the teacher regarding complexity and size of network.
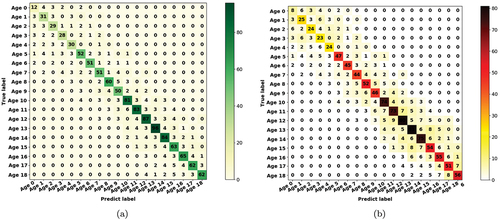
The confusion matrices for the student-6 and teacher models for 19 age classes of age 0 to age 18 are illustrated in . The main diagonal of the confusion matrix shows the number of samples that our desired targets are classified correctly which called TP and it is has significant influence on evaluation metrics. For the student confusion matrix, the student could identify the most of the classes correctly for each of 19 classes, and the most of the misclassified samples are those having closer bone age. For instance, for age-16 category, the student could predict 74 samples out of 105 correctly as age 16 class. Moreover, in classes age 12 and age 13, the proposed method outperformed than other age categories regarding TP. In addition, comparing these numbers with that of teacher’s confusion matrix, one can conclude that they are quite close suggesting comparable performance of student and its teacher.
Figure 3. The confusion matrices for age classes of (a) teacher model and (b) student-6 model.
represent the performance evaluation results of the student-6 and teacher, respectively, for each of 19 classes in terms of accuracy, precision, recall, specificity and MAE. According to , our student is able to classify each of bone age classes with high degree of certainty with the following results: accuracy of 94.68%, precision of 64.73%, recall of 64.94%, F-score of 64.50%, specificity of 97% and MAE of 0.022. By contrasting , it can be recognised that how closely the performance of the proposed student model matches that of the teacher. For example, in class age 6, performance of student is lower than teacher’s performance as little as 1 76% in accuracy, 1
0.63 in precision, 0.09
0.36 in recall and 0.0
0.04 in specificity, whereas its MAE is 0.002 more than teacher. Hence, it can be inferred that our student can provide approximately the same performance as the teacher while it is much less complex than teacher model.
Table 4. Performance of the student-6 model for all 19 bone age classes.
Table 5. Performance of the teacher model per each 19 bone age classes.
4.3. Ablation study
In this section, in order to investigate effectiveness of our suggested hybrid KD method, some experiments are carried out to compare the proposed KD with three pure KD models based on accuracy, precision, recall and specificity metrics. To this end, the following three KD models are taken into account for comparison with student-6:
OKD (Hinton et al. Citation2015): In this study, which the concept of KD was introduced for the first time, a student is constructed by utilising the response-based knowledge provided from a teacher network.
FitNet (Romero et al. Citation2014): This method was the first attempt to use the intermediate information for training the student model. Indeed, feature maps of internal layers of the teacher is passed on to the student.
TAKD (Mirzadeh et al. Citation2020): In this approach, a number of teachers supervise training the student by transferring a combined knowledge comprising the information of the last output and the inner layers of each teacher. It is noted that assignment of each teacher to a group of layers of students is random.
The performance of these three methods and our student model is shown in . According to the table, student-6 yielded accuracy of 95.16%, precision of 65.16%, recall of 65.34%, F-score of 65.24% and specificity of 87.36% which is a significant improvements compared to the three mentioned methods. Actually, our student model enhances the performance of the Mirzadeh et al. (Citation2020) model which is the best among the three studies, with 5.63%, 3.17% and 4.45% improvements in accuracy, precision and recall respectively. Altogether, student-6 which is constructed based on wrist bone outperformed the other previously introduced KD methods.
Table 6. Comparing analysis of student-6 results with the student model from three other KD methods.
To show that results of are reliable and superiority of our model over those three KD methods has not been obtained by chance, a t-test is used in which a null hypothesis would be rejected or not. A t-test is an inferential statistic used to determine if there is a significant difference between the means of two groups and how they are related. For this purpose, we execute t-test for all measurement accuracy, precision, recall, specificity and F-score between our proposed method and other three KD ones, and outcomes is depicted in . Here, null hypothesis is that there is no difference between our KD and each of the three methods. This hypothesis is rejected either or
with 95% confidence level. Results of , for all of the criteria satisfies these two conditions which implies the null hypothesis is rejected. This means that there is a significant difference between our method and three KD approaches, and the proposed method outperforms rather than three other studies.
Table 7. Results of comparison the paired t-test of the proposed method and three other KD approaches.
4.4. Comparison of proposed method with other BAA studies
Performance of our proposed BAA method is compared to some of other BAA techniques in favour of examining effectiveness of utilising KD paradigm in BAA schemes. For this purpose, , demonstrates performance of six BAA techniques and our introduced one in terms of accuracy and MAE. These six methods have exploited different approaches from classic machine learning algorithms to convolutional deep neural networks, and all of them has been executed on DHA dataset while classifying 0–18 age classes. The results clearly show that our BAA method outperforms all the other methods by a large margin such that our strategy can classify all the 19 bone age classes with accuracy of 95.16% and MAE of 0.022 which is much higher than other approaches. For example, in Kashif et al. (Citation2016), the SVM classifier could classify bone age with MAE of 0.605, whereas our BAA method providing MAE of 0.22 which is 0.583 higher than this study. Despite exploiting CNN, which is a powerful classifier (An Ding et al. Citation2020), can classify bone age categories with MAE of 0.590 that is 0.568 less than our proposed one. Moreover, in Bui et al. (Citation2019), although deep neural network has been employed in combination with SVR, it could not categorise bone age classes with accuracy more than 67%. Instead, our introduced BAA approach offers an accuracy of nearly 95% with a lightweight structure.
Table 8. Performance evaluation of the student-6 and some state-of-the-art studies.
5. Conclusion
In this paper, a new BAA technique was introduced by employing a hybrid KD paradigm maintaining high accuracy with a lightweight structure. In this method, a teacher network with an advanced CNN structure supervises the learning procedure of a student model made of simple CNN architecture which leads the student to imitate behaviour of the teacher model. Student model is trained using transmitted knowledge of the teacher which contains data on the feature maps of intermediary layers of teacher as well as its last output layer. Exploiting these helpful insight, the student model can mimic the manner of the teacher with high resemblance, making the student more accurate rather teacher while keeping the architecture far less complex. In the experimental results, performance of the student in classifying the bone age 0 to age 18 was analysed through a variety of examinations. According to the results, student model trained on the wrist ROI was able to attain a higher level of accuracy (accuracy of 95%) than the other five students. Moreover, other comparison tables indicate superiority of our proposed method over other cutting-edge techniques.
The diversity in skeleton shape, texture and morphology among individuals poses a challenge when interpreting bone X-ray images. Consequently, the diversity in the statistical learning models that were developed using these images becomes evident. Diversity refers to modified behaviour of statistical learning models under different circumstances. Here, model generalisation (generalisability) is diminished in dealing with unseen data. Although the proposed KD model performs well, one of its drawbacks is that it fails to examine the diversity problem. Applying the collective intelligence approach to learning models is one way to address the diversity problem. Using an ensemble of multi-teacher models instead of single-teacher models, the proposed KD model reduces behavioural diversity and converges to uniform behaviour. Thus, a future work can be presenting a multi-teacher version of the proposed KD model forBAA from X-ray images, where the diversity problem and generalisation preservation are taken into account.
Disclosure statement
No potential conflict of interest was reported by the author(s).
Additional information
Notes on contributors
Majid Sepahvand
Majid Sepahvand Graduated from Razi University with an PhD in computer engineering. His doctoral dissertation entitled decomposed knowledge distillation from teacher to student for efficient biomedical data processing was supervised by Dr. Fardin Abdali-Mohammadi from Razi University and Amir Taherkordi from the University of Oslo. His research areas of interest include signal & image processing, deep learning, evolutionary computation, and edge intelligence.
Fardin Abdali-Mohammadi
Fardin Abdali-Mohammadi was born in KhorramAbad, Lorestan, Iran, in 1979. He received the B.Sc. degree in computer engineering from the Sharif University of Technology in 2001, the M.Sc. degree in software engineering from the Amirkabir University of Technology in 2003, and the Ph.D. degree from Isfahan University in 2012. He is currently an Associate Professor with the Department of Computer Engineering and Information Technology, Razi University, Kermanshah, Iran. His research interests include Medical Informatics, Biomedical signal and image processing, Data mining and Bioinfo.
Maytham N. Meqdad
Maytham N. Meqdad was born in Babylon, in 1987. He received Ph.D. degree with the Department of Computer Engineering and Information Technology, Razi University, Kermanshah, Iran in 2023. Currently he is working as assistant lecturer in Al-Mustaqbal University, Babylon, Iraq since 2013. His research interests include deep learning, evolutionary algorithms, and biomedical.
Notes
References
- An Ding Y, Mutz F, Côco KF, Pinto LA, Komati KS. 2020. Bone age estimation from carpal radiography images using deep learning. Expert Syst. 37(6):e12584. doi: 10.1111/exsy.12584.
- Bui DT, Lee J-J, Shin J. 2019. Incorporated region detection and classification using deep convolutional networks for bone age assessment. Artif Intell Med. 97:1–12. doi: 10.1016/j.artmed.2019.04.005.
- Chen X, Li J, Zhang Y, Lu Y, Liu S. 2020. Automatic feature extraction in x-ray image based on deep learning approach for determination of bone age. Future Gener Comput Syst. 110:795–801. doi: 10.1016/j.future.2019.10.032.
- Crawley H. 2007. When is a child not a child?: asylum, age disputes and the process of age assessment. Immigration Law Practitioners’ Association (ILPA), Coventry University London.
- Deshmukh S, Khaparde A. 2022. Faster region-convolutional neural network oriented feature learning with optimal trained recurrent neural network for bone age assessment for pediatrics. Biomed Signal Process Control. 71:103016. doi: 10.1016/j.bspc.2021.103016.
- Fu S, Li Z, Liu Z, Yang X. 2021. Interactive knowledge distillation for image classification. Neurocomputing. 449:411–421. doi: 10.1016/j.neucom.2021.04.026.
- Gertych A, Zhang A, Sayre J, Pospiech-Kurkowska S, Huang HK. 2007. Bone age assessment of children using a digital hand atlas. Comput Med Imaging Graph. 31(4–5):322–331. doi: 10.1016/j.compmedimag.2007.02.012.
- Han Y, Wang G. 2020. Skeletal bone age prediction based on a deep residual network with spatial transformer. Comput Methods Programs Biomed. 197:105754. doi: 10.1016/j.cmpb.2020.105754.
- He J, Jiang D. 2021. Fully automatic model based on SE-ResNet for bone age assessment. IEEE Access. 9:62460–62466. doi: 10.1109/ACCESS.2021.3074713.
- Hinton G, Vinyals O, Dean J. 2015. Distilling the knowledge in a neural network. arXiv Preprint arXiv: 1503 02531. 2(7):1–9
- Kashif M, Deserno TM, Haak D, Jonas S. 2016. Feature description with sift, surf, brief, brisk, or freak? a general question answered for bone age assessment. Comput Biol Med. 68:67–75. doi: 10.1016/j.compbiomed.2015.11.006.
- Liang B, Zhai Y, Tong C, Zhao J, Li J, He X, Ma Q. 2019. A deep automated skeletal bone age assessment model via region-based convolutional neural network. Future Gener Comput Syst. 98:54–59. doi: 10.1016/j.future.2019.01.057.
- Li S, Liu B, Li S, Zhu X, Yan Y, Zhang D. 2022. A deep learning-based computer-aided diagnosis method of x-ray images for bone age assessment. Complex Intell Syst. 8(3):1929–1939. doi: 10.1007/s40747-021-00376-z.
- Liu Y, Zhang C, Cheng J, Chen X, Wang ZJ. 2019. A multi-scale data fusion framework for bone age assessment with convolutional neural networks. Comput Biol Med. 108:161–173. doi: 10.1016/j.compbiomed.2019.03.015.
- Liu R, Zhu H, Wang L, Han B, Du J, Jia Y. 2022. Coarse-to-fine segmentation and ensemble convolutional neural networks for automated pediatric bone age assessment. Biomed Signal Process Control. 75:103532. doi: 10.1016/j.bspc.2022.103532.
- Lu Y, Zhang X, Jing L, Fu X. 2021. Data enhancement and deep learning for bone age assessment using the standards of skeletal maturity of hand and wrist for Chinese. 2021 43rd Annual International Conference of the IEEE Engineering in Medicine and Biology Society (EMBC); Mexico. p. 2605–2609.
- Mansourvar M, Raj RG, Ismail MUA, Kareem SA, Shanmugam S, Wahid S, Mahmud R, Abdullah RH, Nasaruddin FH, Idris N. 2012. Automated web based system for bone age assessment using histogram technique. Malays J Comput Sci. 25(3):107–121.
- Mirzadeh SI, Farajtabar M, Li A, Levine N, Matsukawa A, Ghasemzadeh H. 2020. Improved knowledge distillation via teacher assistant. Proceedings of the AAAI Conference on Artificial Intelligence; New York, USA. Vol. 34. p. 5191–5198.
- Mouloodi S, Rahmanpanah H, Burvill C, Davies HM. 2020. Prediction of displacement in the equine third metacarpal bone using a neural network prediction algorithm. Biocybern Biomed Eng. 40(2):849–863. doi: 10.1016/j.bbe.2019.09.001.
- Ren X, Li T, Yang X, Wang S, Ahmad S, Xiang L, Stone SR, Li L, Zhan Y, Shen D, et al. 2019. Regression convolutional neural network for automated pediatric bone age assessment from hand radiograph. IEEE J Biomed Health Inform. 23(5):2030–2038. doi: 10.1109/JBHI.2018.2876916.
- Romero A, Ballas N, Ebrahimi Kahou S, Chassang A, Gatta C, Bengio Y. 2014. Fitnets: hints for thin deep nets. arXiv Preprint arXiv: 1412 6550.
- Rzecki K, Kucybała I, Gut D, Jarosz A, Nabagło T, Tabor Z, Wojciechowski W. 2021. Fully automated algorithm for the detection of bone marrow oedema lesions in patients with axial spondyloarthritis–feasibility study. Biocybern Biomed Eng. 41(2):833–853. doi: 10.1016/j.bbe.2021.05.005.
- Saini D, Chand T, Chouhan DK, Prakash M. 2021. A comparative analysis of automatic classification and grading methods for knee osteoarthritis focussing on x-ray images. Biocybern Biomed Eng. 41(2):419–444. doi: 10.1016/j.bbe.2021.03.002.
- Salim I, Ben Hamza A. 2021. Ridge regression neural network for pediatric bone age assessment. Multimedia Tools Appl. 80(20):30461–30478. doi: 10.1007/s11042-021-10935-8.
- Sepahvand M, Abdali-Mohammadi F. 2022. A novel method for reducing arrhythmia classification from 12-lead ECG signals to single-lead ECG with minimal loss of accuracy through teacher-student knowledge distillation. Inf Sci (Ny). 593:64–77. doi: 10.1016/j.ins.2022.01.030.
- Simu S, Lal S, Nagarsekar P, Naik A. 2017. Fully automatic roi extraction and edge-based segmentation of radius and ulna bones from hand radiographs. Biocybern Biomed Eng. 37(4):718–732. doi: 10.1016/j.bbe.2017.07.004.
- Son SJ, Song Y, Kim N, Do Y, Kwak N, Lee MS, Lee B-D. 2019. Tw3-based fully automated bone age assessment system using deep neural networks. IEEE Access. 7:33346–33358. doi: 10.1109/ACCESS.2019.2903131.
- Spampinato C, Palazzo S, Giordano D, Aldinucci M, Leonardi R. 2017. Deep learning for automated skeletal bone age assessment in x-ray images. Med Image Anal. 36:41–51. doi: 10.1016/j.media.2016.10.010.
- Wang C, Wu Y, Wang C, Zhou X, Niu Y, Zhu Y, Gao X, Wang C, Yu Y. 2023. Attention-based multiple-instance learning for pediatric bone age assessment with efficient and interpretable. Biomed Signal Process Control. 79:104028. doi: 10.1016/j.bspc.2022.104028.
- Wu E, Kong B, Wang X, Bai J, Lu Y, Gao F, Zhang S, Cao K, Song Q, Lyu S, et al. 2019. Residual attention based network for hand bone age assessment. 2019 IEEE 16th International Symposium on Biomedical Imaging (ISBI 2019); Venice, Italy. IEEE; p. 1158–1161.