
Abstract
Previous research has suggested that after 1996 devolution caused a reduction in regional disparities in Italy. However the analysis presented here suggests that the decline in regional disparities in Italy between 1996 and 2006 was driven by population dynamics and, to some extent, by the loss of competitiveness and consequent poor relative performance of northern regions. We conclude that links between devolution and the reduction of spatial disparities is unproven and its benefits are temporally and geographically uneven.
Introduction
Rodríguez-Pose and Gill (Citation2003) identify a global trend toward decentralization beginning in the 1970s, reflecting the imputed effects of citizens’ participation, greater accountability and ‘voting with one’s feet’ effects (Oates, Citation1972, Citation1999; Rodríguez-Pose, & Gill, Citation2005; Tiebout, Citation1956). Empirical research has tended to focus on the growth-enhancing effects of devolution, while much less attention has been paid to the effects of devolution in terms of its contribution to spatial disparities. The empirical evidence is rather mixed, demonstrating that the effects of devolution on spatial disparities are case specific (Calamai, Citation2009; Pike, Rodríguez-Pose, et al., Citation2012; Rodríguez-Pose, & Gill, Citation2004; Tselios, Rodríguez-Pose, et al., Citation2011). This consideration suggests the case for further research based on single-country case study.
With regard to the Italian case, it has been argued that a beneficial effect of the devolutionary process beginning in 1995 – in terms of a reduction of spatial disparities – arose, even if indirectly (Calamai, Citation2009). Indeed, over the 10 years following the first introduction of devolutionary measures in Italy, a significant reduction of regional disparities is apparent and in the Italian context this phenomenon has resulted in some reduction of the ‘North–South divide’. According to Calamai (Citation2009, p. 1140):
Just one year later (1996), the North–South gap, which had been increasing constantly since the 1980s, started to show a significant decline. In addition, the partial association between the two phenomena is further supported by their markedly high correlation coefficient of 0.89 (statistically significant at the 0.1% level), which suggests, for the period under consideration, a strong positive correlation between this measure of devolution and the downturn in regional per capita differentials.
The mechanism through which the devolutionary process operates is illustrated in Figure .
Figure 1. Link between devolution and regional disparities in Italy.
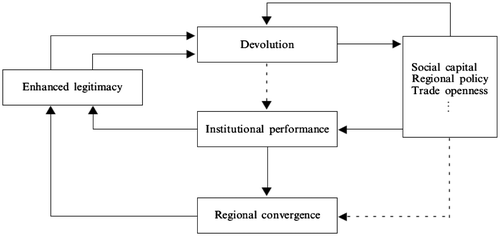
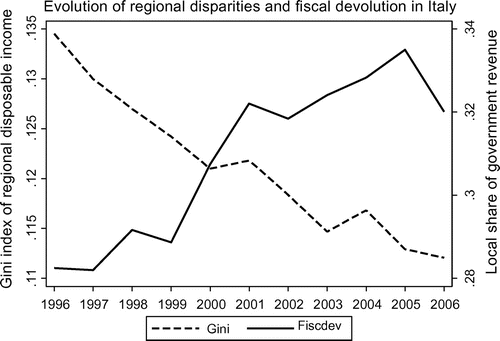
Figure 2. Evolution of regional disparities and fiscal devolution in Italy. Fiscal devolution is the share of local revenue from total government revenue; the Gini index is an index of regional gross disposable household income per head (GDHI).
The idea expressed in Figure , building on Azfar, Kahkonen et al. (Citation1999), is as follows. Devolution, by means of proximity to the electorate and enhanced accountability of local governments, accompanied by a well-developed social fabric and civil society, indirectly stimulates economic growth and generates ‘a cumulative and self-reinforcing phenomenon, in which economic dynamism nurtures its legitimacy and thus feeds back into the devolutionary push’ (Calamai, Citation2009, p. 1147). This process is further stimulated by regional policy via both the increased autonomy and Europeanization of development policy. The remainder of this paper will subject this hypothesis to critical scrutiny in the Italian case.
Therefore, the operation of the theoretical framework introduced above is worth exploring empirically building upon institutionalist political economy placed in a historical and a geographical context and using a mix of quantitative and qualitative methods. Put differently, since ‘decentralization is not an end in itself but rather should be designed and evaluated for its ability to achieve broader objectives of […] equity, efficiency, quality and financial soundness’ (Bossert, Citation1998, p. 1513), as a contribution to the political and economic debate, it is worth enquiring empirically to what extent the supposed virtuous cycle stemming from the devolution process operates. While the following analysis is mainly of an exploratory nature, it is able to highlight important aspects of the issue at hand and, furthermore, is potentially able to contribute to shaping the research agenda on the link between spatial disparities and devolution.Footnote 1
The next section briefly reviews empirical studies concerning the effectiveness of regional policy in reducing regional disparities. The third section considers the evolution of pivotal socio-economic factors, linked to the devolutionary process, involved in the economic performance of Italian regions with particular regard to the eventual shift in Southern variables able to explain the regional convergence registered over the period considered. The fourth section addresses the issue of ‘what could cause the reduction of regional disparities?’ proposing a reading in terms of population dynamics and the relative performance of the Northern regions. The fifth section offers conclusions.
Regional policy, regional disparities and decentralization in Italy
The long history of Italian economic dualism dates back to the unification process in 1861 and successive policies have sought to deal with this phenomenon (Spadavecchia, Citation2007; Del Monte and De Luzenberger, Citation1989; for a comparative perspective, see Bachtler, Wishlade, et al., Citation2001). This paper focuses on European Union regional policy in consideration of its pivotal role in national state policy in terms of both financial effort and new procedures. Aiello and Pupo (Citation2012), among others, have observed that over the period 1996–2006 the total amount of Structural Funds received by Italy was more than €110 billion. European Union support was distributed in accordance with its spatial redistributive aim. During the period 1996–2008 the South received a share of total transfers from the European Union ranging between 70% and 87% of total Italian transfers.Footnote 2 More precisely, the South received funds equivalent to about 11% of the total investments and 40% of public investments, substantially higher than the Centre–North datum at 1.4% and 9.5% respectively. In addition to the magnitude of spatial redistributive effort, these figures also confirm the strong (and persistent) dependency of Southern economy from policy measures (Aiello and Pupo, Citation2012). In line with the aim of this paper we focus on the debate regarding the effectiveness of policy measures in reducing regional disparities.
There is mixed evidence regarding the effects of European Union regional policy. Loddo (Citation2006) finds a positive and significant effect of Structural Funds on regional convergence during the 1994–2004 period, albeit with uneven effects, given that expenditure allocated by the European Regional Development Fund (ERDF) ‘has medium term positive and significant returns while support to agriculture has short-term positive effects on growth which wane quickly’ (Loddo, Citation2006, p. 1). Furthermore, Loddo (Citation2006, p. 1) points out that her results ‘cast some doubt both on the (i) distributive efficiency of resources allocated by European Social Fund (ESF) and (ii) on the effectiveness of the intervention policies in support to education, human capital and employment’.
However, Aiello and Pupo (Citation2012), in a more recent study, note that during a period of 25 years (1980–2007), there was
no variation in the distribution of regional GDP [gross domestic product] per-capita: the regions in which GDP per-capita was below the national average at the beginning occupy the same positions at the end of the period (the correlation between the series of regional GDP per-capita at the beginning and end of the period is 0.95) (Citationpp. 403–404)
Moreover, with regard to the magnitude of discrepancy, they also note that ‘in 2006–2007 the income of an inhabitant of the richest region (Valle d’Aosta) is, on average, 2.6 times higher than that of an inhabitant of the poorest region (Calabria)’ (p. 404). Focusing attention on the impact of European Union regional policy, their empirical analysis, taking into account the non-observable regional heterogeneity, the small-sample bias and the possible endogeneity of Structural Funds, Aiello and Puo reach the conclusion
that the divide between the regions has not changed over time and, therefore, even if the increase of the infrastructure endowment has contributed to determine a greater impact of the spending in the Mezzogiorno, it is evident that the European cohesion policy has not fully reached the set objective, that is to reduce the disparities inside each member state. (p. 409)
More precisely, they find a positive impact of European Union funds (0.081 or 0.090 according to different estimation technique, LSDVC or GMM-SYS respectively), but the magnitude of their estimates implies that, for example, a 10% increase in per capita European Union spending, on average, results in an increase in the GDP per capita of about 0.90% or 0.81% respectively according to the estimator applied.
Taking account of these empirical findings, there is room to doubt the magnitude of the impact of European Union regional policy in interaction with devolution in reducing regional disparities.
Evolution of other relevant factors
In order to explore further the link between spatial performance and spatial disparities in Italy, measures taken from the Istituto Nazionale di Statistica (ISTAT) and which belong to the Territorial Database for Development Policy (Banca dati territoriale per le politiche di sviluppo) and which contain data collected specifically to support policy monitoring and evaluation inside the Community Support Framework (Quadro Comunitario di Sostegno) are used.Footnote 3 The database comprises about 160 regional indices divided into contest indicators (indicatori di contesto chiave) and ‘break variables’ (variabili di rottura). The latter set consists of 15 variables selected to evaluate ex-ante the impact of policy actions due to their importance in terms of economic externalities to economic development. Therefore, this data set represents a powerful instrument in order to search for a structural change in southern regions, interacting with the devolutionary trend, in order to improve their economic performance and, in turn, to reduce regional disparities as theoretically predicted with particular regard to the Italian case by Calamai (Citation2009).Footnote 4
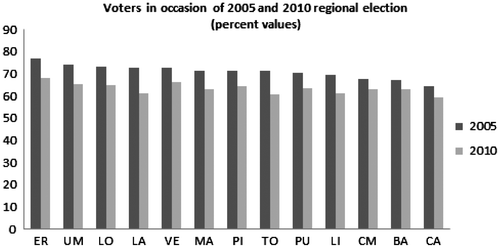
We consider first a general indicator of social capital, political accountability and participation, which is represented by turnout for the 2005 and 2010 regional elections considering the 13 regions under Statuto Ordinario rule. The rationale for considering these regions is twofold. First, because these kinds of regions are potentially more involved in the increased autonomy arising from the devolutionary process (especially under the 2001 Constitutional reformFootnote 5 ) than regions already enjoying a higher level of autonomy (Statuto Speciale). Second, in these regions elections are held on the same days,Footnote 6 allowing one to control for external factors such as the influence of electoral participation and the economic cycle (Aguilar & Pacek, Citation2000).
If devolution is aimed at deepening democratic engagement we would expect an increase in electoral participation, to wit,
By bringing government “closer to the people” […] it is suggested that devolution can […] generate a renewed sense of engagement and participation in the political process in the territories where it is established’ (Scully, Jones, et al., Citation2004, pp. 519–520).
Furthermore, as already noted, Calamai (Citation2009, p. 1146), with particular regard to the Italian case, points out that ‘one of the major arguments pointing to the economic benefits of devolution equates proximity to the electorate with the enhanced accountability of local governments’. Figure reports the participation rate for 13 regions under Statuto Ordinario rule relative to both the 2005 and 2010 regional elections. However, as shown in Figure , between 2005 and 2010 in all regions considered the electoral turnout declined. The highest reduction was registered by Lazio (the difference between the 2005 and 2010 datum is 11.70), while the lowest has been registered in Basilicata (where the difference is 4.38). On average the difference between the two was 7.70. Therefore, it seems that devolution, rather than enhancing citizens’ and decision-makers and strengthening their role, instead was embroiled in a general ‘public alienation from, and declining trust in, politicians and the political system’ (Scully et al., Citation2004, p. 519). Especially in the South, a possible outcome of this is a self-enhancing vicious cycle since, as a response to this alienation, political institutions could become ‘less “representative” of the population, and in turn might incline policy makers to neglect the interests of social groups among whom electoral participation is lowest’ (p. 519). This circumstance, in turn, could have negative overall effects on social capital and social cohesion.
Figure 3. Electoral turnout. For regions’ abbreviations, see Table A1.
With the aim to analyse the evolution of other relevant factors over time, in what follows we simultaneously consider further four selected indicators from 1995 to 2007Footnote 7 . The first indicator – ‘legality and Social Cohesion’ (index ‘t.09’ – condizioni di legalità e coesione sociale) – represents an additional indirect measure of social capital measured as violent crimes per 10,000 inhabitants, while the remaining three indicators – ‘worker productivity in manufacturing industry’ (‘index IV-13 bis’ – produttività del lavoro nell’industria manifatturiera), ‘innovation ability’ (index ‘IV-19 bis’ – intensità brevettuale), and ‘economic dependency’ (index ‘R2b’ – grado di indipendenza economica) – deal with the issue from a strictly economic perspective.
Data are standardized over time for each macro-area in order, first, to make a comparison allowable across macro-area data responding to different metrics and, second, to allow to capture, in a more sensitive way, of the relative evolution of Southern and Islands macro-areas which, in absolute terms, reveals that ‘almost all weaknesses of the Italian economy are mostly revealed in the South’ (Cannari, Magnani, et al., 2009, p. 673; present authors’ translation). Therefore, should devolution cause a structural change able to improve the overall performance of the Southern part of the country reducing spatial disparities, we would expect to observe a substantial change in key variables here considered linked with the devolutionary timing. Figure reports the synoptic view of variables considered over time.
Figure 4. Evolution of socio-economic factors. Legality and social cohesion are violent crimes per 10,000 inhabitants; workers’ productivity is value added per Annual Work Unit (AWU) (included the sectors mining, manufacturing, and production and distribution of electricity, water and gas); innovation ability is the number of patents taken out (European Patent Office); and economic dependency is the net import share of gross domestic product (GDP).
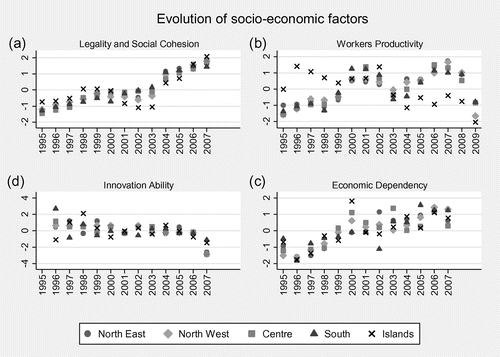
A detailed analysis of the interrelationships between these data and devolution is beyond this paper’s purpose. However, as an exploratory analysis, it is worth noticing that, if any, only a negative effect of devolution on socio-economic factors considered could be traced over the period considered. Indeed, we observe an increase in violent crimes – i.e. a decrease in legality and social cohesion – involving all macro-areas considered (Figure (a)). As far as workers’ productivity is concerned (Figure (b)) we find a rather cyclical trend involving all macro-areas considered. Moreover, closely analysing the datum relative to Islands, we register that while during the initial period here considered (1995–99) Islands’ macro-area showed a relatively higher performance than the rest of the country, in the following phase it started (except for the 2002 datum) to perform relatively worse (2004–09, therefore even after the devolutionary Constitutional reform of 2001). Hence, opting for a link between the devolutionary process and the productivity variables, we emphasize the negative impact of the former on Islands’ economic performance. The empirical evidence regarding innovation ability (Figure (c)) highlights a further negative trend involving all macro-areas considered during the whole sample. According to this evidence, we would argue that this trend has not been driven by the devolutionary process. Nevertheless, the funnel-shaped plot, simultaneously considered with the devolutionary measure adopted during these years, would suggest a ‘race to the bottom’ scenario where all macro-areas simultaneously experienced a worsening of their performance over time. Finally, with respect to economic dependency (Figure (d)), there is no strong empirical evidence in favour of a (positive) link between devolution and this aspect of economic performance. Rather, we observe a general upward trend with some outlier (especially Island in 2000 and, to some extent, South in 2002).
Overall, the trend registered in our sample does not support the suggestion that any structural change in the Southern regions allowed them to perform better under the early devolutionary regime. This negative outcome over time of important socio-economic factors makes it difficult to link the reduction of regional disparities experienced over the period under consideration to (potential) beneficial effects of devolution. The link between devolution and disparities remains unproven.
What could cause the reduction of regional disparities?
The analysis performed in previous sections essentially demonstrated that no single variable taken under consideration registered an historical evolution able to explain empirically – through the theoretical mechanism reported in Figure – the persistent reduction in regional disparities registered over the 10-year period from 1996 to 2006. Therefore, as stated, the analysis – rather than supporting the Calamai’s (Citation2009) argument about the desirable opposite relation between regional disparities and devolution – creates more worries about the possibility of reaching a reliable conclusion than it started with.
Given that the virtuous relationship between decentralization and other variables cannot be confirmed in light of the empirical analysis developed above. Therefore, the first conclusion that could be drawn is based on the argument that the reduction of disparities, rather than representing the result of endogenous factors fostering economic performance, is primarily driven by the strong redistributive effort operated by the state.
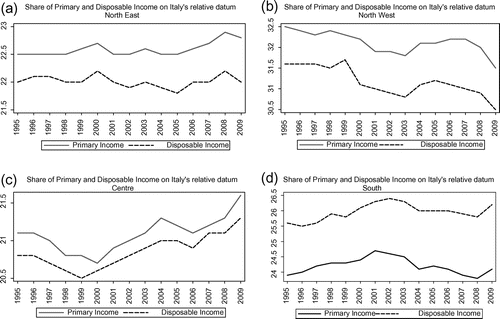
This argument is confirmed by Figure which reports the evolution of primary and disposable household income (as a share of Italy’s total primary and disposable household income, respectively) according to macro-area over the period 1995–2009. Indeed, it is evident that the Italian South uniquely has a share of disposable income (i.e. after state intervention) substantially higher than primary income (i.e. before state intervention). Furthermore, this circumstance is strongly persistent over time and despite the strong inter-regional redistributive effort and the observed reduction of regional disparities over time, the intra-regional relative poverty is substantially stable over time. The South registers a share of relative poverty (23.38% on average, ranging from 21.6% in 2003 to 25.0% in 2004), more than twice those of other macro-areas of the country; the North ranges from 4.5% (in 2005) to 6.0% (in 1997) and the Centre ranges from 5.8% (in 2003) to 9.7% (in 2000). Therefore, the reduction of regional disparities observed over the period under investigation has not been accompanied by a corresponding reduction of intra-regional disparities (rather relative poverty) and this circumstance in itself is another factor that casts doubt on the link between devolution and the reduction disparities. Indeed, one key argument in favour of devolution is based on better targeted policies due to an improved information set available at the local level.
Figure 5. Share of primary and disposable income on the national datum: macro-areas.
Considering redistribution as a public good (Pauly, Citation1973) and adopting Hochman and Rodgers’ (Citation1969) approach based on the interdependence of utilities function between rich and poor, the redistributive effort theoretically could be Pareto-efficient in a decentralized setting. Nevertheless, our analysis confirms that the devolutionary process, in all Italian macro-areas considered, was unable to produce any significant effect in this regard. Devolution had a limited effect, if any, at reducing between disparities without changing the structure of relative intra-regional poverty. While the issue of the focus of analysis either on income distribution or on poverty is still debated in political and academic discourse (Sutcliffe, Citation2004), there is empirical evidence that the devolutionary process in Italy has been unable to stimulate a ‘pro-poor growth’ (Sutcliffe, Citation2004, p. 19), therefore contrasting with an argument generally suggesting a reduction of poverty not inequality (Feldstein, Citation1999) in order to increase Pareto-efficiency.
Hence, it is reasonable to argue that overall reduction of regional disparities arising from higher economic growth in the South of Italy is simply due to European transfers (Aiello and Pupo, Citation2012). Furthermore, the rise in per capita income was not accompanied by any significant change in critical variables able to (explain and) stimulate self-enhancing endogenous development, or with any reduction of regional poverty. The positive signal consisting in the reduction of regional disparities could be, therefore, essentially attributed to external factors, mainly income support measures, representing, rather than economic development, indices of persistent high economic dependency.
In addition to the different outcome of income support measures between the South and the rest of the country – operating at the numerator level – closely considering the dynamic of population, which represents the denominator used to normalize income measures, it is worth noting that, as shown in Figure , the Southern population constantly decreased over the period ranging from 1996 (20,667,800 of inhabitants) to 2002 (20,527,700 of inhabitants) while the Centre–North constantly increased over the whole period 1995–2009 passing from 36,176,600 to 39,369,800, respectively. More precisely, according to the SVIMEZ Report (Citation2009) (i.e. Associazione per lo Sviluppo dell’Industria nel Mezzogiorno) between 1997 and 2008 the Mezzogiorno registered an outward flow of about 700,000 inhabitants; only in 2008 did internal migration in favour of the Centre–Northern regions amounted to 122,000 inhabitants, 87% of which came from Campania (25,000), Puglia (12,200) and Sicilia (11,600).
Figure 6. Evolution of the Italian population: macro-areas.
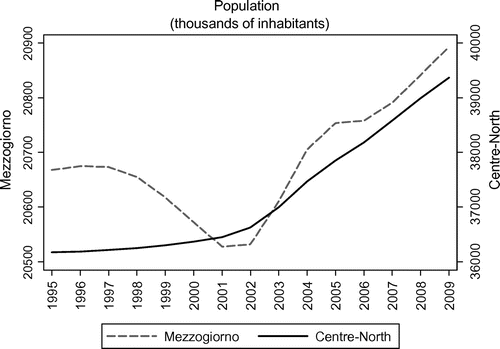
In principle, this internal migration is not a negative per se. Indeed, from a strictly economic point of view, according to the neoclassical paradigm, input factor mobility is a key factor to achieve higher economic performance. Nevertheless, from the devolutionary perspective, it was also once considered that the South–North flow mainly comprises highly skilled workers (SVIMEZ, Citation2009), and this undermines the possibility of place-based development approaches that emphasize endogenous development. Instead, it could be interpreted, once more, as a sort of exit (Hirschman, Citation1985) option also in response to the low performance of Southern local governments in stimulating economic development. However, undoubtedly the internal dynamic of the population, in spite of the fact that it has been driven by the relatively low economic performance of Southern regions generating high unemployment rates, quite paradoxically amplified the downward trend of per capita regional disparities. For example, in 2008, the share of Southern GDP of national GDP is about 24% – substantially unchanged since 1951 – while the per capita value of the Southern share in the Centre–North GDP (€30,380 and €17,482 respectively) is about 60% (SVIMEZ, Citation2008).
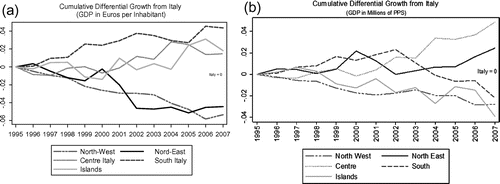
This aspect is further investigated by comparing the cumulative GDP growth between 1995 and 2007 according to five different macro-areas. Figure (a), reporting per capita values, shows that both the North-East and the North-West macro-areas registered a (cumulative) growth rate lower than the rest of the country, especially after the year 2000. Moreover, the South, beginning from 1996, shows the highest economic performance between the macro-areas. In Figure (b), absolute values, the picture is quite different. In this case, even if the North-West displays a relatively low cumulative growth, the North-East datum is higher than national growth for the whole period considered (even if both in 1998 and 2001 the macro-areas registered cumulative growth roughly equal to the national one). The Islands, in contrast to per capita values, show a downward trend since 1998, joined by the Southern macro-area since 2002, exactly one year after the devolutionary Constitutional reform of 2001. Only the Centre seems to display relatively good economic performance according to both measures.
Figure 7. Cumulative differential growth from Italy.
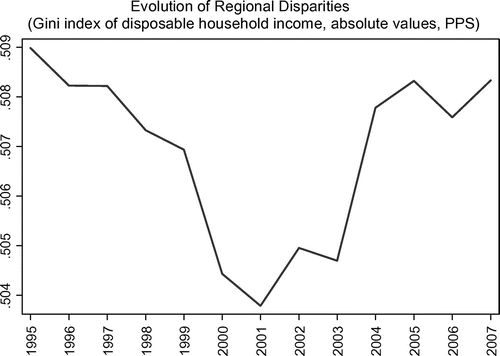
Therefore, not considering the dynamic of the population and its effects on regional – per capita – income, the ‘convergence’ produced shows different magnitude and trends. The Gini index for absolute values (Figure ) ranges between a maximum and minimum of 0.509 (in 1995) and 0.504 (in 2002), substantially higher than the corresponding extremes registered by the per capita figures of 0.135 and 0.113 in 1995 and 2007 respectively. Put differently, the maximum–minimum difference in the Gini index (absolute values) of only 0005 results, due to population dynamics, in a difference (0.02) four times higher in per capita values. Moreover, the continuous downward trend of regional disparities registered in the case of per capita values is not confirmed by absolute values. Although a reduction of disparities in absolute values arose during the period 1995–2001, beginning from 2002 (once more, just a year after the devolutionist Constitutional reform in 2001) regional disparities started to increase.
Figure 8. Evolution of regional disparities (gross disposable household income per head (GDHI) in absolute values). Gini index is the index of regional GDHI.
The dynamic described above challenges the argument in favour of the positive effects of devolution in realizing every place’s economic potential and casts doubts about whether devolution has contributed to the reduction of inequalities across the Italian regions. To analyse further the potential beneficial effects of devolution on spatial disparities we also consider the issue of polarization. Given the strong spatial autocorrelation of measures of income in Italy, the expression of the North–South divide (Esteban & Ray, Citation1994), it is well known that income inequality measures could give a picture quite different from polarization measures. More precisely, it could be the case that (at least) some Southern regions, stimulated also by the devolutionary trend, activate their own economic dynamic behaving, in terms of Esteban and Ray (Citation1994), less as a single ‘cluster’ reducing overall polarization. To this end we use the generalized Esteban, Gardìn, and Ray (2007) (EGR) polarization index:(1)
where and
represent respectively the (corrected) average income and the numerical weight of group j;
∈ [1,1.6] is the parameter that captures the degree of sensitivity of the measure of polarization; and is the parameter used to express the weight assigned to the error term
in determining group composition (Duro, Citation2005; Esteban & Ray, Citation1994). This measure involves the division of the original population into a number of significant homogeneous groups (within-homogeneity condition) to obtain high heterogeneity between groups. Adopting the methodology proposed by Aghevli and Mehran (Citation1981) and Davies and Shorrocks (Citation1989), both the two and three groups cases have been considered. Results are reported in Table .
Table 1. Polarization analysis.
In computing this index, contrary to expectations based on a pro-devolution argument, for the partition into both two and three groups, over the whole period considered (1995–2007), Southern regions (Abruzzi, Basilicata, Calabria, Campania, Molise, Puglia, Sardinia and Sicilia) belong to the lower-income group (or cluster), confirming the circumstance that their income dynamic follows a single trend over time. Instead, Northern regions are subject to a relative repositioning process.Footnote 8 This phenomenon is apparent, for example, in 2001. Considering three income groups,Footnote 9 regions (Lombardy, Piedmont, Valle d’Aosta and Veneto) and the Provincia Autonoma Trento register a shift from the high-income group to the medium-income group, with a consequent reduction of polarization passing from 0.023076 (in the previous year) to 0.021995. Table reports the evolution of the subdivision of the whole set of regions into the three income groups following the Davies and Shorrocks (Citation1989) algorithm. Namely, low income (group 1), medium income (group 2) and high income (group 3) according to the upper and lower bounds reported for each year in Table .
Table 2. Classification of regions according to their income
In terms of a North–South divide, the analysis of polarization seems to confirm that, rather than filling the gap, regions (or members) belonging to the Southern cluster are constantly ‘similar’ over time. However, the remaining regions are becoming less ‘dissimilar’, reducing the overall polarization.
To summarize, the evolution of regional disparities is far from showing a desirable opposite link with the devolutionary process. Indeed, the reduction registered in per capita values is hardly linked with theoretical arguments proposing devolution as a socio-economic stimulating factor, and the reduction of regional disparities itself, essentially driven by the decline of (richer) Northern regions, (1) appears to be ineffective in reducing within disparities, (2) is not supported by endogenous economic performance and (3) is rather limited in both time and magnitude.
Conclusions
This paper critically considered the link between the evolution of regional disparities and devolution in Italy. The analysis contributes to the existing literature that has empirically investigated the historical path of a set of socio-economic factors which, theoretically, should underpin a virtuous cycle of development initiated by the devolution of political power. In the Italian case, this kind of analysis unavoidably involves the issue of a North–South divide.
Contrary to the theoretical argument and previous Italian case studies, and adding a consideration of fiscal devolution, this exploratory analysis shows that the evolution of factors that underpin regional development cannot explain the reduction of regional disparities in per capita (GDHI) registered over the period 1995–2007. Moreover, the reduction in inter-regional disparities over this period has not been accompanied by any substantial reduction of poverty within the South.
Our interpretation of these findings, augmented by a polarization analysis, is that the process of change has been driven by the dynamic of population change, generally ameliorating Southern per capita values, and by the weakening of (richer) Northern regions in terms of economic performance. Clearly, this does not imply that devolution has no positive effect on spatial economic performance and regional disparities; however, these effects have to be further investigated and, moreover, might require more time in order to be effective in improving socio-economic factors and overall regional performance, especially in the South of Italy.
Additional information
Funding
Notes
1. For example, both a simultaneous equations model (SEM) involving the variables at hand could be estimated and a fuzzy clustering analysis (FCA) could be used to explore further the dynamics of group of regions.
2. Figures are based on the authors’ elaboration of regional public accounts (http://www.dps.gov.it/it/cpt/).
3. For further information, see http://www.istat.it/ambiente/contesto/infoterr/azioneB.html/.
4. See also Figure .
5. Cost. L. 2001, n. 3 Modifiche al titolo V della parte seconda della Costituzione. Gazzetta Ufficiale, no. 248, 24 October 2001.
6. Except for Basilicata in 2005 that had an election between 17 and 18 April instead of between 3 and 4 April.
7. The datum on workers’ productivity is available until 2009.
8. Both the North East and North West macro-areas reduced their share of total gross disposable household income per head (GDHI) in 2007 with respect to the 1995 datum, passing from 30.02% and 23.29% (in 1995) to 29.09% and 22.78% (in 2007), respectively.
9. The income groups are defined using the Davies and Shorrocks (Citation1989) algorithm. As reported in Table , for 2001 they are defined as follows: low income between 9937.500 and 14266.739; medium income between 14266.739 and 18688.316; and high income between 18688.316 and 21008.000. Data are expressed in purchasing power standard based on final consumption per inhabitant.
References
- Aghevli, B. , & Mehran, F. (1981). Optimal grouping of income distribution data. Journal of the American Statistical Association , 76 , 22–26.
- Aguilar, E. E. , & Pacek, A. C. (2000). Macroeconomic conditions, voter turnout, and the working-class / economically disadvantaged party vote in developing countries. Comparative Political Studies , 33 , 995–1017.
- Aiello, F. , & Pupo, V. (2012). Structural funds and the economic divide in Italy. Journal of Policy Modeling , 34 , 403–418.
- Azfar, O. , Kähkönen, S. , Lanyi, A. , Meagher, P. , & Rutherford, D. (1999). Decentralisation, governance and public services. The impact of institutional arrangements. A review of the literature. Working paper, IRIS Center, University of Maryland, College Park, MD.
- Bachtler, J. , Wishlade, F. , & Yuill, D. (2001). Regional Policy in Europe After Enlargement. European Policies Research Centre Working Paper No. 44, University of Strathclyde, Glasgow.
- Bossert, T. (1998). Analyzing the decentralization of health systems in developing countries: Decision space, innovation and performance. Social Science and Medicine , 47 , 1513–1527.
- Calamai, L. (2009). The link between devolution and regional disparities: Evidence from the Italian regions. Environment and Planning A , 41 , 1129–1151.
- Davies, J. B. , & Shorrocks, A. F. (1989). Optimal grouping of income and wealth data. Journal of Econometrics , 42 , 97–108.
- Del Monte, A. , & De Luzenberger, R. (1989). The effect of regional policy on new firm formation in Southern Italy. Regional Studies , 23 , 219–230.
- Duro, J. A. (2005). International income polarization: A note. Applied Economics Letters , 12 , 759–762.
- Eurostat . (2010). Income of households by NUTS 2 regions . Retrieved from http://ec.europa.eu/eurostat/
- Feldstein, M. (1999). Reducing poverty, not inequality. The Public Interest , 137 (Fall), 33–41.
- Hirschman, A. O. (Ed.). (1985). Exit, voice and loyalty: Responses to decline in firms, organization and states . Cambridge: Harvard University Press.
- Hochman, H. M. , & Rodgers, J. D. (1969). Pareto optimal redistribution. The American Economic Review , 59 , 542–557.
- Loddo, S. (2006). Structural Funds and regional convergence in Italy. Centre for North–South Economic Research Working Paper 2006/03, Cagliari.
- Oates, W. E. (Ed.). (1972). Fiscal Federalism . New York, NY : Harcourt Brace Jovanovich.
- Oates, W. E. (1999). An essay on fiscal federalism. Journal of Economic Literature , 37 , 1120–1149.
- Pauly, M. V. (1973). Income redistribution as a local public good. Journal of Public Economics , 2 , 35–58.
- Pike, A. , Rodríguez-Pose, A. , Tomaney, J. , Torrisi, G. , & Tselios, V. (2012). In search of the ‘economic dividend’ of devolution: spatial disparities, spatial economic policy, and decentralisation in the UK. Environment and Planning C: Government and Policy , 30 , 10–28.
- Rodríguez-Pose, A. , & Gill, N. (2003). The global trend towards devolution and its implications. Environment and Planning C: Government and Policy , 21 , 333–351.
- Rodríguez-Pose, A. , & Gill, N. (2004). Is there a global link between regional disparities and devolution? Environment and Planning A , 36, 2097–2117.
- Rodríguez-Pose, A. , & Gill, N. (2005). On the ‘economic dividend’ of devolution. Regional Studies , 39 , 405–420.
- Scully, R. , Wyn Jones, R. , & Trystan, D. (2004). Turnout, participation and legitimacy in post-devolution Wales. British Journal of Political Science , 34 , 519–537.
- Spadavecchia, A. (2007). Regional and national industrial policies in Italy, 1950s–1993. Where did the subsidies flow? University of Reading Working Paper No. 48, Reading.
- Sutcliffe, B. (2004). World Inequality and Globalization. Oxford Review of Economic Policy , 20 , 15–37.
- SVIMEZ . (2008). Rapporto svimez 2008 sull’economia del mezzogiorno, Roma.
- SVIMEZ. (2009). Rapporto svimez 2009 sull’economia del mezzogiorno, Roma.
- Tiebout, C. (1956). A pure theory of local expenditures. Journal of Political Economy , 64 , 416–424.
- Tselios, V. , Rodríguez-Pose, A. , Pike, A. , Tomaney, J. , & Torrisi, G. (2011). Income inequality, regional economic development and decentralisation in Western Europe. Environment and Planning A , 44, 1278–1301.
Appendix
Table A1. Regions abbreviations and composition of macro-areas.
Note: aIf not separately considered Islands are included in the South macro-area.