
 ?Mathematical formulae have been encoded as MathML and are displayed in this HTML version using MathJax in order to improve their display. Uncheck the box to turn MathJax off. This feature requires Javascript. Click on a formula to zoom.
ABSTRACT
This study explores a tool used to assess economic development, technological innovation, environmental sustainability and liveability in urban areas. The research employs qualitative and quantitative analysis in the development of an index – the Sustainability–Innovation–Local Economic Development Index (Sustain-LED Index) – that considers macroeconomic and environmental indicators and associated policies implemented in the largest US metropolitan areas. The Sustain-LED Index could broaden the range of tools available to policy-makers for identifying and removing obstacles for improving the quality of life, reducing inequalities and diminishing the degree of pollution in urban areas. It could represent a supporting tool for local entities to design new policies for spurring local economic development and it could be used for designing new urban policies throughout a greater understanding of the economic, social and environmental consequences caused by urbanization.
INTRODUCTION
Urban indices are useful tools for measuring policy effectiveness and overall quality of life in metropolitan regions. Social indicators are ‘statistics and all other forms of evidence that enable us to assess where we stand and are going with respect to our values and goals’ (Bauer, Citation1966, p. 1). Researchers and others concerned with tracking policy effectiveness have developed a variety of urban frameworks to measure levels of sustainability, economic strength and quality of life (Arcadis, Citation2016; Feiock et al., Citation2014; Hardi & Pinter, Citation1995; Jepson, Citation2019; Kitchin et al., Citation2015; Krause, Citation2011; Opp, Citation2017; Portney & Sansom, Citation2017; Science for Environment Policy, Citation2018; Slaper & Hall, Citation2011; Zeemering, Citation2018).
The present paper presents the creation of a new urban index, termed the Sustain-LED Index, focused upon four main categories: environmental sustainability, innovation, local economic development (LED) and liveability. This was carried out across the largest metropolitan areas of the United States, presenting a research that significantly draws from the studies carried out on the accounting framework of the ‘triple bottom line’ (Arowoshegbe et al., Citation2018; Elkington, Citation1994; Hammer & Pivo, Citation2017; Slaper et al., Citation2010). Important work indices are valuable in this assessment context as they combine multiple variables or indicators into a single scale, thereby allowing comparisons across multiple study areas. The development of useful indices depends on the availability of common data sources across the study areas in question.
The major contribution of this index is to include technological innovation, analysing the number of patents generated within metropolitan regions over the past 15 years. This dimension of economic strength and quality of life has not previously been included in an urban index on a metropolitan area level in the United States and it is hoped that this new dimension provides a holistic improvement in how urban ‘success’ is measured. A hybrid index such as the one elaborated in the present study is needed since it shows a new way to present a multidimensional index encompassing all the important issues present in metropolitan areas, such as technological innovation, but also considering sustainability, economic, social and environmental issues linked to human life. Consequently, this study gives a hybrid meaning to growth and development, encompassing not only the technological aspects and developmental aspects related to metropolitan areas but also embracing a more social dimension linked to a vast array of indicators used in the index. After presenting the inputs to this new index, the study validates the index by assessing it in 2010 and 2015, comparing the observed change in index values to historical occurrences in the study of metropolitan regions. This validation approach presents a new method for testing the validity of urban indices.
LITERATURE REVIEW
The development of this index is grounded in the long-standing dichotomy between economic growth and environmental sustainability. Meadows (Citation1972) held a belief and forecasted that natural resource exhaustion and environmental deprivation will create a permanent breakdown of the global economy. In his estimation, preventing disaster was only possible by limiting growth. Thampapillai (Citation1991) similarly presented the case for how economic growth and environmental sustainability are believed to counteract one another.
Sustainability can be explained as the balance between the present needs, which can be called well-being, and the well-being of future generations. This concept is founded upon the definition of sustainability given by the Brundtland Report, Our Common Future (WCED, Citation1987). It describes sustainable development as a condition that necessitates meeting everybody’s needs and spreading to all the opportunity to fulfil their desires for a better life.
Sustainable development requires the promotion of values that encourage consumption standards within the bounds of the ecologically possible and to which all can reasonably aspire […] sustainable development must not endanger the natural systems that support life on Earth: the atmosphere, waters, soils, and living beings. (pp. 40–42)
the ability of physical development and environmental impacts to sustain long-term habitation on the planet Earth by human and other indigenous species while providing: (1) an opportunity for environmentally safe, ecologically appropriate physical development; (2) efficient use of natural resources; (3) a framework which allows improvement of the human condition and equal opportunity for current and future generations; and (4) manageable urban growth. (Roosa, Citation2010, p. 44)
Under a policy point of view, the last four decades have seen a remarkable number of treaties and actions that many countries have signed up to and have committed to applying nationally. Anyway, there is still a discrepancy between theory and action on the ground. While these commitments are a concern of the sovereign nations, there is still the interrogation of how the international system can support countries to tackle what is recognized as the ‘implementation gap’ (Rose, Citation2011).
Under an economic perspective, the concept of economic growth has been defined as the rate of the annual production of goods and services in a country leading to a rise in national income. Economic growth has a robust theoretical foundation and is easily quantified as growth in aggregate output. Classical economists such as Ricardo (Citation1819) and Solow (Citation1956) theorized an economy as a system that creates economic output as depending on inputs such as labour, land and equipment, which could be compared with technology. According to this view, growth occurs when output increases (Feldman et al., Citation2016).
Small changes in growth rates over long periods can bring large differences in liveability standard (Blakemore & Herrendorf, Citation2009). Traditionally, the development of a country was measured only in terms of gross domestic product (GDP) and as a result per capita income became an important indicator (Ivković, Citation2016). Not long after its creation, the measure of growth as GDP was criticized by many illustrious economists such as Nobel Prize winners Arrow, Kuznets, Kahneman, Solow, Stiglitz, Sen and Yunus (Wesselink et al., Citation2007). Furthermore, Bleys (Citation2012) has carried out a different classification framework based on the notions of well-being, economic welfare and sustainability that brought to light alternative measures for policy-making. As an alternative, Ivković et al. (Citation2014) analysed non-traditional indicators such as well-being, entailing the pursuit of sustainable economic development and underpinning the importance of living conditions.
Other studies have discussed alternatives to GDP as a measurement, and this led to an increase in the collaboration of international institutions to consider alternative indicators. This has been reflected in the work carried out by the United Nations (Citation2015) that now comprehends several indicators apart from the classical GDP measure in the development of countries.
In recent years, the meaning of growth and development has changed, encompassing a more social dimension, with a focus on the human capital perspective, as ‘development must, therefore, be more than just the expansion of income and wealth. Its focus must be people’ (UNDP, Citation1990, pp. 9–10).
Another core topic of the present paper is represented by innovation. It has been defined as a procedure that brings to a result: something new that can be represented by a product or a process that before was not there (Godin, Citation2008). The concept of innovation, moreover, must be separated from the one of invention, as many scholars have defended this theory over the years. Innovation is primary to all economic activities: it can be a novel activity, market, source of supply or business group that is not only created but implemented as well, used or promoted by a firm (OECD, Citation2005). In the present study, we will adopt a more technological interpretation for the concept of innovation.
Economic development and urban planning
Nowadays LED is intertwined with urban planning and public policy since the success of an area relies on its aptitude to adjust either to the dynamic local economy or to the global economy. Using the words of Jokinen et al. (Citation2018), ‘The intertwinement of diverse global policy models in a city planning process creates easily a recursive cycle that redefines urban sustainability within cities and intercity networks.’ LED strategic planning is gradually more used by cities to make a stronger local economic capacity of a place, improve the investment climate, and increase the productivity and competitiveness for local businesses, entrepreneurs and workers. Among the outcomes of LED, it can be pointed out that it can improve the quality of life inside communities, the creation of new economic opportunities for all and the fight against poverty (Swinburn et al., Citation2006). LED is linked to equality. Studies have evidenced that more equality is linked to a better economy in the long run, with more stable and quicker development on the long period, if this is compared with economies that present a higher rate of inequality (Wilkinson & Pickett, Citation2010).
Every community has an exclusive set of local conditions that can either improve or reduce the potential for LED, and these conditions are the peculiarities that make a place different from another, which determine the relative advantage of an area in its ability to attract, generate and retain investment.
When carrying out research concerned with economic development or growth, the argument is heavily linked with the realities of political fragmentation. One of the first pieces of research on political fragmentation was developed by Hill (Citation1974), who linked this theme to inequalities among US metropolitan statistical area (MSA) residents. With this regard, some studies have attempted to link the central city’s share of the MSA population, with fiscal conditions of cities (Morgan & Mareschal, Citation1999). The urbanization of the world is heavily linked to economic and political fragmentation (McFarlane, Citation2018). In general, urban fragmentation activities have become one of the main concerns in the programme of public administrations and urban planning divisions (Michelutti, Citation2010). This is relevant for researchers and policy-makers, who are central actors in this debate; in recent years, the general understanding of the relationship between growth and sustainability has evolved to accept the notion that these two phenomena can occur in a parallel manner, meaning that increasing growth can occur with increasing sustainability. According to UNESCO (Citation2019), ‘there are four dimensions to sustainable development – society, environment, culture and economy – which are intertwined, not separate.’ Various scholars contributed to this shift in thinking, exploring the relationship between growth and sustainability under different perspectives. Economists still disagree on the best way to present a multidimensional index of sustainability, considering the economic, social and environmental issues of human life (Distaso, Citation2007; Pulselli et al., Citation2006). Goldin and Winters (Citation1995) clarified the relationship between economic policies and environmental policies, addressing the relationship between growth and sustainability. Basiago (Citation1998) analysed economic, social and environmental sustainability in development theory in relation to urban planning; Perrings and Ansuategi (Citation2000) explored the consequences of growth with respect to ecological systems on which economic activities depend; Gylfason (Citation2001) analysed the connection between natural resources, economic development and education; Ekins (Citation2002) defined the conditions of compatibility between economic growth and environmental sustainability, providing analytic criteria for measuring these two phenomena.
In recent years, the definition of growth has evolved, with scholars, forums and organizations contributing to this shift in thinking, understanding that growth needs to be understood under a holistic approach. In the United States, the concept of smart growth has risen, as an approach to development that encourages a mix of building types and uses, diverse housing and transportation options, development within existing neighbourhoods, and community engagement (Smart Growth Network, Citation2006).
The assessment of the sustainability aspects in everyday life has become crucial in developed countries where growth and technological advancement if not managed well and may decrease the quality of life of citizens, for instance, by polluting air and water bodies (Cracolici et al., Citation2010).
Sustainable development has become a hot topic and many scholars such as Strange and Bayley (Citation2008) have analysed it thoroughly; world organizations such as the OECD (Citation2011) have started talking about the relationship between growth and sustainability, addressing challenges on economic, environmental and social issues; the term of green growth has risen as a way to describe a path of economic growth that uses natural resources in a sustainable manner. The OECD has addressed the talk on this subject through reports, conferences and forums. Another relevant concept is the one of circular economy. In recent times this subject has found its way into academics; it is linked to economic growth as well, and it can be achieved by reducing pollution and increasing the environmental self-renewal rate or the recycling ratio (George et al., Citation2015).
Other scholars have explored the relationships between economic growth and sustainability, analysing the key links between these two disciplines that ones were seen as distinguished matters and that now seem to be dramatically intertwined (Higgins, Citation2013; Panayotou, Citation2016; Van den Berg, Citation2016).
The concept of sustainability linked to growth is now recognized inside corporations, and it is now paramount for companies to develop sustainability strategies and implement them for solving environmental problems and at the same time improve their social and business performance (Epstein, Citation2018).
The theoretical basis for the development of the present index is that urban growth, reflected by technological innovation, is compatible with sustainability and quality of life. This can be translated into an economic advantage for some places over others. Some urban areas possess a vibrant urban environment, which is more appealing, especially for some segments of the population such as the young creative class. Moreover, this attractiveness linked to urban areas creates a demand, enduring for decades. Finally, the choice of living in sustainable neighbourhoods generates savings for the households, which in turn are spent in the local economy (Speck, Citation2013).
Efforts to define growth via innovation
This section provides an inventory of the more widely used and recently published urban indices. It is organized around four categories of indices, including quality of life, economic competitiveness, environmental sustainability and innovation. For each index, the inventory defines the key author, date of publication, index name, unit of analysis of the index, indicators or variables included, and key application of the index as stated by the author of the respective study.
Several important trends emerge from the inventory of urban indices summarized as follows:
Half the previous urban index studies (9/18) focus on economic competitiveness, reflecting the fact that development of urban indices is commonly motivated by concern with a country’s or region’s economic strength.
Interest in this research topic is increasing, as 15/18 have been published in the last two years, most likely reflecting increased access to ‘big data’ and improved analytic capacity.
Not-for-profit organizations are the most frequent authors of the studies, as 14/18 of these studies were produced by non-governmental organizations (NGOs), university or research centres, reflecting a strong diversity in authorship trends, including grassroots involvement related to social betterment.
In the studies where innovation is analysed, the majority of them (3/5) includes patents or Patent Cooperation Treaty (PCT) patent applications as a measure of innovation.
Cities are the most frequent geographical area analysed in the studies, as 10/18 studies are focused on cities of the world.
and help to summarize the general trends found in literature in terms of the four major categories of indices. Economic competitiveness is the most common category. This can be explained by the fact that these indices are made to give a tool to policy-makers to build more attractive places for investors and businesses. Another more theoretical explanation is that capitalism, and in turn economic competitiveness, is the main framework in which contemporary economies are embedded, and so the majority of researchers have produced indices to give policy-makers a tool to make places more competitive in economic terms.
Table 1. Summary of urban indices.
Table 2. Index categories, number of indices per category and perspective of the indices.
The analysis carried out by scanning all existing indices concludes that there is the need for a more accurate measure of sustainability and innovation together with economic development. This can be appreciated also from the second column of which shows more indices are oriented towards economic competitiveness, the majority of the indices analysed in literature have been produced with more of a business-oriented perspective, rather than from a sustainability vantage point. The data analysed in are related to indices published in the period 2011–17.
The Sustain-LED Index responds to this limitation, as a new framework for measuring not only economic indicators but also quality of life and indicators for understanding the technological innovation activity of an area.
It is helpful to examine specific details related to the inclusion of innovation in urban indices across the previous studies (Dutta et al., Citation2018; Innovation Cities Global Index, Citation2016; Mori Memorial Foundation, Citation2016; PWC, Citation2016; Schwab, Citation2016). In these studies, innovation has been measured in multiple ways, including as the number of local suppliers, the state of cluster development, the nature of competitive advantage, the capacity for innovation, the quality of scientific research institutions, the number of researchers from the world’s top 200 universities, academic performance in Maths and Science, research and development (R&D) expenditure, number of patents, number of patents per purchasing power parity (PPP), GDP, and PCT patents by origin/bn PPP$ GDP.
Various studies have been examined from the existing literature to develop the empirical framework for the Sustain-LED Index. In particular, five employ measures of innovation; their respective approaches are highlighted below:
In the Global Competitiveness Report (Schwab, Citation2016), innovation is measured as company spending on R&D, university–industry collaboration in R&D, government procurement of advanced technology products, availability of scientists and engineers, and PCT patent applications. The unit of analysis in this study is 138 countries.
In the Global Innovation Index (Dutta et al., Citation2018), innovation is measured as patents by origin/bn PPP$ GDP, PCT patents by origin/bn PPP$ GDP, trademarks by origin/bn PPP$ GDP, and industrial designs by origin/bn PPP$ GDP. The unit of analysis in this study is 126 countries.
In the Innovation Cities Global Index, innovation is measured as an index created for understanding the preconditions for innovation within cities. This is measured by means of many indicators such as GDP per capita, company tax, multinational headquarters, number of languages spoken, social media usage, city banking, smart devices used and other indicators that measure ‘the ecosystem’ of the city for innovation. The unit of analysis in this study is 500 global cities.
The Cities of Opportunities Index measures the competitiveness of 30 global cities and innovation is based on the Innovation Cities Global Index aforementioned. The unit of analysis in this study is 30 global cities.
The Mori Memorial Foundation Study (Citation2016) measures the competitiveness of 42 global cities and innovation is defined as an index including the number of researchers in the world’s top 200 universities, academic performance in mathematics and science, R&D expenditure and patents. The unit of analysis in this study is 42 global cities.
Recent assessment frameworks and reports indicate that innovation is included in many of the studies analysed and patent density emerged as an important parameter since it has been found in most of the studies that analysed innovation and competitiveness of cities and urban areas.
By relying on practical examples, the present work also highlights the important contributions made by previous assessment frameworks on the topics of sustainability, economic development, and innovation.
The proposed Sustain-LED Index has an important relationship with the existing literature. The present study attempts to address the assessment of US metropolitan areas by offering a novel tool for understanding and promoting the improvement of well-being, considering the multifaceted issues of sustainability, economic development, innovation and quality of life.
Not all R&D expenditure have been considered in the index as a measure of innovation in addition to the patent data. Only the investment towards small and medium-sized enterprises (SMEs) has been considered. The rationale behind this choice lies in the fact that spending more on R&D does not always lead to results. Although many studies demonstrate that the most innovative countries are within the top investors of R&D sectors (Akcali & Sismanoglu, Citation2015; Savrul & Incekara, Citation2015). According to Jaruzelski et al. (Citation2011), the most influential drivers for innovation are strategic alignment and an organizational culture capable of sustaining innovation.
In the United States, some tools for economic development already exist (US Economic Development Administration, Citation2019); however, the challenge of this research is represented by a proposal of a more balanced index in terms of six broad categories: housing cost, sustainable transportation, air quality, jobs, technological innovation and income equality. This research focuses on the evaluation of how communities can define and attain environmental wealth goals as determinants of liveability. Alongside that, the purpose of this study is to insert a crucial topic that can be considered the engine that drives contemporary economies: technological innovation.
The Sustain-LED Index has attained a stage where it contributes a credible assessment of metropolitan areas performance and it can suggest some policy actions necessary to achieve environmental sustainability, economic competitiveness and innovation within a region. With further improvement in its effectiveness and impact – someday it could turn into an important measurement as other indicators such as GDP in evaluating the progress, competitiveness and level of sustainability of metro areas.
METHODS
As previously mentioned, this study examines 53 US metropolitan areas with a population greater than 1 million. The most populated metropolitan area, among those studied, is the New York–Newark–Jersey City metro area, with a population of almost 20 million in 2010. The United States was chosen as a study area because, among high-income countries, it has the highest number of universities, patents and citations.
Cities once were limited to their political borders; however, they are quickly transforming into larger metropolitan areas, with the city centre serving as the nucleus. Just consider that, for instance, New York City in 2013 had a population of 8.3 million, while 20 million resided in the New York–Newark–Jersey City metropolitan area. The broad definition of metropolitan area is that of a core area containing a large population nucleus, together with adjacent communities that have a high degree of economic and social integration with that core. More specifically, in the United States, an MSA consists of one or more counties that contain at least one urbanized area that has a population of at least 50,000 or more inhabitants (United States Census Bureau, Citation2010).
The selected metro areas picked for the study are those with a population greater than 1 million people (53 metro areas); this selection has been done for two reasons found in literature: innovation occurs in large cities (Lee & Rodríguez-Pose, Citation2014; Sedgley & Elmslie, Citation2011) and because large cities generate also more unconventional innovation (Gaetani & Berkes, Citation2015).
An index is a composite measure made of various indicators. This composite measure can be the sum of outputs of the indicator items or some other measure such as the mean of the indicator items. In this study, each indicator initially gave an equal weight (EW) to the calculation of the index. This was done since it is common that composite indicators depend on EW, where the same weight is assigned to all variables. This basically suggests that all variables have the identical value in the calculation. A weakness of this could be the fact that it could suggest the lack of a statistical basis. For this reason, the present study was constructed with three alternative scenarios, in which in two of them (scenarios B and C) a correlation method among variables was carried out to select the right weighting.Footnote1
This section will explain the structure of the Sustain-LED Index and the choice of the indicators, including why some indicators were selected over others ().
Table 3. Indicators used in calculating Sustain-LED Index.
Indicator measures across the six indicator categories are combined to create the index. After combining the indicator values via summation, the result is normalized to create the final Sustain-LED Index by MSA. The normalized data simplify a comparison across metropolitan areas. The formula used for normalized data is the following:(1)
(1) The Sustain-LED Index rates the overall sustainability, technological innovation, economic development and liveability of the selected MSA, on a scale from 0 to 1, with the best performing metropolitan area scoring 1, and the lower performing communities scoring 0.
presents descriptive statistics for each indicator that forms the Sustain-LED Index.
Table 4. Descriptive statistics summary.
Interpretation of key points from descriptive statistics
includes the sample minimum and sample maximum, also called the smallest observation and the largest observation; they are the values of the least and greatest elements of a sample. They are basic summary statistics, and are the least robust statistics since they are maximally sensitive to outliers. The mathematical average is the arithmetic mean, representing the most widely used measure of central tendency; it has been obtained by adding all the items of the series and dividing this total by the number of items.
Additionally, two types of positional average are shown: median and mode. The median for the sustainable transportation and innovation indicators is lower than the mean; this is because some outliers perform better than others (New York and San Jose); this affected the means for these indicators. The statistical measure of the median is very useful, and in some cases is a better representation of the mean.
The mode, the second positional average, shows a higher frequency in the series. The highest mode in the present study has been registered for the employment indicator; this could reflect the relatively high employment rate of the country as well.
Finally, it is shown that the standard deviation as a measure of dispersion; it measures the dispersion of a data set relative to its mean. It is calculated as the square root of variance by determining the variation between each datum point relative to the mean. If the data points are further from the mean, there is a higher deviation within the data set; therefore, the more spread out the data, the higher the standard deviation. The highest standard deviation for the indicators is shown for the innovation indicator, meaning that the majority of US metropolitan areas do not have similar values of patents per 100 workers; this could be interpreted as a lack of social innovation in the United States, where patents are produced in few hotspots such as innovation hubs, for example, the Silicon Valley, while in other metropolitan areas the generation of patents is relatively low. The lowest standard deviation, on the other hand, is registered for the income equality indicator, as all the largest US metro areas show similar levels of Gini Index, with a quite high level of income inequalities.
The following sections provide a more detailed justification for the selection of indicator measures and present frequency distributions of the indicators by US MSAs.
RESULTS AND DISCUSSION
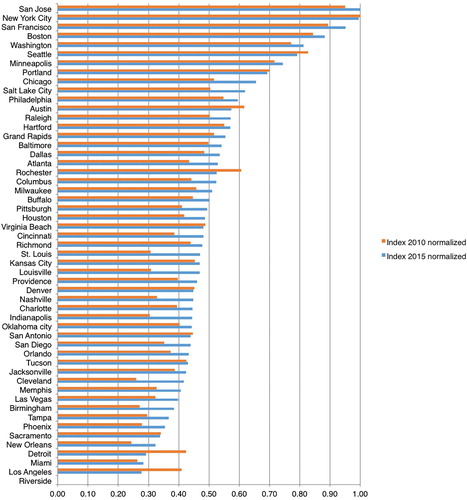
The Sustain-LED Index can be used for ranking the best performing US metro areas in terms of six categories. Specifically, it is composed of six quantitative indicators split across six thematic categories: sustainable transportation, pollution, economic development, innovation and social inclusion, and housing cost. Every city in the index is scored across these six categories. shows the top 20 of the Sustain-LED Index for 2015. Note that the Sustain-LED Index in has been normalized with respect to .
Table 5. Top 20 of the Sustain-LED Index, 2015.
San Jose–Sunnyvale–Santa Clara (also known as the Silicon Valley) occupies the first position of the ranking in 2015. An outstanding number of patents are produced every year in this area, known as the global cradle of innovation. This is coupled with a good median Air Quality Index (46) and a good employment rate (63.3%), comparable with the employment rate of the European Union (19 countries) that in 2015 was 64.5%.
The New York metro area (New York–Newark–Jersey City, NY–NJ–PA) occupied the first position of the ranking in 2010. An optimal public transportation system, a good innovation rate and a decent Air Quality Index for a huge metro area contributed to its overall Sustain-LED ranking in 2010. The last five positions of the index in 2015 are shown in . Note that the index has been normalized, for example, in San Jose has an index of 100%, since it has been divided the actual value by itself (see Equation (Equation1(1)
(1) )).
Table 6. Last positions of the ranking of the Sustain-LED Index, 2015.
Among the last positions of the Sustain-LED ranking 2015 we can find New Orleans and Detroit; Hurricane Katrina devastated New Orleans, which was the worst natural disaster in US history. This had devastating effects on the economy as well, affecting 19% of US oil production. The hurricane also had effects on the industrial sector and on the production of patents and trademarks. The average patents produced in the period 2000–04 were 145 per year, while in the period 2005–15 the average fell to 104 patents per year. Katrina’s struck the heart of Louisiana’s sugar industry, with an estimated US$500 million annual crop value, which was a consistent part of the economy of the New Orleans metro area. Furthermore, the storm caused US$260 million in damage to the port and had an impact on the city’s tourism industry as well, which created US$9.6 billion annually before Katrina.
Detroit’s metro area has gone through a major economic and demographic decline in recent decades. The population of the city has fallen from a high of 1,850,000 in 1950 to 701,000 in 2013. The deindustrialization of Detroit, largely through the well-documented decline of the automotive industry, has been a significant reason for the population decline of the city. Much of the automobile production has moved out of Detroit as a result of increased global competition. Crime rates in the areas surrounding Detroit are amongst some of the highest in the United States. Such factors along with the unemployment rates have contributed to these areas suffering from a severe state of urban decay. Furthermore, the city had also filed for bankruptcy during 2013. These are the main reasons lying behind its low score in the Sustain-LED ranking.
The metropolitan area of Miami occupies the third last position of the ranking mainly because of a high rate of income inequality, with a Gini Index of 0.516, among the highest of all the United States. Another negative factor in Miami is the expensive cost of living compared with the median income.
Los Angeles metro area has a similar situation with Miami, with an unbalanced cost of living compared with the median income, as the price for renting an apartment in the Los Angeles–Long Beach–Anaheim metro area costs almost half the median income. Moreover, there is a high disparity of the income among the residents of the metro area, just slightly lower than the one existing in Miami, and the worst air quality in the country. This confirms the results from the American Lung Association’s State of the Air report for 2016, which classified the metro area that stretches from Long Beach to Riverside as the worst ozone pollution in the country in terms of ozone out of 228 metropolitan areas, and it was ranked fourth for annual particle pollution out of 171 metropolitan areas.
Riverside metro area occupies the last position of the Sustain-LED Index, principally because of a bad Air Quality Index, with a median of 97, which is classified as moderate. The American Lung Association states on its website that ‘If you live in Riverside County, the air you breathe may put your health at risk’, and it gives this rates to the area in terms of air quality: Ozone ‘F’; Particle Pollution 24-hour ‘F’ (American Lung Association Report, Citation2016). The extremely bad air quality is caused by the location of Riverside metro area, an inland area with poor ventilation and high vehicular traffic of the contiguous metro area, the one of Los Angeles.
Advantages and disadvantages of the new index
The Sustain-LED Index shows the advantage of considering innovation as an important measure in its ranking, and also presents a higher number of MSAs taken into account for the study when compared with other indices. On the other hand, talking about the disadvantages, it can be mentioned that the number of indicators considered for the index is lower than the number indicators considered in the most similar indices. However, this could be also interpreted as an advantage from some, as a smaller number of indices could also represent a higher simplicity in the calculation of the index itself. Some features of the Sustain-LED Index can be discussed, as well as similarities with other indices. shows a comparison among the three indices having as a cohort the US metropolitan areas and cities.
Table 7. Citation record.
When comparing the findings of the Sustain-LED Index with other indices, the index presented in this study shows four metropolitan areas with the same ranking of other indices. This could represent a logical soundness for the new index created.
Among the many indices analysed from literature, the most similar indices to the Sustain-LED Index have been the Green City Index elaborated by WalletHub (Bernardo, Citation2016), and the Metropolitan Development Index (Peach & Petach, Citation2016). There are some substantial differences with these indices though: while the Sustain-LED Index has been elaborated based on a database of 53 MSAs, while the Green City Index has been elaborated on a database of 100 cities. This is one reason why just three cities have the same ranking in both the Sustain-LED Index and Green City Index. Moreover, the Green City Index has been calculated with many metrics focusing on sustainability and energy sources, while the Sustain-LED Index has been concentrated also on innovation. Regarding the similarities with the Metropolitan Development Index, this index is based on 50 MSAs instead of 53. Furthermore, the Sustain-LED Index is more focused on innovation, as the Metropolitan Development Index does not take into account any explicit indicator for innovation, although it considers racial diversity as an implicit measure that contributes to innovation.
Validation
For the validation of the index, some insightful information is discussed on selected metropolitan areas. The data in are relative to the Sustain-LED Index in 2010 and 2015, and the changes in the index and in the position of the selected metropolitan areas in the ranking. Metropolitan areas are listed in alphabetical order.
Table 8. Metropolitan areas studied in the Sustain-LED Index listed in alphabetical order.
The two most improving metropolitan areas of the Sustain-LED Index from 2010 to 2015 in terms of change in ranking positions were Saint Louis (+17) and Louisville (+15). The two most deteriorating metropolitan areas of the Sustain-LED Index from 2010 to 2015 were Detroit (−21) and Los Angeles (−20) ().
Figure 1. Bar chart with metro areas Sustain-LED ranking change.
Detroit metro area in the last decade suffered one of the worst economic crises in history, with the breakdown of its main employment source, the automotive sector. From the data, it results that the main problem in these years was not employment, which changed from 55.7% in 2010 to 56.9% in 2015, while the average employment across metropolitan US areas stayed at 61% in these five years; the main issue is related to the median household income, which went down and the rent index as a consequence went up from 27% to 40.6%, meaning a dramatic change of the cost of living compared with the household income of the residents. Another indicator that worsened during this time frame was the Gini Index, which went from 0.461 to 0.476, higher than the average of the 53 largest US metropolitan areas, meaning more relevant income inequalities in 2015 compared with 2010, in Detroit.
The Los Angeles metropolitan area presents a congestion level of 41% and is classified as the 10th most congested area in the world (TomTom Traffic Index, Citation2015). Moreover, the Los Angeles metro area ranked first on the INRIX 2015 Traffic Scorecard, with the average resident spent 81 h in traffic in 2015 (INRIX Traffic Scorecard, Citation2015). This caused an extremely bad air quality and consequently low Air Quality Index. Moreover, in 2010–15, the housing index of the Los Angeles metropolitan area went from 45.8% to 47.6% (a change of 1.8 percentage points), while the same index at a national scale went from 28.8% to 29.9% (a change of 1.1 percentage points ). These indices plus one of the highest Gini Index in all the United States were the main causes of the worsening situation of the Los Angeles metropolitan area from 2010 to 2015.
On the other hand, some metropolitan areas improved their Sustain-LED Index between 2010 and 2015. St. Louis climbed the Sustain-LED ranking from 2010 to 2105 thanks to the improvement of its main indicators; the housing index went down, the price for renting a room in the St. Louis in 2015 is even lower than the same indicator in 2010, this has permitted to the rent index to improve, also thanks to the increase in the median household income, which went from about US$51,000 in 2010 to about US$56,500 in 2015. The employment rate slightly increased as well during the same period, from 61.5% to 61.6%, resulting in 0.4% higher than the average of the 53 largest US metro areas in 2015. Another important indicator that has improved a lot in the studied period is air quality, which went from 74 to 55. This is the result of the implementation of environmental policies by the City of St. Louis, which received US$3.7 million in 2009 from the federal Energy Efficiency and Conservation Block Grant Program for energy efficiency activities in the period 2010–13. These activities encourage sustainability in the city to decrease greenhouse gas emissions (City of St. Louis, Citation2015). Louisville improved as well in the period from 2010 to 2015. The indicators that improved the most were the Air Quality Index that went from 67 to 52 and the sustainable transportation index, with a rate of sustainable transportation that increased from 3.4% to 4.2%. Also, the total patents in the area increased from 2010 to 2015, as the technological innovation rate increased over these years. The housing index improved as well from 25.9% to 23.8%, because of an increase in the median household income from US$44,600 to US$52,898, almost pairing the national median household income of the United States (US$53,889 in 2015). This can be because of various plans implemented, such as the Louisville Strategic Plan. This included a network of shared-use paths, soft-surface trails, bike lanes on roadways, stream corridors, and transit routes to provide alternative transportation choices for residents and visitors of Louisville and the surrounding region (Louisville metro parks, Citation2011).
Changes to the weights of the indicators
This section has the purpose of informing on the approach chosen for generating the index, showing the sensitivity of the final index to changes in weights. The index has created three scenarios (A–C). Initially, an EW was assigned to each indicator in the computation of the index. A similar approach has been adopted in other established indicators, for example, in the Sustainable Cities Index (Arcadis, Citation2016) ‘The three sub-indices are calculated by taking simple averages of their component indicators.’ In turn, the overall score is calculated by taking the simple average of the three sub-indices. Initially in this study there was no weighting system applied (scenario A).
Other indices instead assign different weights to different dimensions, as in the Global Cities Index (A.T. Kearney, Citation2016). In this index the researchers selected 27 measures from five dimensions, more focused around business activity (weight 35%) and human capital (weight 30%).
The decision to give all factors EW needs to be discussed, as it presents both advantages and limitations. EW indices present a clear advantage: they are easy to comprehend. They are also easier to replicate if such an index wants to be adopted by policy-makers for analysing different areas of their circumscription. However, there are also disadvantages, namely an EW index could not accurately reflect the reality, since indices are subjective, and therefore policy-makers could apply different weights to the indicators as a response to different urban issues.
In the present study statistical approaches have been used for obtaining weights.
One of the areas of application of weights of differential importance is the construction of composite indicators (Maggino & Ruviglioni, Citation2009). In this ambit, it needs to be emphasized how the choice of weights would be possibly derived from the objective principle (Ray, Citation2007). Under this perspective, the statistical methods are usually considered and favoured (Nardo et al., Citation2005; Ray, Citation2007; Sharpe & Salzman, Citation2004), in particular, correlation analysis is among the most used methods to select the right weighting.
Scenario B
In this scenario, the index dramatically changed when it was given a different weight to the indicators to composing the index. In this way the index was conceived under a different philosophy. This scenario was constructed by means of valid statistical testing to show that these measures create similar changes towards the overall index when observing innovation. Each indicator was weighted using a proper methodology by means of the SPSS software. Specifically, in this instance, it used multiple regression analysis, which is an extension of simple linear regression. This technique was used to predict the value of each variable based on the other variables. The weight of each indicator was assigned as inversely proportional to the correlation level with the other indicators composing the index.Footnote2
From is possible to appreciate the change in the ranking by applying different weighting to the indicators, with metropolitan areas with high innovation and R&D activities such as San Francisco and Seattle that experience an improvement in the Sustain-LED Index.
Table 9. Top 10 of the Sustain-LED Index in 2015 and scenario B.
Scenario C
More indicators were considered in this case. House ownership as a measure for liveability, the percentage of land for parks and recreation as a green space indicator, hazardous waste per 1000 persons as a further environmental indicator, the employment local clusters as a measure of LED, violent crime rate per 100,000 inhabitants as a measure for safety, the Small Business Innovation Research award for SMEs has been used to gauge innovation oriented to small businesses (US Small Business Administration, Citation2020). This last measure describes how SMEs engaged in technological innovation, and the indicator has been collected by metropolitan areas between 2013 and 2017 and divided by the number of employees in the metro area, in order to normalize the variable. Also in this case it has been given a different weight to the indicators composing the index, in order not to double-count the effect of more indicators on the final Sustain-LED Index. In particular, environmental sustainability has not just been calculated by air quality and sustainable transportation in this scenario. Also other several factors have been taken into account, such as a walkability score that includes the quality of infrastructure, the land and parks for recreation, and the solid waste as well computed by the US Environmental Protection Agency (Enviro.epa.gov, Citation2020). Specifically, to calculate the metro area walk score, the walk score of all the cities composing the metro area have been taken into account (Walk score, Citation2020).
shows the change in the weights applied to the indicators in scenario C. It should be noted that the weights in this case are different to those presented in , as the linear regression is now performed among different variables, in comparison with scenario C, when only six indicators were considered.
Table 10. Scenario C indicators and weights.
Table 11. Sustain-LED Index and scenario B index 2015.
From the results under scenario C, it is possible to appreciate significant changes in the top 10 of the Sustain-LED Index ranking (). This is because of the larger number of variables used for creating scenario C of the index, and also because of the weighting method based on the correlation among the variables. Boston makes the top of the ranking when considering an enlarged array of variables, with an improvement of three positions in the ranking when compared with scenario A. From the analysis of the variables, it has been found that the variable of the funding for SMEs had a big impact on the index. Small businesses in Boston perform particularly well when considering the number of awards received by the federal government divided by the number of workers. SMEs in the Boston metro area are well engaged in technological innovation, justified by the good innovation ecosystem existing in Massachusetts’ capital. Similarly, San Francisco and San Jose have a vibrant innovation ecosystem that attracts entrepreneurs from all over the globe. This has been clearly reflected in the present index particularly in scenario C of the Sustain-LED Index.
On the other hand, the metro area of New Orleans occupies the third last position of scenario C. The major metro area of Louisiana was hit a decade ago by a natural disaster and has been rebuilding its metropolitan area for years. However, even when more variables are taken into account, it falls into the last positions of the ranking. Similarly, the metro areas of Las Vegas, Milwaukee, Jacksonville and Memphis occupy the last positions of the ranking, having performed poorly considering a scenario that gauge the effects of multiple phenomena on sustainability, innovation and economic development of the areas.
Table 12. Top 10 of the Sustain-LED Index 2015 and scenario C.
CONCLUSIONS
The objective of this paper was to provide a tool to policy-makers to assess economic development, technological innovation and environmental sustainability in urban areas. The research carried out the objective through the development of an index that considered macroeconomic indicators and environmental indicators, to interconnect the themes of economic development, innovation and sustainability and to summarize the linkages between these topics using statistical analysis.
Several indicators have been used in this study to support the development of a tool for evaluating how well communities achieve liveability standards. This tool has been named the Sustain-LED Index. It is composed of six quantitative indicators, later enlarged to 13 indicators that can be divided into thematic categories. Every metro area in the index has been ranked across these indicators.
The metropolitan areas that initially made the top five list of the index in 2015: San Jose, New York, San Francisco, Boston and Washington, DC. After having increased the number of indicators in the index and improved the weighting methodology in an alternative scenario C,Footnote3 the top five is composed by the same metro areas, with differences in the positions of the ranking. In the last analysed scenario, the Boston–Cambridge–Newton metro area ranked number one.
As a validation of the results, some metropolitan areas have been found to improve their Sustain-LED Index between 2010 and 2015, and therefore their performance, and the reason could be the implementation of particular policies.
The policy implications of this work are that policy-makers should consider their allocation of resources based on the components of the present study, if they want to aim at improving sustainability, technological innovation, and economic development and increasing the liveability of urban areas. The questions that policy-makers are currently trying to answer are: How can they make their city more innovative, experience stronger economic growth and maintain its liveability for all its residents? This analysis helps to address these questions by assessing several indicators through an index that would be useful not only to design new policies for spurring LED and to design new urban policies, but also it could serve as a testing tool for validating the effectiveness of the implementation of local policies. The issue of political fragmentation needs to be taken into account as well when designing new policy frameworks. Therefore, future studies should focus also on the impact of political fragmentation on urban performances and metrics.
In conclusion, this study supports the most recent studies affirming the importance of spurring innovation and measuring environmental sustainability and the quality of life in urban areas, next to the assessment of classic economic indicators. Future studies will focus on the development of a web geographical information system (GIS) to detect and track real-time changes of the performances and the phenomena occurring inside urban areas.
ACKNOWLEDGEMENTS
The corresponding author thanks Professor Carmelina Bevilacqua (Mediterranean University of Reggio Calabria, Italy), Professor Alan Dyer (Northeastern University, USA), Dr Luana Parisi (Dudley College of Technology), and Ian Arnott and David Pepper (University of Sunderland) for their precious support. In addition, gratitude is due to several anonymous reviewers whose valuable comments helped to improve the manuscript.
DISCLOSURE STATEMENT
No potential conflict of interest was reported by the authors.
Notes
1 Alternative weighting methodologies might be appropriate as well, apart from that used in this paper.
2 Alternative weighting methodologies might be appropriate as well apart from that used in this paper.
3 Alternative weighting methodologies might be appropriate as well apart from that used in this paper.
REFERENCES
- Akcali, B. Y., & Sismanoglu, E. (2015). Innovation and the effect of research and development (R&D) expenditure on growth in some developing and developed countries. Procedia – Social and Behavioral Sciences, 195, 768–775. https://doi.org/10.1016/j.sbspro.2015.06.474
- American Lung Association ‘State of the Air’ Report (2016).
- Arcadis. (2016). Sustainable Cities Index 2016 putting people at the heart of city sustainability. https://www.arcadis.com/media/0/6/6/%7B06687980-3179-47AD-89FD-F6AFA76EBB73%7DSustainable%20Cities%20Index%202016%20Global%20Web.pdf
- Arowoshegbe, A., Uniamikogbo, E., & Atu, G. (2018). Sustainability and triple bottom line: An overview of two interrelated concepts.
- A. T. Kearney. (2016). The A.T. Kearney Global Cities Index 2016 [online]. Retrieved June 10, 2017, from https://www.atkearney.com/research-studies/global-cities-index
- Basiago, A. D. (1998). Economic, social, and environmental sustainability in development theory and urban planning practice. The Environmentalist, 19(2), 145–161. https://doi.org/10.1023/A:1006697118620
- Bauer, R. A. (1966). Detection and anticipation of impact: The nature of the task. Social Indicators, 1–67. https://doi.org/10.2307/2574613
- Bernardo, R. (2016, October 12). 2016s greenest cities in America. https://wallethub.com/edu/most-least-green-cities/16246/#methodology
- Blakemore, A., & Herrendorf, B. (2009). Economic growth: The importance of education and technological development.
- Bleys, B. (2012). Beyond GDP: Classifying alternative measures for progress. Social Indicators Research, 109(3), 355–376. https://doi.org/10.1007/s11205-011-9906-6
- Carson, R. (1994). Silent Spring. 1962.
- City of St. Louis. (2015). Climate & Air. https://www.stlouis-mo.gov/government/departments/mayor/initiatives/sustainability/air.cfm
- Clustermapping.us. (2020). U.S. Cluster Mapping | Mapping a nation of regional clusters. [online] Retrieved January 24, 2020, from https://www.clustermapping.us
- Cracolici, M. F., Cuffaro, M., & Nijkamp, P. (2010). The measurement of economic, social and environmental performance of countries: A novel approach. Social Indicators Research, 95(2), 339–356. https://doi.org/10.1007/s11205-009-9464-3
- Distaso, A. (2007). Well-being and/or quality of life in EU countries through a multidimensional index of sustainability. Ecological Economics, 64(1), 163–180. https://doi.org/10.1016/j.ecolecon.2007.02.025
- Dutta, S., Lanvin, B., & Wunsch-Vincent, S. (2018). Global innovation index 2018: Energizing the world with innovation. https://www.globalinnovationindex.org/Home
- Economist Intelligence Unit (EIU). (2012). Hot spots: Benchmarking global city competitiveness [online]. Retrieved June 15, 2017, from www.citigroup.com/citi/citiforcities/pdfs/eiu_hotspots_2012.pdf
- Economist Intelligence Unit (EIU). (2016). A summary of the liveability ranking and overview, August [online]. Retrieved June 20, 2017, from https://www.eiu.com/public/topical_report.aspx?campaignid=Liveability2016
- Ekins, P. (2002). Economic growth and environmental sustainability: The prospects for green growth. Routledge.
- Elkington, J. (1994). Towards the sustainable corporation: Win–win–win business strategies for sustainable development. California Management Review, 36(2), 90–100. https://doi.org/10.2307/41165746
- Enviro.epa.gov. (2020). Home | Envirofacts | US EPA. [online] Retrieved January 21, 2020, from https://enviro.epa.gov
- Epstein, M. J. (2018). Making sustainability work: Best practices in managing and measuring corporate social, environmental and economic impacts. Routledge.
- Esty, D. C., Levy, M., Srebotnjak, T., & De Sherbinin, A. (2005). 2005 Environmental sustainability index: Benchmarking national environmental stewardship. Yale Center for Environmental Law & Policy.
- Federal Bureau of Investigation. (2020). Uniform Crime Reporting (UCR) Program | Federal Bureau of Investigation. [online] Retrieved January 20, 2020, from https://www.fbi.gov/services/cjis/ucr
- Feiock, R., Krause, R., Hawkins, C., & Curley, C. (2014). The integrated city sustainability database. Urban Affairs Review, 50(4), 577–589. https://doi.org/10.1177/1078087413515176
- Feldman, M., Hadjimichael, T., Lanahan, L., & Kemeny, T. (2016). The logic of economic development: A definition and model for investment. Environment and Planning C: Government and Policy, 34(1), 5–21. https://doi.org/10.1177/0263774X15614653
- Frank, K. (2017). The wealth report: A global perspective on prime property and wealth [online] Retrieved July 16, 2017, from http://www.knightfrank.com/wealthreport/2017/download.aspx?pageid=2abdb4ca-25b2-4d3f-93d8-02dd9b0c7f14
- Gaetani, R., & Berkes, E. (2015). The geography of unconventional innovation. In 2015 Meeting Papers (No. 896). Society for Economic Dynamics.
- George, D. A., Lin, B. C. A., & Chen, Y. (2015). A circular economy model of economic growth. Environmental Modelling & Software, 73, 60–63. https://doi.org/10.1016/j.envsoft.2015.06.014
- Giap, T. K., Thye, W. W., Yam, T. K., Linda, L., & Ling, A. G. E. (2012). Ranking the liveability of the world’s major cities: The global liveable cities index (GLCI). World Scientific.
- Godin, B. (2008). Innovation: The history of a category. Project on the Intellectual History of Innovation Working Paper, 1.
- Goldin, I., & Winters, L. A. (Eds.). (1995). The economics of sustainable development. Cambridge University Press.
- Gylfason, T. (2001). Natural resources, education, and economic development. European Economic Review, 45(4–6), 847–859. https://doi.org/10.1016/S0014-2921(01)00127-1
- Hammer, J., & Pivo, G. (2017). The triple bottom line and sustainable economic development theory and practice. Economic Development Quarterly, 31(1), 25–36. https://doi.org/10.1177/0891242416674808
- Hardi, P., & Pinter, L. (1995). Models and methods of measuring sustainable development performance. International Institute for Sustainable Development.
- Hardin, G. (1968). The tragedy of the commons by Garrett Hardin. Science, 162(3859), 1243–1248. https://doi.org/10.1126/science.162.3859.1243
- Higgins, K. L. (2013). Economic growth and sustainability – Are they mutually exclusive? Striking a balance between unbounded economic growth and sustainability requires a new mind set. http://www.elsevier.com
- Hill, R. C. (1974). Separate and unequal: Governmental inequality in the metropolis. American Political Science Review, 68(4), 1557–1568. https://doi.org/10.2307/1959941
- IMD. (2016). World competitiveness yearbook. http://www.imd.org/wcc/world-competitiveness-center-rankings/world-competitiveness-yearbook-ranking/
- Innovation Cities Global Index. (2016). Index 2016–2017.
- INRIX 2015 Traffic Scorecard. (2015). Data Source. http://inrix.com/press/scorecard-us/
- Ivković, A. F. (2016). Limitations of the GDP as a measure of progress and well-being. Ekonomski vjesnik/econviews – Review of contemporary business. Entrepreneurship and Economic Issues, 29(1), 257–272. https://hrcak.srce.hr/ojs/index.php/ekonomski-vjesnik/article/view/4217
- Ivković, A. F., Ham, M., & Mijoč, J. (2014). Measuring objective well-being and sustainable development management. Journal of Knowledge Management, Economics and Information Technology, 2, 1–29. http://researchgate.net/profile/Anita_Freimann/publication/263558369_Measuring_Objective_Well-Being_and_Sustainable_Development_Management/links/0deec53b3f61dba7c2000000/Measuring-Objective-Well-Being-and-Sustainable-Development-Management.pdf
- Jaruzelski, B., Loehr, J., & Holman, R. (2011). The Global Innovation 1000: Why culture is key. Strategy and Business, 65(1), 1–17. https://www.industrie-techno.com/mediatheque/1/4/6/000004641.pdf
- Jepson, E. Jr. (2019). Sustainability science and planning: A crucial collaboration? Planning Theory & Practice, 20(1), 53–69. https://doi.org/10.1080/14649357.2019.1571219
- Joint Center for Housing Studies of Harvard University. (2020). Joint Center for Housing Studies of Harvard University. [online] Jchs.harvard.edu. Retrieved January 22, 2020, from https://www.jchs.harvard.edu
- Jokinen, A., Leino, H., Bäcklund, P., & Laine, M. (2018). Strategic planning harnessing urban policy mobilities: The gradual development of local sustainability fix. Journal of Environmental Policy & Planning, 20(5), 551–563. https://doi.org/10.1080/1523908X.2018.1454828
- Kitchin, R., Lauriault, T., & McArdle, G. (2015). Knowing and governing cities through urban indicators, city benchmarking and real-time dashboards. Regional Studies, Regional Science, 2(1), 6–28. https://doi.org/10.1080/21681376.2014.983149
- Krause, R. (2011). An assessment of the greenhouse gas reducing activities being implemented in US cities. Local Environment, 16(2), 193–211. https://doi.org/10.1080/13549839.2011.562491
- Lee, N., & Rodríguez-Pose, A. (2014). Creativity, cities, and innovation. Environment and Planning A: Economy and Space, 46(5), 1139–1159. https://doi.org/10.1068/a46202
- Louisville metro parks. (2011). Louisville loop strategic plan. http://www.theparklands.org/res/uploads/parks/venues/files/LouLoopStrategicPlan_11.pdf
- Maggino, F., & Ruviglioni, E. (2009). Obtaining weights: From objective to subjective approaches in view of more participative methods in the construction of composite indicators. Proceedings NTTS: New techniques and technologies for statistics18-20 Feb 2009.
- McFarlane, C. (2018). Fragment urbanism: Politics at the margins of the city. Environment and Planning D: Society and Space, 36(6), 1007–1025. https://doi.org/10.1177/0263775818777496
- Meadows, D. H. (1972). The limits to growth; a report for the club of Rome’s project of the predicament of mankind (No. 04; HC59, L54.).
- Mercer. (2017). The 2011 quality of living worldwide city rankings – Mercer survey [online] Retrieved January 20, 2018, from https://www.mercer.com/newsroom/2017-quality-of-living-survey.html#city-rankings
- Michelutti, E. (2010). An analytical framework for urban fragmentation analysis in the global south city. In Questioning urban planning practices through an institutional approach. Xith n-aerus Coherence. sn. http://n-aerus.net/web/sat/workshops/2010/Brussels_2010.htm
- Morgan, D., & Mareschal, P. (1999). Central-city/suburban inequality and metropolitan political fragmentation. Urban Affairs Review, 34(4), 578–595. https://doi.org/10.1177/107808749903400403
- Mori memorial foundation. (2016). Global Power City Index 2016: Summary [online]. Retrieved January 2019, from http://mori-m-foundation.or.jp/pdf/GPCI2016_en.pdf
- Nardo M., M. Saisana, A. Saltelli, S. Tarantola, A. Hoffman, E. Giovannini, and (OECD). (2005). Handbook on constructing composite indicators: Methodology and user guide. OECD, Statistics Working Paper.
- OECD. (2005). Oslo manual: The measurement of scientific and technological activities. Organisation for Economic Co-operation and Development.
- OECD. Publishing. (2011). Towards green growth. Organisation for Economic Co-operation and Development.
- Opp, S. (2017). The forgotten pillar: A definition for the measurement of social sustainability in American cities. Local Environment, 22(3), 286–305. https://doi.org/10.1080/13549839.2016.1195800
- Panayotou, T. (2016). Economic growth and the environment. In N. Haenn, R. Wilk, & A. Harnish (Eds.), The Environment in Anthropology (2, pp. 140–148). NYU Press.https://books.google.com.pk/books?hl=en&lr=&id=wwfMCgAAQBAJ&oi=fnd&pg=PA140&dq=panayotou
- Peach, N. D., & Petach, L. A. (2016). Development and quality of life in cities. Economic Development Quarterly, 30(1), 32–45. https://doi.org/10.1177/0891242415620277
- Perrings, C., & Ansuategi, A. (2000). Sustainability, growth and development. Journal of Economic Studies, 27(1/2), 19–54. https://doi.org/10.1108/EUM0000000005309
- Portney, K., & Sansom, G. (2017). Sustainable cities and healthy cities: Are they the same? Urban Planning, 2(3), 45. https://doi.org/10.17645/up.v2i3.1018
- Pulselli, F. M., Ciampalini, F., Tiezzi, E., & Zappia, C. (2006). The index of sustainable economic welfare (ISEW) for a local authority: A case study in Italy. Ecological Economics, 60(1), 271–281. https://doi.org/10.1016/j.ecolecon.2005.12.004
- PWC. (2016). Cities of opportunities (Report No. 7). http://www.pwc.com/us/en/cities-of-opportunity/finding-patterns.html
- Ray, A. K. (2007). Measurement of social development: An international comparison. Social Indicators Research, 86(1), 1–46. https://doi.org/10.1007/s11205-007-9097-3
- Ricardo, D. (1819). Proposals for an economical and secure currency: With observations on the profits of the Bank of England, as they regard the public and the proprietors of bank stock. John Murray.
- Roosa, S. A. (2010). Sustainable development handbook. Fairmont.
- Rose, G. L. (2011). Gaps in the implementation of environmental law at the national, regional and global level.
- Savrul, M., & Incekara, A. (2015). The effect of R&D intensity on innovation performance: A country level evaluation. Procedia – Social and Behavioral Sciences, 210, 388–396. https://doi.org/10.1016/j.sbspro.2015.11.386
- Schwab, K. (2016). World Economic Forum’s Global Competitiveness Report, 2016–2017. https://www.weforum.org/reports/the-global-competitiveness-report-2016-2017-1
- Science for Environment Policy. (2018). Indicators for sustainable cities. In-depth Report 12. Produced for the European Commission DG Environment by the Science Communication Unit, UWE, Bristol. http://ec.europa.eu/environment/integration/research/newsalert/pdf/indicators_for_sustainable_cities_IR12_en.pdf
- Sedgley, N., & Elmslie, B. (2011). Do we still need cities? Evidence on rates of innovation from count data models of metropolitan statistical area patents. American Journal of Economics and Sociology, 70(1), 86–108. https://doi.org/10.1111/j.1536-7150.2010.00764.x
- Sharpe, A., & Salzman, J. (2004). Methodological choices encountered in the construction of composite indices of economic and social well-being, Center for the Study of Living Standards. CAN.
- Slaper, T. F., & Hall, T. J. (2011). The triple bottom line: What is it and how does it work. Indiana Business Review, 86(1), 4–8. http://web.mit.edu/afs.new/athena/course/2/2.813/www/readings/TripleBottomLine.pdf
- Slaper, T. F., Hart, N. R., Hall, T. J., & Thompson, M. F. (2010). The Index of Innovation: A New Tool for Regional Analysis. Economic Development Quarterly, 25(1), 36–53. https://doi.org/10.1177/0891242410387592
- Smart Growth Network. (2006). This is smart growth. ICMA and EPA.
- Solow, R. A. (1956). A contribution to the theory of economic growth. The Quarterly Journal of Economics, 70(1), 65–94. https://doi.org/10.2307/1884513
- Speck, J. (2013). Walkable city: How downtown can save America, one step at a time. North Point Press.
- Strange, T., & Bayley, A. (2008). OECD insights sustainable development linking economy, society, environment: Linking economy, society, environment. OECD Publishing.
- Swinburn, G., Murphy, F., & Goga, S. (2006). Local economic development: a primer developing and implementing local economic development strategies and action plans. Education and training series discussion paper; no. EDT 10.
- Thampapillai, D. J. (1991). Environmental economics. Oxford University Press.
- The Trust for Public Land. (2020). 2015 City park facts. [online] https://www.tpl.org/2015-city-park-facts
- Tom Tom Traffic Index. (2015). Data. http://www.tomtom.com/en_gb/trafficindex/list
- UNESCO. (2019). Sustainable development. [online]. Retrieved September 3, 2019, from https://en.unesco.org/themes/education-sustainable-development/what-is-esd/sd
- United Nations. (2015). MDG gap task force report 2015. Millennium development Goal 8 taking stock of the global partnership for development. [online] Retrieved June 21, 2019, from https://www.un.org/millenniumgoals/pdf/MDG_Gap_2015_E_web.pdf
- United Nations. Development Programme. (1990). The human development report. Oxford University Press.
- US Census Bureau. (2010). 2010 Census summary file 1 – Technical documentation/prepared by the US Census Bureau, revised 2012.
- US Economic Development Administration. (2019). EDA tools | US Economic development administration. [online] Retrieved May 20, 2019, from https://www.eda.gov/tools/
- US Small Business Administration. (2020). Small business innovation research (SBIR). [online] Retrieved January 29, 2020, from https://www.sbir.gov /
- Van den Berg, H. (2016). Economic growth and development. World Scientific Publishing Company.
- Walk Score. (2020). Walk score. [online] Retrieved January 31, 2020, from https://www.walkscore.com/
- WCED. (1987). Our common future. Oxford University Press for the World Commission on Environment and Development.
- Wesselink, B., Bakkes, J., Best, A., Hinterberger, F., & ten Brink, P. (2007, November 19–20). Measurement Beyond GDP. Paper presented at Beyond GDP: Measuring progress, true wealth, and the well-being of nations, Brussels.
- Wilkinson, R., & Pickett, K. (2010). The spirit level: Why equality is better for everyone. Penguin UK.
- Zeemering, E. (2018). Sustainability management, strategy and reform in local government. Public Management Review, 20(1), 136–153. https://doi.org/10.1080/14719037.2017.1293148
- Zillow Research. (2018). Home values. https://www.zillow.com/research/data