
 ?Mathematical formulae have been encoded as MathML and are displayed in this HTML version using MathJax in order to improve their display. Uncheck the box to turn MathJax off. This feature requires Javascript. Click on a formula to zoom.
ABSTRACT
This paper identifies the key determinants of spatial variability of productivity, focusing on small and medium-sized enterprises (SMEs) in the service sector across England. Due to the hierarchically structured data, multilevel analysis is applied to distinguish the effects of a firm’s internal variables and (sub)regional factors on productivity. Using cross-sectional data for 10,400 SMEs from the UK government’s Small Business Survey, 2015, the results show that firm-specific determinants significantly influence productivity. The findings also indicate that location, local enterprise partnerships (LEPs) and where firms operate play a pivotal role in determining SME productivity. In particular, at the LEP level, increasing labour supply, promoting local funding and improving broadband speed potentially enhance firm productivity.
INTRODUCTION
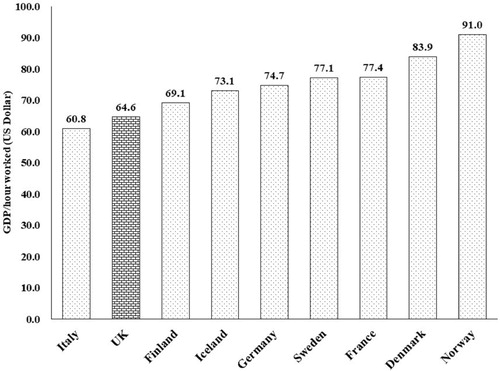
The UK has a long history of regional disparities in income and productivity, which are driven by two dimensions: (1) London’s outstanding role as a highly productive global city (primarily driven by the financial sector) (Office for National Statistics (ONS), Citation2018); and (2) a large number of UK regions and subregions with low productivity levels (Gal & Egeland, Citation2018). Evidence from the ONS (Citation2018) suggests that UK productivity varies spatially across regions. London has the highest level of productivity (gross value added (GVA) per hour worked), followed by the South East. While Yorkshire and the Humber has the lowest, which is lower than the UK average. At the subregional level, local enterprise partnerships (LEPs), London still has the highest level of productivity compared with other LEPs (ONS, Citation2018). These two patterns underpin differences in the national productivity as well as the UK economy as a whole, leading to one of the most interregional unequal countries in the industrialized world (Gal & Egeland, Citation2018; McCann, Citation2020). The Organisation for Economic Co-operation and Development’s (OECD) (Citation2020) statistics also reveal that UK productivity is lower than in many European countries (). To address the disparities and low productivity, the UK government has established the ‘Industrial Strategy’ and ‘levelling-up’ agenda, but mainstream government responses and policy debates barely address these issues since the UK economy, on many levels, is still decoupling, dislocating and disconnecting (McCann, Citation2016). Therefore, reducing spatial differences in productivity should be focused on stronger collaboration between regions and subregions as well as other locations outside London.
Figure 1. International comparisons of productivity, 2019.
Source: Organisation for Economic Co-operation and Development (OECD) (Citation2020).
To overcome the disparities in regional and subregional productivity, small and medium-sized enterprises (SMEs) are a key under-tapped resource since they contribute 60% of all private-sector jobs and 47% of revenue to the economy. Although manufacturing industries are a centre of the UK economy when compared with the international productivity, SMEs mainly operate in the service sector where businesses account for 79% of employment and 72% of total turnover (Department for Business, Energy and Industrial Strategy (BEIS), Citation2018). Evidence has identified the long-term slowdown in service productivity growth (LSE Growth Commission, Citation2017) and lower productivity compared with the manufacturing sector as well as the average level of the country’s productivity (BEIS, Citation2018). Therefore, raising the productivity growth of service SMEs would have a significant impact on overall UK productivity.
Much empirical research has explored disparities in productivity and business performance by focusing on either regional patterns (Doran & Jordan, Citation2013; Gal & Egeland, Citation2018) or the effect of firm characteristics (Vogel, Citation2011). Some recent studies have considered both the firm- and location-specific effects by controlling the hierarchically structured data when firms are clustered in different levels of spatial aggregation (Aiello et al., Citation2014; Amara & Thabet, Citation2019). However, these studies have mainly focused on the manufacturing industry with less emphasis on the service sector. Therefore, there is a need to better understand how firm characteristics and (sub)regional factors influence the productivity of SMEs in the service sector.
This study aims to identify the firm and locational (captured by LEPs) determinants of productivity with an emphasis on service SMEs in England. Multilevel analysis is employed to address the hierarchical structure of the data, providing a clear distinction between firm- and LEP-specific effects on productivity when these effects are modelled simultaneously. To the best of our knowledge, there is no study on the spatial disparities in English SME productivity using multilevel analysis and focusing on business services at the LEP level. This analysis draws on 10,400 SMEs operating in business service industries across England using a large cross-sectional data set from the Longitudinal Small Business Survey (LSBS) for 2015 commissioned by the BEIS. Our results confirm that variations in firm characteristics (firm age, size, type, sector and business network) and LEPs (broadband speeds, local growth fund and labour supply) lead to disparities in SME productivity in the English service sectors. Therefore, SMEs at the LEP level should consider investing in high broadband speeds, monitoring and promoting the local growth fund, and increasing skilled labour supply to reduce productivity disparities.
LITERATURE REVIEW
Once described as a backward and passive technology adopter (Tether, Citation2005), productivity in the service sector continues to evolve with technological advancements and active adoption of new know-how (Crowley, Citation2017). The UK service sector leads in terms of GVA and plays a dominant role in economic advancement and growth (Johnston & Huggins, Citation2018). Thus, studies have called for more focus on the persistent regional disparity and preferring solutions for achieving balanced spatial growth in the UK service sector (Gardiner et al., Citation2013; Kim et al., Citation2021).
Tackling spatial disparities in productivity has now become central to government efforts in advanced economies to enhance economic growth and for policy stability and social cohesion (Gardiner et al., Citation2013). Since the early 2000s, regional productivity disparities have been increasing and have widened after the 2008 global financial crisis (McCann, Citation2020), contributing to economic concentration in some regions and relative stagnation in others within countries. These within-country disparities are large and persistent not only at the regional level but also across smaller ones, including subregions and cities (IER, Citation2016). Across Europe, the narrative is no different, as many of the high-productivity-growth countries are experiencing interregional disparities (Doran & Jordan, Citation2013), with the UK inclusive (Gal & Egeland, Citation2018).
Reducing the interregional productivity gaps, regional and local policies can play a pivotal role in mitigating the key drivers of productivity divergences, such as technology and business environment, across regions and subregions. Thus, understanding the key factors influencing the differences in productivity and economic growth is necessary. Productivity and economic performance are commonly considered at two different levels: the firm level (a micro-level) and regional (or subregional) level (a macro-level). Previous research using multilevel analysis has mainly focused on the labour productivity of the manufacturing sector, while the service sector has been overlooked. For example, Fazio and Piacentino (Citation2010) identified the positive relationship between productivity and the socioeconomic index of Italian manufacturing firms at the provincial level. Aiello et al. (Citation2014) found that firm size, exportability and research and development (R&D) investment are positively associated with productivity at the firm level, while infrastructure, private R&D intensity and efficiency of public administration are found to be positively associated with productivity at the regional level for Italian manufacturing firms. Amara and Thabet (Citation2019) also found that older firms, firms with a higher level of human capital, R&D expenditure, firms operating in information and communication technology (ICT) industries and exporting have a positive contribution to productivity at the firm level. While regional wage and industrial density are positively associated with productivity at the regional level for Tunisian manufacturing firms. On the other hand, Raspe and van Oort (Citation2011) used multilevel analysis to examine the impact of agglomerated knowledge resources on the growth of start-up manufacturing and business service firms in the Netherlands. They highlighted that at the regional level, firm growth, especially for business services, is positively influenced by non-technological innovations (i.e., marketing, management and organizational knowledge) rather than (technologically) R&D-related variables. Also, Sun et al. (Citation2007) found at the city level the positive impact service-oriented citizenship behaviour on firm productivity (sales/employee) in the hotel industry in China.
Due to the minimal research on spatial disparities in labour productivity of service SMEs in the UK, we therefore, apply a multilevel analysis to explain productivity disparities by providing a clear distinction between firm and subregion specific effects captured by LEPs. Due to the LEPs, we only focus on the service sectors in England since there are no studies on this analysis using these variables. The data and methodology are discussed below.
DATA AND METHODOLOGY
Data and descriptive statistics
The secondary data used are derived from the Longitudinal Small Business Survey (LSBS) for 2015, undertaken between July 2015 and January 2016. It is a large-scale telephone survey of small business owners/managers across the UK. The overall sample size is 15,500 firms, of which 13,403 are based in England and 10,400 (77.6%) operate in the service industries including wholesale and retail, information and communication, administrative and support, accommodation and food services, transport and storage, health and social work, and other business services. The SMEs in the service sectors are located in different regions and subregions, that is, LEPs. In England, LEPs are voluntary partnerships between local authorities and businesses set up in 2011 by the BIES to help determine local economic priorities and lead economic growth within the local areas (House of Commons, Citation2018). There are 38 LEPs in the LSBS 2015 (). London has the highest number of business services with 1713 firms, followed by the Heart of the South West (435) and Enterprise M3 (419).
Table 1. Number of businesses, growth deal fund, broadband speeds, labour supply and labour productivity by local enterprise partnerships (LEPs).
details the LEP variables used in the analysis. We merge the information on the LEP variables from the UK government sources with the LSBS 2015 via 38 LEPs. Due to multicollinearity, we cannot use all key LEP variables affecting regional and subregional productivity. Therefore, we first look at the local growth deal fund (LGF), which is the most recent policy that has been delivered to LEPs to boost their economic performance and productivity. From the Office for National Statistics (ONS), the average level of the LGF in 2014–15 is approximately £246 million, with the highest amount allocated to Leeds City Region. Regarding broadband speeds from the Office of Communications, UK (OFCOM), it shows that York, North Yorkshire and East Riding has the highest average mean level of businesses that are unable to receive broadband speeds of 2 Mbit/s. From the official labour market statistics (Nomis), the average labour supply aged 16–64 years is 1,519,035, with the highest in London. summarizes the descriptive statistics of service SMEs in England. The average SME service productivity, measured by turnover per total employee, is £113,567, with a median of £37,923. The latter indicates that the majority of service SMEs in England have low productivity.
Table 2. Definition of the variables used in the analysis.
Multilevel analysis
Understanding the difference in firm productivity in different localities is a common issue with hierarchically structured data where firms refer to different levels of spatial aggregation (Aiello et al., Citation2014). Therefore, using single-level regressions is inappropriate because they do not allow for residual components at each level in the hierarchy and treat the firms as independent observations, leading to an underestimation of standard errors (Rasbash et al., Citation2017). To address this issue, we apply the multilevel (two-level: firm and local (LEP) unit) analysis with random effects. This technique allows the firm and LEP level to be modelled simultaneously, where the factors at the LEP level are used as independent variables to explain variability in productivity at the firm level and in random components. To do this, a sufficient number of groups (LEPs) are required as otherwise the variance between groups is poorly estimated. In our case, we have 38 LEPs across England which are appropriate (Maas & Hox, Citation2005). The model can be expressed as:
(1)
(1) where Yij is the firm’s productivity in the natural logarithm form of i-th firm nested within j-th LEP; Xij is a vector of explanatory variables for the i-th firm nested in the j-th LEP; and ϵij is an error term in the hierarchical model which is assumed to have a normal distribution with mean zero and variance
.
The variation of the regression coefficients βj is modelled by a group-level regression model as:
(2)
(2)
(3)
(3) where Zj is a vector of explanatory variables at the LEP level (), where l = 1, … , L; μ0j is the group-level residuals, which is assumed to have a multivariate normal distribution with expectation zero and to be independent from ϵij. The variance of
is specified as
. Combining (1), (2) and (3) gives:
(4)
(4) The error term in (4) is now not independently distributed since firms nested in the same LEP tend to have correlated residuals, which violates the assumption of independence. In (4), the amount of dependence can be expressed as the intraclass correlation (ICC), which can be calculated from an empty model:
(5)
(5) In (5), the model does not explain any variance in Yij. It only decomposes the variance of Yij into two independent components: the variance of
(
), which is called within-group variance, and the variance of
(
), which is called between-group variance. Using (5), the ICC can be estimated by:
(6)
(6) Finally, (4) allows us to identify the appropriate contextual variables for one or more levels of analysis by accounting for the variability in the random component at the same time.
Here, labour productivity is measured by turnover per number of employees. Turnover is calculated using information from two questions in the LSBS 2015: actual turnover over the last 12 months and turnover bands over the last 12 months where firms did not disclose a precise figure (here we used the midpoint of the band indicated by firms). This measure is used in many productivity studies of business services (Vogel, Citation2011), whereas the total factor productivity is largely used in manufacturing and could not be measured due to data limitations. Service productivity also requires a slightly different approach from manufacturing due to the heterogeneous business characteristics and the quality (satisfaction) of consumer services (Johnston & Jones, Citation2004; Kim et al., Citation2021). Here, we cannot calculate this measure due to the data limitation on service quality. Due to the productivity measure, cross-sectional analysis was used to produce a robust analysis and accurate results since using a panel analysis may lead to underestimated productivity because of the midpoint productivity and most of the independent (dummy and discrete) variables do not vary over time. We also control for variations across the English regions by grouping London and the South East together as they are the leading region in overall productivity.
RESULTS AND DISCUSSION
presents the results of the multilevel models for service SMEs. Model I is regressed without the regressors to identify the errors that result from differences across firms and LEPs. Model II only includes the firm-level predictors. Model III adds the region dummies as the predictors. The LEP-level variables are then added in model IV. The likelihood-ratio (LR) tests for all models are statistically significant (p < 0.05), indicating that using multilevel modelling is required and the intercept should be considered as an LEP-by-LEP variant coefficient. The ICC indicates that 1.0% (0.010) of SMEs’ productivity can be explained by their mere spatial location. Although this value is relatively small, we cannot ignore it as there is a random intercept in the model (µ0j ≠ 0) (Maas & Hox, Citation2005). Following Fazio and Piacentino (Citation2010) and Aiello et al. (Citation2014), we also check for the possibility of cross-level endogeneity by adding the level-2 means of level 1 explanatory variables as a regressor to the models. These variables are statistically insignificant, indicating that there is no issue of endogeneity.Footnote1 Additionally, we estimate Akaike’s information criterion (AIC) to compare the models’ performance. Model IV is preferable with the lowest AIC.
Table 3. Determinants of small and medium-sized enterprises’ (SMEs) productivity in the business service sector using multilevel analysis.
In model IV, at the firm level, the results show that sole traders and younger firms are negatively associated with productivity. This could be because of the uncertainties of start-ups and the role of learning by doing for achieving productivity gains (Ries, Citation2011), while older firms are estimated to have higher productivity levels. Moreover, micro-businesses are negatively associated with productivity, yet small businesses have a positive contribution to productivity. We also find that SMEs with a strong capability for accessing external finance and those who used external information/advice tend to increase their productivity. This suggests the importance of external knowledge for service SMEs to gain productivity. However, women-led businesses are negatively associated with productivity. This could be explained by the fact that women-led businesses are traditionally related to fields where low-paid jobs proliferate such as health and social care (Carter et al., Citation2013). Likewise, businesses located in deprived regions tend to have lower productivity.
In addition, the results suggest that the type of sector matters in determining firm productivity. SMEs operating in the health and social work industries have a negative relationship with productivity, which may be explained by the lack of skilled workers and low-paid jobs, and the rest is positively associated with productivity. The results also reveal that being a member of a social media-based business and a local chamber of commerce have a positive effect on productivity. This allows SME owners/managers to gain market information and opportunities for adding value outside of their immediate circle of contacts (Naudé et al., Citation2014). Regions also matter for productivity as the results of model III show that firms located in London and the South East are positively associated with productivity. Our result follows the general findings of the ONS (Citation2018) in which London and the South East have a higher level of productivity than other areas.
At the LEP level, the LGF has a negative association with productivity. This can imply that the funding is primarily distributed to low productivity LEPs, which follows the purpose of this funding to help boost local economies and improve low productivity at the LEP level. From the descriptive statistics in , this funding is likely to be linked to the government’s regional policies such as Midlands Engine and Northern Powerhouse since it is likely to provide for low productivity LEPs such as Leeds City Region, Greater Manchester, Greater Birmingham and Solihull, and North East LEPs. From the foregoing, it can be inferred that the government has attempted to address low productivity through the devolution and decentralization of the UK national–subnational governance system (McCann, Citation2020). Otherwise, the negative relationship would raise questions about whether or not the LGF has a clear focus on tackling low productivity for service SMEs in each LEP. We also find that SMEs located in the LEPs with a high number of labour supply increase productivity. This finding suggests that an increase in the number of labour supply can provide an opportunity for employers to choose workers with the right skills for their industries (Robson & Saunders, Citation2004). In addition, limited access to basic broadband speeds (2 Mbit/s) tends to reduce productivity. This indicates that broadband speeds can improve productivity for business services as businesses are well-connected with online services, operations and communications.
CONCLUSIONS
This paper examines the spatial determinants of individual-level firm’s characteristics and contextual-level (subregional) on SME productivity for business industries in England using the LSBS 2015. After controlling for the hierarchically structured data, this paper highlights that variations in firm characteristics (firm age, size, type, sector, business network and capabilities) and LEPs (broadband speeds, LGF and labour supply) lead to disparities in SME productivity in the service sector in England. This suggests the need for adequate support at the LEP level.
Key policy implications to support service SMEs can be drawn from the results. First, the significant relationship between LGF and productivity can confirm that the LGF is likely to contribute to the LEPs with low productivity, which could support the government’s regional policies to rebalance the UK economy. Yet, since not all the LEPs with low productivity are located in the targeted regions, the monitoring and distributing process of the funding and the evaluation of the related business activities should be improved and standardized. Identifying the LEPs with the strongest and weakest in their productivity could help develop better strategies for effective usage of funding that can fairly be distributed across the regions and local economies. Second, investments and improvements of high broadband speeds (i.e., superfast or ultrafast broadband) as well as digital infrastructure are vital for thriving service SME productivity. Next, a business network membership (the local chamber of commerce and social media-based business networks) and gaining external knowledge can improve productivity. Thus, support for start-ups and established SMEs should pay attention to business networks rather focusing on internal considerations. Additionally, start-ups, micro-businesses and those in deprived areas should be funded to support learning, R&D, capital investment and reaching new markets. Finally, health/social work industries require more support and investment in training and development for all skill levels, particularly at the management level, which can help improve their productivity.
This paper highlights some avenues for further research. Given its quantitative nature, interviewing management-level personnel is recommended to gain deeper understandings of productivity and business obstacles in the real business setting. Our results reveal that women-led SMEs record significantly lower productivity; further research could explore the challenges and opportunities in women-led businesses. Considering labour productivity amongst business services, further research could consider the form of understated quality change. Lastly, due to data limitation, future research would benefit from a longitudinal data analysis to better understand firm and regional determinants of productivity over time and across different spatial levels.
ACKNOWLEDGEMENT
The authors thank the reviewers and Dr Declan Jordan for constructive comments. They are grateful to the Department for Business, Energy and Industrial Strategy (BEIS), UK, for data, which is available upon request at the UK Data Service.
DISCLOSURE STATEMENT
No potential conflict of interest was reported by the authors.
Additional information
Funding
Notes
1 The results are available from the authors upon request.
REFERENCES
- Aiello, F., Pupo, V., & Ricotta, F. (2014). Explaining total factor productivity at firm level in Italy: Does location matter? Spatial Economic Analysis, 9(1), 51–70. https://doi.org/10.1080/17421772.2013.863428
- Amara, M., & Thabet, K. (2019). Firm and regional factors of productivity: A multilevel analysis of Tunisian manufacturing. The Annals of Regional Science, 63(1), 25–51. https://doi.org/10.1007/s00168-019-00918-x
- BEIS. (2018). Statistic release: Business population estimates for the UK and regions 2018. Retrieved August 9, 2019, from https://www.gov.uk/government/statistics/business-population-estimates-2018
- Carter, S., Ram, M., Trehan, K., & Jones, T. (2013). Diversity and SMEs, Enterprise Research Centre White Paper No. 3. Retrieved April 16, 2019, from https://www.enterpriseresearch.ac.uk/wp-content/uploads/2013/12/ERC-White-Paper-No_3-Diversity-final.pdf
- Crowley, F. (2017). Product and service innovation and discontinuation in manufacturing and service firms in Europe. European Journal of Innovation Management, 20(2), 250–268. https://doi.org/10.1108/EJIM-03-2016-0027
- Doran, J., & Jordan, D. (2013). Decomposing European NUTS2 regional inequality from 1980 to 2009. Journal of Economic Studies, 40(1), 22–38. https://doi.org/10.1108/01443581311283484
- Fazio, G., & Piacentino, D. (2010). A spatial multilevel analysis of Italian SMEs’ productivity. Spatial Economic Analysis, 5(3), 299–316. https://doi.org/10.1080/17421772.2010.493953
- Gal, P., & Egeland, J. (2018). Reducing regional disparities in productivity in the United Kingdom. OECD Economics Department Working Papers, No. 1456.
- Gardiner, B., Martin, R., Sunley, P., & Tyler, P. (2013). Spatially unbalanced growth in the British economy. Journal of Economic Geography, 13(6), 889–928. https://doi.org/10.1093/jeg/lbt003
- House of Commons. (2018). Small businesses and productivity Fifteenth Report of Session 2017–19. Retrieved March 20, 2019, from https://publications.parliament.uk/pa/cm201719/cmselect/cmbeis/807/807.pdf
- IER. (2016). The Northern Powerhouse independent economic review: Final executive summary report.
- Johnston, A., & Huggins, R. (2018). Regional growth dynamics in the service sector: The determinants of employment change in UK regions 1971–2005. Growth and Change, 49(1), 71–96. https://doi.org/10.1111/grow.12221
- Johnston, R., & Jones, P. (2004). Service productivity. International Journal of Productivity and Performance Management, 53(3), 201–213. https://doi.org/10.1108/17410400410523756
- Kim, Y. R., Williams, A. M., Park, S., & Chen, J. L. (2021). Spatial spillovers of agglomeration economies and productivity in the tourism industry: The case of the UK. Tourism Management, 82, 104201. https://doi.org/10.1016/j.tourman.2020.104201
- LSE Growth Commission. (2017). UK growth: A new chapter. London.
- Maas, C. J. M., & Hox, J. J. (2005). Sufficient sample sizes for multilevel modeling. Methodology, 1(3), 86–92. https://doi.org/10.1027/1614-2241.1.3.86
- McCann, P. (2016). The UK regional–national economic problem. Routledge.
- McCann, P. (2020). Perceptions of regional inequality and the geography of discontent: Insights from the UK. Regional Studies, 54(2), 256–267. https://doi.org/10.1080/00343404.2019.1619928
- Naudé, P., Zaefarian, G., Tavani, Z. N., Neghabi, S., & Zaefarian, R. (2014). The influence of network effects on SME performance. Industrial Marketing Management, 43(4), 630–641. https://doi.org/10.1016/j.indmarman.2014.02.004
- OECD. (2020). Level of GDP per capita and productivity: OECD productivity level since 1990. OECD.stat. Retrieved October 10, 2020, from https://stats.oecd.org/Index.aspx?QueryId=95561
- ONS. (2018). Regional and sub-regional productivity in the UK: February 2018. Retrieved August 9, 2019, from https://www.ons.gov.uk/employmentandlabourmarket/peopleinwork/labourproductivity/articles/regionalandsubregionalproductivityintheuk/february2018
- Rasbash, J., Steele, F., Browne, W. J., Goldstein, H., & Charlton, C. (2017). A user’s guide to MLwiN. Retrieved August 9, 2019, from http://www.bristol.ac.uk/cmm/media/software/mlwin/downloads/manuals/3-01/manual-web.pdf
- Raspe, O., & van Oort, F. (2011). Growth of new firms and spatially bounded knowledge externalities. The Annals of Regional Science, 46(3), 495–518. https://doi.org/10.1007/s00168-009-0357-9
- Ries, E. (2011). The lean startup: How today’s entrepreneurs use continuous innovation to create radically successful businesses. Crown.
- Robson, L., & Saunders, V. (2004). LMI matters! Understanding labour market information. Retrieved August 9, 2019, from https://warwick.ac.uk/fac/soc/ier/ngrf/effectiveguidance/improvingpractice/lmi/lmi_matters_lsc.pdf
- Sun, L. Y., Aryee, S., & Law, K. S. (2007). High-performance human resource practices, citizenship behavior, and organizational performance: A relational perspective. Academy of Management Journal, 50(3), 558–577. https://doi.org/10.5465/amj.2007.25525821
- Tether, B. S. (2005). Do services innovate (differently)? Insights from the European Innobarometer Survey. Industry & Innovation, 12(2), 153–184. https://doi.org/10.1080/13662710500087891
- Vogel, A. (2011). Exporter performance in the German business services sector. The Service Industries Journal, 31(7), 1015–1031. https://doi.org/10.1080/02642060903079410