
ABSTRACT
This paper studies the strongly asymmetrical distribution of the population, quality of life and economic development in Portugal. It identifies homogeneous areas supported by an analysis of competitiveness, cohesion and environmental quality dimensions. Drawing on a multivariate approach, its findings reveal differences in terms of development across the country. The study identified groups of regions with common characteristics that go beyond the standard north–south or coastal–inland distinctions. Metropolitan areas and export-oriented regions are clearly distinguishable from the remainder of the country. Economic agglomeration indicators, as gross domestic product per capita, population density, resident foreign population and youth index, among others, are those that reveal greater diversity across the country.
INTRODUCTION
Territorial development has been an important research topic for many experts from different fields, with theories supporting some political options for development (Ianoş et al., Citation2013). However, when considering territorial development as a comprehensive process of economic, environmental and social dimensions, one of the major difficulties of analysis lies in the effective tools for their integrated assessment. These tools, which can be territorial indexes (Ianoş et al., Citation2013), numerous indicators or other reliable measures, generally combine the domains of physical and social sciences and calibrate progress towards sustainable development goals. They may also perform other functions, for instance, supporting decision-making processes in territorial policies of sustainable development, or preventing economic, social and environmental setbacks (UN CSD, Citation2007).
In Portugal, the distribution of the population and economic activity is very uneven, creating significant differences in regional territorial development. After a relative decline of agriculture and the increased draw of urban areas over the decades, a variety of circumstances and problems can explain the strong disparity within Portuguese regions (e.g., rural depopulation and intensification of the agglomeration effects in urban areas, the decline of traditional economic sectors, the tertiarization of economic activities or the desertification of territories). Even with the recent growth in the agricultural sector, as well as its relatively respectable economic performance, some areas continue to suffer from low wages, depopulation, an ageing population and underemployment. In areas with low activity rates and high levels of unemployment, it is difficult to reverse the situation.
These differences generally reveal a clear distinction between the north and the south of the country, and between coastal and inland areas. The latter are considered to have an ageing population and being rural and economically depressed, whereas coastal districts are viewed as youthful, urban, dynamic and economically vibrant. Nevertheless, a comprehensive study should be carried out to discuss whether there are similar levels of development in inland and coastal areas when considering their territorial (economic, social and environmental) capital. Therefore, any original approaches that can be effective to assess intra-regional disparities, and consequently provide useful information to support the population and its decision-making processes should be endorsed.
According to Ferrão (Citation2013), the traditional way of discussing the problem of territorial disparities in Portugal is not the one that best reflects reality. Additionally, Fernandes (Citation2019) suggests a more comprehensive and rich interpretation of the country than solely the dichotomies city–country, Lisbon–‘province’ or coastal–inland. In fact, differences in Portuguese regional development should go beyond the old concept of the north–south or the coastal–inland distinction, thus drawing up a new geography of development. It appears more relevant to represent such differences as ‘archipelagos’, a term proposed by Ferrão (Citation2002). These ‘archipelagos’ consist of two or three larger islands of development, which are significantly set apart from the general level of development revealed in the remaining areas of Portugal. This requires a new developmental approach, grounded in the specificities of the territory and not simply on the most common administrative territorial divisions or the rationality of redistribution mechanisms (Dias & Seixas, Citation2019). Portugal is a very centralized country (Alexandre et al., Citation2020), where development priorities have been set by administrative divisions following a top-down programming and financing strategy (Seixas et al., Citation2020). The main failure of current public policies can be attributed to their centralized and sectorial natures, which are applied uniformly throughout the country, thus worsening the interregional development differences. An innovative approach to exploring territorial differences is needed in order to improve knowledge and mitigate these interregional differences.
The aim of this study is to identify, through segmentation and discrimination analysis, homogeneous areas that are developed to a greater or lesser extent, whether in the north or the south, the coast or inland. In order to achieve this aim, a set of variables was chosen from the Portuguese regional development composite index, established by Statistics Portugal and the Department of Prospective and Planning (INE, IP/DPP, Citation2009). Going beyond the traditional dichotomy of the development analysis variables, this article demystifies the conventional view on differences in regional development in Portugal through a holistic clustering approach, as it integrates the economic (competitiveness), social (cohesion) and environmental (environmental quality) perspectives.
The remainder of the paper is structured as follows. The next section reviews previous research on the differences in intra-regional development. The third section describes the data and the methods used. The fourth section presents the results and a respective discussion. The paper concludes with a discussion and conclusions.
DIFFERENCES IN INTRA-REGIONAL DEVELOPMENT
Issues of definition were reviewed to examine what is meant by local and regional development, its historical context and the importance of its geographies of space, territory, place and scale. Definitions of local and regional development have broadened to include economic and social, environmental, political and cultural concerns. Definitions are socially determined in the context of historically enduring themes, principles and values, incorporating geographical differentiation and changes over time. Geography matters as a causal factor in local and regional development. Territories evolve as defined areas in which particular definitions of local and regional development are constructed and pursued. Places shape the geographical diversity, unevenness and context of local and regional development. Economic, social, political, environmental and cultural processes influence local and regional development across, between and through different scales. (Pike et al., Citation2007, p. 1265)
In order to understand the differences between territorial or personal development, it is necessary to consider a broad set of variables. This idea is shared by several authors, including the following:
Regions have been studied from a variety of disciplinary perspectives: economic, legal, geographical, sociological, historical, cultural and political. None is determinant but an interdisciplinary approach enables a richer understanding of the phenomenon. (Keating, Citation2017, p. 16)
Theories of economic development have variously and separately emphasized the importance of resource endowments, physical infrastructure, finance and productive investment, skills and human capital, advanced knowledge and innovation, and the quality of public institutions and leadership. The synergies between them are clearer and more concrete at the city and regional levels than at national level. (Turok et al., Citation2017, pp. 2–3)
The proposal for an SDO index for Organisation for Economic Co-operation and Development (OECD) countries, which identified the SDO guidelines and determined the priorities for its implementation in each country, first emerged in the report Sustainable Development Goals: Are the Rich Countries Ready? (Kroll, Citation2015). This report captured the attention of policy-makers and the media.
The effort undertaken by the Overseas Development Institute is also worth mentioning. It presented a regional SDO framework, estimating trends across SDO key dimensions in order to determine the areas in which acceleration will be required for further progress (Nicolai et al., Citation2015). This shows that in several areas current trends need to be changed in order to fulfil the SDO. However, it does not allow for conclusions to be drawn at a country level as the analysis has been carried out in multiple regions of the world based on regional clusters.
Additionally, the OECD has been working on the construction of sustainable development indicators, including its better life index, which allows for comparisons of quality of life, both globally and in accordance with criteria considered in the organization’s member countries.Footnote1
In Europe, the Sustainable Development Indicators were developed to monitor the implementation of the European Union’s (EU) Sustainable Development Strategy. These were based on existing indicator initiatives such as those of the UN Commission on Sustainable Development and the OECD, as well as the core set of indicators from the European Environment Agency (CEC, Citation2005). A large number of countries have developed their own national set of indicators, often based on the indicators already established at an international or European level.
In Portugal, many of the studies that concern social, economic, cultural or political issues assume that geographical diversity and territorial asymmetries do not matter (Ferrão, Citation2013). The focus on territorial development and the problem of unequal development of places/regions is recent and was highlighted in the context of the country’s integration in the European Economic Community (EEC) during the 1980s. This was the period when, in the EEC framework, the policy against territorial asymmetries began to gain prominence, particularly through the implementation of the Delors Package I in the framework of the second European enlargement. European policy is based on the strengthening of economic, social and territorial cohesion between its member states. In Portugal’s case, the path to bringing the country’s standard of living closer to the European standard has changed from its initial route of convergence. It shifted towards a process of visible divergence that started in the mid-1990s. The convergence process has been more difficult in regions that reveal a lower standard of living, as limitations go far beyond the redistribution of resources, reaching their own models of investment and competitiveness (Mateus, Citation2015, p. 43).
Studies on differences in Portuguese territorial development are numerous and diverse, as identified by Ferrão (Citation2013), who divided them into those that only address a specific area of knowledge and those which intend to understand a set of development issues. These have been developed by researchers and national and international institutions. The territorial scope of intra-national analysis usually coincides with one of the administrative or statistical scales in the country (municipalities or NUTS-II or -III).
Statistics Portugal (INE) and other public institutions have developed some complex indicators that aim to measure the global level of development taking the distinct regions or people into consideration. Among others, a Proposal of Sustainable Development Indicators was published (DGA, Citation2000) identifying indicators that are grouped in four themes: environmental, economic, social and institutional. The study was revised and updated (APA, Citation2007) to better suit the objectives and goals of the Portuguese Sustainable Development Strategy (RCM, Citation2007). A linkage to INE was established and data were collected taking into account the seven objectives of the Portuguese Sustainable Development Strategy, as well as the three ranks of indicators (base indicators, key and regional indicators and sectorial indicators) at different geographical levels: national, with possible disaggregation at NUTS-II level and occasionally at the local level (APA, Citation2007; Simão, Citation2013).
Another approach, proposed by INE, IP/DPP (Citation2009), consists of constructing a composite indicator of development. Its objective is to create a tool that supports the territorial analysis of public policies. Data analysis and results refer to the NUTS-III level (allowing, by a process of aggregation, to also make analysis at the NUTS-II level). The so-called regional development composite index is based on a three-fold dimension with a total of 85 indicators: competitiveness (35), cohesion (35) and environmental quality (15). This follows the recent discussion about territorial cohesion and therefore is more appropriate for the present analysis. A previous study by Mateus (Citation2005) was centred on two dimensions – territorial competitiveness, and economic and social cohesion – and is considered to have been the first step towards the development of this composite index.
A different approach was developed by Silva and Ferreira-Lopes (Citation2014), based on the methodology of the HDI from the UN proposing a regional development index for Portugal at the NUTS-III level. The authors stated that in addition to the dimensions of HDI (income, health and education), governance and environment were included in order to fill the gap found in the literature.
These studies are developed upon different approaches, methodologies and spatial scales, thus creating and interpreting complex indexes in order to identify distinct levels of regional development. Although these studies are becoming increasingly more detailed, complex and robust (as they include more variables or indicators), this only allows for the positioning of regions in a development ranking. The findings of these studies are not further explored in order to group regions together or to understand any similarities between them. Therefore, they are not necessarily contributing towards improving the design or application of effective public policies.
DATA AND METHODS
The study used a multivariate approach in order to fulfil its objectives of attempting a classification of territorial units according to their respective levels of development and distinguishing them through the most relevant variables. However, several approaches and different variables and dimensions are possible and frequently used in the analysis of territorial levels of development. Thus, from a research perspective, the core methodological question relates to the choice of variables applied and their respective territorial level of detail.
From the above and considering the purpose of this study, the choice of indicators was based on the regional development composite index (INE/GET, Citation2015; INE IP/DPP, Citation2009). In fact, much of the data presented in the index come from a specific collection undertaken by various institutions and organizations, which are properly treated but not available to the public for further analysis. Therefore, the choice of indicators was conditioned by the available data in the national statistical system. The large number of original indicators was reduced in order to better suit the objectives of the study and the statistical methods adopted. The intention was to ensure that the analysis entailed the interconnection of competitiveness, territorial cohesion and improved environmental quality, as the original model proposes (INE, IP/DPP, Citation2009). In order to achieve a comprehensive analysis of territorial cohesion (or lack thereof) and of the differences in development levels between the NUTS-III regions, an indicator based on drivers of sustainability (economic, social and environmental domains) was built. This indicator is adequate and relevant in the assessment of the performance of the different units and the processes of convergence between them. The original index is a composite index (INE, IP/DPP, Citation2009), which was the approach used in this research work.
The variables originally proposed in the model were selected, directly collected and used, whenever possible. In other cases, appropriate proxies for the territorial context under study were used and the indicators required for the analysis were created. The data were drawn mainly from the CENSUS 2011, but the variables relating to the domains of science and education were collected from more recent years (the last available year).
Nevertheless, due to the proposed territorial approach the availability of such data raised a methodological question. Because of the level of detail the study required in order to achieve its objectives, national and NUTS-II levels are not suitable for this analysis. Moreover, the geographical area (NUTS-III approach) also allows some additional detail in the territorial analysis of Portugal. The choice of this territorial level arises from the compromise between the (relative) availability of data and the more detailed geographical scale, compared to the larger ones.
The variables, and respective indicators (), were chosen with the objective of correctly assessing the competitiveness, cohesion and environmental quality dimensions according to the proposed model (INE/GET, Citation2015; INE, IP/DPP, Citation2009) and the data available. Most variables (cf. ) have a positive and direct relationship to both the domains of analysis in which they are integrated (competitiveness, cohesion and environmental quality) and the evaluation of development in a broader sense. Competitiveness aims to identify the potential for economic growth, efficiency in generation and attraction of wealth, and a region’s capacity for international integration. Cohesion, in turn, seeks to assess the population’s access to basic equipment and services leading to greater social inclusion and improved quality of life. Environmental quality seeks to capture the effect on the environment caused by economic activities and social practices. Although the diversity of variables was not a problem for principal component analysis (PCA), it could be for the cluster analysis (CA). In this method, standardized variables (Z) were evaluated. The results were not qualitatively different, which suggested following methods of analysis based on original variables, thus avoiding loss of information.
Table 1. Territorial development indicators.
This analysis emphasizes that in order to measure the degree of achievement of territorial development, it is more significant to examine homogeneous areas in accordance with the relevant parameters rather than measuring it according to defined criteria, or simply through exploring territorial disparities and/or inequalities at a regional or subregional level. Here, the focus is to show a ‘new geography’, based on relevant territorial factors in order to demystify preconceived ideas about development differences in Portugal, that is, no longer limited to north/south or inland/coastal areas.
Regional differences in development can be analysed through various statistical and econometric methodologies. These include multivariable statistics and, in particular, CA (Angelis et al., Citation2016; Diniz & Sequeira, Citation2008; Folmer & Heijman, Citation2005; Goletsis & Chletsos, Citation2011; Ianoş et al., Citation2013; Pinto & Guerreiro, Citation2010; Soares et al., Citation2003).
This analysis is based on CA and on linear discriminant analysis (LDA). Given the objectives of the study, these methods were considered the most appropriate to classify the territorial units (NUTS-III) and distinguish them according to their respective levels of development. Since multiple clusters were obtained, discriminant analysis was used to confirm the most relevant variables for the distinction between these clusters. CA groups objects (observations, events) based on the information found in the data describing individuals, objects or their relationships. The goal is to attain both homogeneity within groups and heterogeneity between groups. The greater the similarity (or homogeneity) within a group, and the greater the difference between groups, the ‘better’ the clustering process. Objects or individuals (samples, measurements, patterns, events) are usually represented as points (vectors) in a multidimensional space, where each dimension represents a distinct attribute (variable, measurement) which describes the object. For purposes of simplicity, it is normally assumed that values are present for all attributes. The data are sometimes transformed before being used, as different attributes may be measured on different scales, for example, centimetres and kilograms. In cases in which the range of values differs widely from one attribute to another, these different attribute scales can dominate the results of the CA. Therefore, the data are usually standardized so that all attributes are on the same scale (Hair et al., Citation2014). In hierarchical clustering, the objective is to produce a hierarchical series of nested clusters, ranging from clusters of individual points at the bottom to an all-inclusive cluster at the top. To develop this analysis and validate the results several approaches were used. The presence of multicollinearity was also evaluated, and an exploratory factor analysis was used in order to have orthogonal factors and compare the results. Due to space restrictions, only Ward’s method results are presented. According to Ward’s method, the proximity between two clusters is defined through the increase in the squared error resulting from merging of the two clusters. While this technique may appear somewhat distinct from other hierarchical procedures, some algebra reveals that this practice is very similar to the group average method when the proximity between two points is taken to be the square of the distance between them (Hair et al., Citation2014).
LDA performs the same task as multiple linear regression by trying to predict an outcome. It is closely related to a regression analysis, which also attempts to express one dependent variable as a linear combination of other features or measurements. Logistic and probit regressions may be considered similar to LDA as they also explain a categorical variable by the values of continuous independent variables. These other methods are preferable in applications in which it is not reasonable to assume normal distribution of the independent variables, which is a fundamental assumption of the LDA method such as the homogeneity of group variances.
LDA uses a collection of interval variables to predict a categorical variable, which in turn may be a dichotomy or have more than two values. The technique involves finding a linear combination of independent variables (predictors) – the discriminant function – that generates the maximum difference between group memberships in the categorical dependent variable (Hair et al., Citation2014). By creating an equation that will minimize the possibility of misclassifying cases in their respective groups or categories, LDA is a tool for predicting group membership from a linear combination of variables (Agresti, Citation1996).
RESULTS
This section reports the findings of the study, showing the existence of differences between Portuguese regions.
Portugal is an unequal territory, as shown by the latest results of the synthetic index of regional development. In 2014 and 2018, of a total of 25 Portuguese NUTS-III regions, only four exceeded the national average in terms of global regional development: the metropolitan areas of Lisbon; Porto; the Region of Aveiro in both years; Alto Minho in 2014, and Cávado in 2018 (INE, Citation2016, Citation2020). Silva and Ferreira-Lopes (Citation2014) conclude that most of the highest ranked NUTS-III regions are on the coast, with Greater Lisbon in first position. The National Programme for Territorial Cohesion (UMVI, Citation2016) identifies a progressive movement towards coastal areas of the country and the impoverishment, ageing and depopulation of inland regions (two-thirds of the national territory).
In a first phase, in order to analyse and describe the data, some descriptive statistics are presented (). For the majority of the variables identified, the difference between the values is clear, revealing the territorial heterogeneity of the country.
Table 2. Descriptive statistics.
Cluster analysis (CA)
To better understand the differences throughout mainland Portugal,Footnote2 a CA was performed and several distance measures and agglomeration methods were investigated. After this exploratory analysis and considering the levels of performance and adjustment, Ward’s method was chosen to show the results. The main goal is to identify homogeneous groups – meaning, in this case, regions that present identical levels of development. and and in Appendix A show the results.
Figure 1. Dendrogram based on all variables.
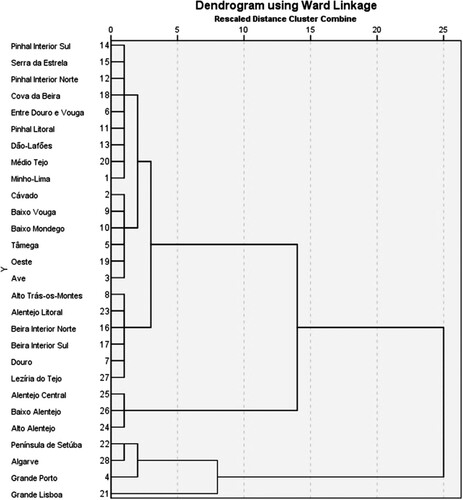
Figure 2. Clusters of Portuguese regions.
Note: These groups of regions show the results for the index with three dimensions as well as environmental quality.
Source: Authors’ elaboration.
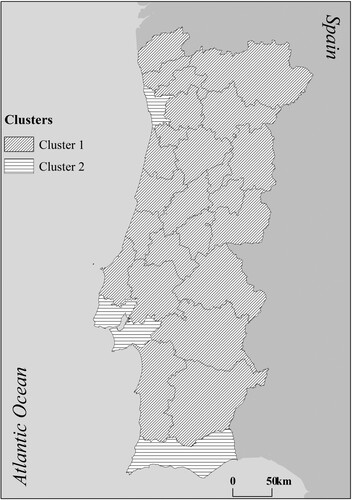
This method clearly identifies two different areas of Portuguese territories (considering only the mainland): cluster 1 includes the majority of inland NUTS-III all over the country, in the distinct geographies; and cluster 2 consists of the metropolitan areas (Greater Lisbon and Greater Porto) and the regions with higher rates of exports (Setúbal peninsula and the Algarve). These differences in socio-territorial characteristics lead to the classification of the clusters mapped in .
In order to understand which characteristics distinguish the clusters obtained, an LDA was performed. The stepwise method allows identification of the discriminant variables in statistical terms (see in Appendix A). The analysis identifies gross domestic product per capita (PIB_pc), foreign population with legal resident status as a percentage the population (PER), youth index (IJ) and urban waste produced (RUPE) as the variables responsible for the differentiation of clusters. The variables that best distinguish the identified clusters are strongly related to the dynamism of economic activity and greater population dynamics, which is confirmed by the results achieved for the metropolitan areas (cluster 2), clearly higher than the averages of cluster 1 (cf. ).
Table 3. Averages of discriminant analysis.
According to the results of LDA regarding the quality of classification (classification results), 100% of the cases are correctly classified, confirming the robustness of the discriminant analysis performed. The Box-M test was performed and the null homogeneity of group variances was not rejected.Footnote3
The results were validated using R2 and analysis of variance (ANOVA) for several experiments and different distance measures. presents the ANOVA tests for each variable. According to these assessments, about half the variables may be considered statistically equal in both groups (). Regarding these variables, the difference between the means of each cluster is not considered statistically significant (10% of significance) – proportion between the value of goods imported and exported by companies (PIEE), employed population (PE), number of established companies (SC), longevity index (IL), population connected/served by public water supply systems (%) (PSSAA), inhabitants per doctor employed in health centres (HMSCS), youth index (IJ), unemployment by individual employed (DES), illiteracy rate (TA), proportion of the population served by wastewater treatment (PPSETAR), agricultural area used (SAU), and burnt area (AA) – all belong mainly to the cohesion and environmental quality dimensions. This is a result of public social policy, as infrastructural improvement – sectorial, national and also local – is transversal across the whole territory. These policies have been greatly intensified during recent decades, induced by the European Community’s financial support.
Table 4. Tests of equality of group means.
Cluster 1 is transversal to the country, beyond the traditional differentiation of north–south or inland–coastal, revealing weak territorial population density as well as low density of economic activity. It covers a vast territory where agricultural activities were traditionally dominant (primary sector). Nowadays, this rural territory, in its multifunctional activities, remains extremely relevant and shows an economic transition towards the social and economic services of the tertiary sector. Cluster 2 comprises the two metropolitan regions: those with the highest population density and most activities, and regions predominantly associated with exports. This result is consistent with others presented in previous studies such as Figueiredo (Citation2005), Mateus (Citation2005), Mateus (Citation2015) and Reis (Citation2015), among others. Besides the metropolitan areas of Lisbon and Porto, there is a coastal strip from Braga-Viana to Setúbal, where the main sectoral clusters of the Portuguese economy are concentrated.
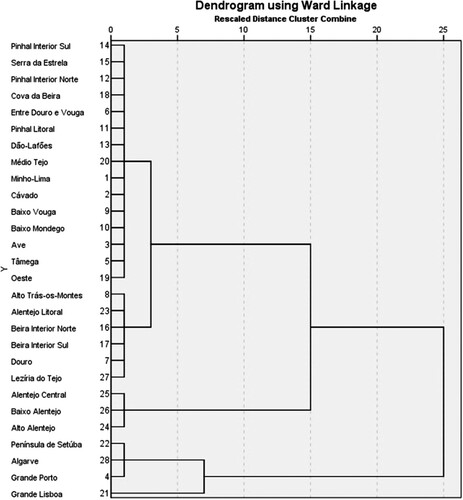
Considering the three dimensions of the regional development composite index (competitiveness, cohesion and environmental quality), a second analysis was performed to verify the distribution of the Portuguese NUTS-III, per dimension. and show the results based on clusters by each dimension.
In the competitiveness dimension, the clusters were formed based on the variables identified in . The results show two clusters: the metropolitan areas of Lisbon and Porto versus the rest of the country ( and ). The stepwise method confirms that the variables with greatest discriminatory power are gross domestic product per capita (PIB_pc), population density (Dpop), number of computers connected to the internet in primary and secondary schools (CLIE) and accommodation and food companies (EAR). These results reflect the differences in concentration of the population and the generation of wealth, as well as development of the information society and tourist activity ( and in Appendix A). All these issues usually reflect the economic growth and increase in productive capacity related to the highest concentration of employment and population. In this domain, the differences between clusters are mainly due to the variables related to the creation of wealth. These are strongly linked not only to the investment and dynamism of private economic agents but also to the public strategy of including new information and communication technologies in schools.
Figure 3. Dendrogram analysis based on competitiveness variables.
Source: Authors’ elaboration.
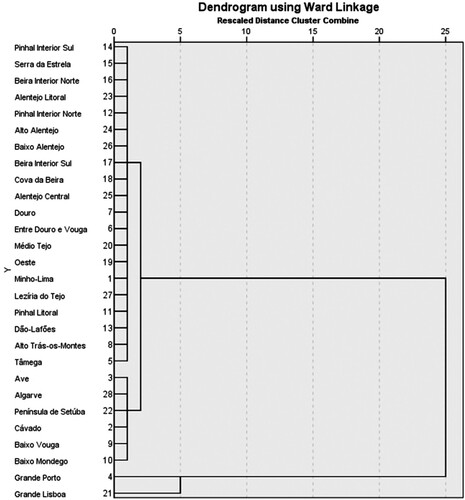
Figure 4. Clusters of Portuguese regions based on the competitiveness dimension.
Note: These groups of regions show the results for the competitiveness dimension as well as the cohesion dimension.
Source: Authors’ elaboration.
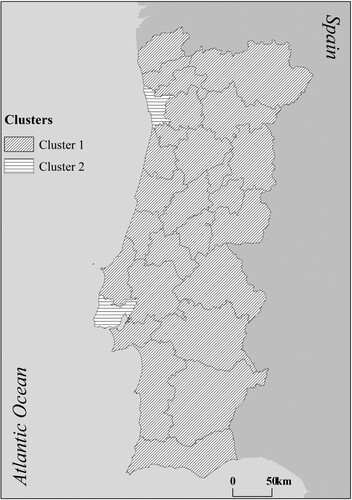
Table 5. Averages of discriminant analysis based on competitiveness variables.
According to the classification results, 100% of the original cases are correctly classified, which confers stability to the discriminant analysis performed. Again, the Box-M test was performed and the null homogeneity of group variances was not rejected, confirming the robustness of the results.
The ANOVA test for equal averages for these variables confirms the differences between clusters (). The variables for which the difference of means between groups is not statistically significant are the following: proportion between the value of goods imported and exported by companies (PIEE), employed population (PE), number of established companies (SC), and foreign population with legal resident status as a percentage of the population (PER). All these variables show that despite the strong differences between regions, some features of economic dynamics and employment do not differ significantly across the country.
Table 6. Tests of equality of group means based on competitiveness clusters.
In order to confirm the results, the factor analysis was tested. In the competitiveness domain, a factor analysis was performed based on the principal components’ methods, using the criterion based on the eigenvalues of the component matrix.Footnote4 The results obtained with the orthogonal factor confirm the results given by the CA, based on the original variables. Economic performance, wealth creation and attracting population detach the metropolitan areas from all the other Portuguese regions.
The second LDA was performed on the clusters obtained through the variables of the cohesion dimension (; cf. the variables in ). Cluster 1 includes most of the territory and cluster 2 is formed by NUTS-III of the Metropolitan Areas of Lisbon (Greater Lisbon) and Porto (Greater Porto). According to the classification results, 100% of the original cases are correctly classified, which confers robustness to the discriminant analysis performed. The Box-M test was performed, confirming the homogeneity of group variances. Data shows that teaching staff in higher education (DIES), unemployment by individual employed (DES) and proportion of the population with a secondary education (PPES) are the variables that significantly contribute to the distinction between clusters ( and in Appendix A).
Figure 5. Dendrogram analysis based on cohesion variables.
Source: Authors’ elaboration.
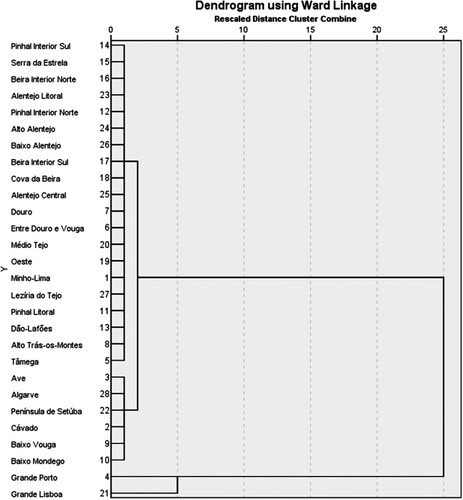
Table 7. Averages of discriminant analysis based on cohesion variables.
These variables are mainly related to education and labour market participation. The F-statistic of ANOVA demonstrates that the averages of the variables are not statistically equal (): longevity index (IL), population (%) connected/served by public water supply systems (PSSAA), inhabitants per doctor employed in health centres (HMSCS), youth index (IJ), unemployment by individual employed (DES), illiteracy rate (TA), and proportion of the population with a secondary education (PPES). These variables confirm the relevance of social public policy and infrastructures, as well as the populational structure, which affect the country as a whole.
Table 8. Tests of equality of group means based on cohesion clusters.
The results from the environmental quality dimension analysis () also reveal two similar clusters to those of the global analysis: cluster 1 covering most of the country and cluster 2 based on the Metropolitan areas of Lisbon and Porto, and the exporting regions of the Setúbal peninsula and the Algarve. According to the classification results, 100% of original cases are correctly classified, which further confirms the robustness of the discriminant analysis performed.
Figure 6. Dendrogram analysis based on environmental quality variables.
Source: Authors’ elaboration.
The variables that contribute significantly to the distinction between clusters are urban waste collected per capita (RURH), municipal expenditure on management and environmental protection (DMGPA) and urban waste produced (RUPE) (see in Appendix A). The averages for these variables endorse the dissimilarities between clusters (). The F-statistic of ANOVA shows that the averages of the variables are not statistically equal () when concerning the proportion of population served by wastewater treatment (PPSETAR), agricultural area used (SAU) and burnt area (AA).
Table 9. Averages of discriminant analysis based on environmental quality variables.
Table 10. Tests of equality of group means based on environmental quality variables.
The differences between these clusters are related to characteristics associated with population density and the companies established in the territory, as well as to the main economic activities of each region. Cluster 2 includes the most densely populated cities in the country, Lisbon and Porto and those located in its surroundings (e.g., Lisbon, around 6450 inhabitants/km2; Porto, around 5740 inhabitants/km2; or Amadora, about 7360 inhabitants/km2), in contrast to the less densely populated towns at the other extreme such as Monforte with about 8 inhabitants/km2 or Mértola with about 4.8 inhabitants/km2, in 2019, included in cluster 1. Cluster 2 also includes the most industrialized areas of the country and the cities where the three international airports (Porto, Lisbon and Faro) are located. It is also in the areas included in cluster 2 that investments in tourism have greater impact and are felt with greater intensity, although this sector has been gaining prominence throughout the country. Therefore, it is natural that aspects such as urban waste collected per capita (RURH), municipal expenditure on management and environmental protection (DMGPA) and urban waste produced (RUPE) have had greater support and investment, namely concerning public policy, thus differentiating the two clusters.
DISCUSSION AND CONCLUSIONS
Territorial development is a multidimensional process reflected by the degree of access to a diverse set of opportunities that is offered continuously to the inhabitants of a territory, allowing personal and professional fulfilment and quality of life. Its complexity cannot be observed through the lens of a single indicator that conceals disparities and inequalities.
In this paper, a set of 26 indicators was used, from those comprising the Portuguese regional development composite index developed by Statistics Portugal (INE IP/DPP, Citation2009). This index helps to quantitatively characterize the level of development from a broad list of indicators grouped into the components of competitiveness, cohesion and environmental quality. In this study, taking into account the selected indicators and the analysis of how they are grouped (CA), the aim was to identify the differences in development between the various regions, and furthermore, to verify whether such differences between regions are significant (discriminant analysis). This holistic clustering approach allows the identification and aggregation of the NUTS-III regions according to similar economic, social and environmental issues.
Starting from a multivariate approach, homogeneous areas were identified. The results show that some inland and coastal regions intersect on their levels of economic, social and environmental development; in fact, the traditional distinction between coastal and inland regions – the former being young, urban, dynamic and economically vibrant, and the latter being ageing, rural, economically stagnant and depressed – decreases when a detailed approach (such as NUTS-III) based on different socioeconomic and environmental indicators is adopted.
CA, performed for all the dimensions – competitiveness, cohesion and environmental quality – reveals the existence of two regional groups in Portugal: the first covering the majority of Portuguese NUTS-III regions (cluster 1); and a second one (cluster 2) with four NUTS-III regions (Greater Porto, Greater Lisbon, Setúbal peninsula and Algarve) with intense levels of economic activity and export activity. The same results are attained when a CA is performed individually for the environmental quality dimensions. In a separate analysis of the competitiveness and cohesion dimensions, cluster 2 only includes the Metropolitan areas of Porto and Lisbon (NUTS-III Greater Porto and Greater Lisbon). All the other NUTS-III are included in cluster 1. LDA, with all domains, shows that the most important indicators distinguishing the groups (clusters) are those that mainly reflect the characteristics associated with urban agglomerations (gross domestic product per capita, population density, resident foreign population, youth index, accommodation and food companies, among others).
This paper reveals that while most of the country shows equivalent levels of territorial development, metropolitan areas and export-oriented regions are clearly distinguishable from the rest of the country. The indicators typically associated with economic agglomeration are those which reveal greater variances across the country.
The significant differences exhibited by metropolitan areas, especially the metropolitan area of Lisbon, are fundamental to understanding the differences between the levels of regional development in Portugal, which has not been firmly addressed by policy-makers.
Though metropolitan areas tend to have higher levels of development, this has not been considered as a key factor in the development of national public policies that soften the regional asymmetries. Medeiros (Citation2016) asserts that the structural policies have been focused on the development of metropolitan areas, thus increasing the disparity between regions instead of addressing them (Seixas, Citation2012). Reis (Citation2019) cautions that in the case of a scenario that severely affects the Lisbon region, the other Portuguese regions would not be able to accommodate and support the recovery. As stated by Seixas et al. (Citation2020), no national strategy has ever considered these differences in public policy decision-making.
This study confirms the existence of groups of regions with shared characteristics that go beyond the classic north–south or coastal–inland distinctions, identifying specific territories that provide different geographical visions that must be considered in territorial development policies and their implementation. This is in line with the idea that the best way to describe the differences of territorial development in Portugal is through the concept of ‘archipelagos’, as stated by Ferrão (Citation2002).
Furthermore, the differences between Portuguese regions are distinct depending on the perspective of analysis – considering the Portuguese regional development composite index or its domains separately. This gives an understanding of the key dimensions and variables where a greater effort is necessary for furthering progress towards a more cohesive territory, supporting more accurate decision-making processes through evidence-based information. Considering the characteristics of each place, public policies can improve their efficiency providing answers to specific questions instead of a general solution to a poorly defined problem.
The present holistic clustering approach is relevant because its results: (1) confirm that the territorial metaphor of ‘archipelagos’ is the best way to characterize development differences in Portugal; and (2) demonstrate that this ‘new geography’ should be considered to change the way in which policy is designed for the different regions. It goes beyond the current literature on regional index rankings, exploring how regions are similar, and can therefore be grouped. The knowledge obtained allows for the identification of groups of regions with common characteristics, upon which more adequate and efficient policies can be designed and applied.
The consolidation/improvement of interregional cohesion and the promotion of competitiveness, particularly in non-metropolitan regions, are the main challenges faced by Portugal. The EU’s structural policy, while developing mechanisms to consolidate the external competitiveness of metropolitan areas, should also raise the potential for economic growth in other regions by encouraging the use of endogenous resources with intensified innovation and a view to improving interregional convergence within the country and the EU context. Ramos and Marreiros (Citation2019) alert us to the fact that territory as a structural concept is lost or diluted in the transition from global to local. Medeiros (Citation2019), when analysing the current National Program for Spatial Planning Policy, states that it does not identify territories that should be privileged in the processes of territorial development; therefore, it does not present solutions for a more balanced territorial development of the country. In order to maximize the development potential, in particular of the less developed regions, differences between territories must be addressed, meaning that place-based approaches should ground territorial public policies.
A new perspective that fosters ‘place-based’ policies and reinforces the subsidiarity principle could be the key to mitigate the worsening of interregional differences. The concept of ‘place-based’ assumes that geographical context really matters for its social, cultural and institutional characteristics, focusing on knowledge in policy intervention by promoting interactions of enterprises, local groups and policy decision-makers (EU, Citation2019). As referred by Dias and Seixas (Citation2019), this means that ‘territorial development’ tends to replace expressions such as regional, local and even urban or rural. The authors affirm that this change reflects a new vision of development in which, on a territorial basis, tendencies impose themselves on the rationality of the redistributive mechanisms, sectorized and compartmentalized by scales, administrative levels or space categories.
Besides evaluating global development differences across the country, this study shows that the behaviour of NUTS-III is different when considering competitiveness, cohesion or environmental quality. The application of this methodology to other territorial contexts, in particular countries and regions that have received financial support from the EU’s regional policy, makes it possible to distinguish, in addition to the national convergence/divergence effects in relation to the EU average, the intra-regional differences considering the domains of the regional development composite index. Assuming that the fundamental condition for using this methodology is the existence of robust statistic data for different territorial scales (e.g., NUTS-III or municipalities), this approach can be used to explain regional development differences in several countries.
The results obtained, as well as the knowledge about the geographical levels of NUTS-I–III, demonstrate the importance of analysing differences in development at a NUTS-IV level (municipalities) in future research. This scale of analysis, where intra-territorial homogeneity should be greater, will allow a more detailed evaluation of the whole territory, providing solid information for place-based solutions and decision-making.
ACKNOWLEDGEMENTS
The authors gratefully acknowledge and express their gratitude to Nuno Gracinhas Guiomar from the Universidade de Évora (MED – Instituto Mediterrâneo para a Agricultura, Ambiente e Desenvolvimento) for his large contribution to the mapping. Additionally, the authors gratefully acknowledge the importance of the comments and suggestions from anonymous referees.
DISCLOSURE STATEMENT
No potential conflict of interest was reported by the authors.
Additional information
Funding
Notes
2 Portuguese territory, excluding the islands of the Azores and Madeira.
3 The results are available from the authors upon request.
4 The dimensions of cohesion and environmental quality present extremely small Kaiser-Meyer-Olkin; measure sampling adequacy, which means that the level of information that is lost with the extracted factors is very high.
REFERENCES
- Agresti, A. (1996). An introduction to categorical data analysis. Wiley.
- Alexandre, F., Costa, H., Portela, M., & Rodrigues, M. (2020). Asymmetric regional dynamics in the Portuguese economy: Debt, openness and local revenues. Regional Studies. https://doi.org/https://doi.org/10.1080/00343404.2020.1802004.
- Angelis, V., Angelis-Dimakis, A., & Dimaki, K. (2016). Identifying clusters of regions in the European south, based on their economic, social and environmental characteristics. Region, 3(2), 71–102. https://doi.org/https://doi.org/10.18335/region.v3i2.81
- APA – Agência Portuguesa do Ambiente. (2007). Sistema de Indicadores de Desenvolvimento Sustentável – SIDS PORTUGAL, Ministério do Ambiente, do Ordenamento do Território e do Desenvolvimento Regional, Lisbon.
- Beenstock, M., & Felsenstein, D. (2008). Regional heterogeneity, conditional convergence and regional inequality. Regional Studies, 42(4), 475–488. https://doi.org/https://doi.org/10.1080/00343400701291500
- CEC. (2005). Sustainable development indicators to monitor the implementation of the EU sustainable development strategy, SEC (2005) 161 final.
- Colletis-Wahl, K., & Pecqueur, B. (2001). Territories, development and specific resources: What analytical framework? Regional Studies, 35(5), 449–459. https://doi.org/https://doi.org/10.1080/713693825
- DGA – Direção Geral do Ambiente. (2000). Proposta para um Sistema de indicadores de Desenvolvimento Sustentável, DGA. Ministério do Ambiente e Ordenamento do Território.
- Dias, R. C., & Seixas, P. C. (2019). Territorialização de Políticas Públicas, Processo ou Abordagem? Revista Portuguesa de Estudos Regionais, 55, 47–60. https://www.researchgate.net/publication/341399118_Territorializacao_de_Politicas_Publicas_Processo_ou_Abordagem
- Diniz, F., & Sequeira, T. (2008). Uma possível hierarquização através de um índice de desenvolvimento económico e social dos Concelhos de Portugal Continental. INTERAÇÕES, Campo Grande, 9(1), 19–28. https://doi.org/https://doi.org/10.1590/S1518-70122008000100003
- European Union. (2019). Implementing a place-based approach ECON to EU industrial policy strategy. European Committee of the Regions. https://doi.org/https://doi.org/10.2863/713416
- Fernandes, J. A. R. (2019). PNPOT alterado: (mais) uma oportunidade para a valorização da Geografia no desenvolvimento do país. Public Policy Portuguese Journal, 4(2), 12–13. https://www.umpp.uevora.pt/publicacoes/Public-Policy-Portuguese-Journal
- Ferrão, J. (2002). Portugal, três geografias em recombinação: espacialidade, mapas cognitivos e identidades territoriais. Lusotopi, Éditions Karthala, 2, 151–158.
- Ferrão, J. (2013). Território. In J. L. Cardoso, P. Magalhães, & J. M. Pais (Org.), Portugal Social de A a Z. Temas em Aberto (pp. 244–257). Expresso.
- Figueiredo, A. (2005). A territorialização de Políticas Públicas em Portugal. IFDR.
- Folmer, H., & Heijman, W. (2005). Multi-dimensional regional inequality as an alternative allocation mechanism for EU structural funds remittances: The case of Spain and Hungary. The Annals of Regional Science, 39(2), 337–352. https://doi.org/https://doi.org/10.1007/s00168-004-0222-9
- Goletsis, Y., & Chletsos, M. (2011). Measurement of development and regional disparities in Greek periphery: A multivariate approach. Socio-Economic Planning Sciences, 45(4), 174–183. https://doi.org/https://doi.org/10.1016/j.seps.2011.06.002
- Hair, J. F. Jr., Black, W. C., Babin, B. J., & Anderson, R. E. (2014). Multivariate data analysis (7th ed.). Prentice Hall.
- Ianoş, I., Petrosor, A. I., Zamfir, D., Cercleux, A. L., Stoica, I. V., & Talanga, C. (2013). In research of a relevant index measuring territorial disparities in a transition country. Romania as a case study. Die Erde, 144(1), 69–81. https://doi.org/https://doi.org/10.12854/erde-144-5.
- INE. (2016). Índice Sintético de Desenvolvimento Regional, Lisboa. https://www.ine.pt/xportal/xmain?xpid=INE&xpgid=ine_destaques&DESTAQUESdest_boui=249963422&DESTAQUESmodo=2&xlang=pt
- INE. (2020). Índice Sintético de Desenvolvimento Regional, Lisboa. https://www.portugal2020.pt/content/indice-sintetico-de-desenvolvimento-regional
- INE/GET. (2015). Documento Metodológico – Índice Sintético de Desenvolvimento Regional v2.0. Instituto Nacional de Estatística.
- INE, IP/DPP. (2009). Índice Sintético de Desenvolvimento Regional. Eds.: Instituto Nacional de Estatística, IP and Departamento de Prospectiva e Planeamento e Relações Internacionais. Lisboa, Portugal.
- Keating, M. (2017). Contesting European regions. Regional Studies, 51(1), 9–18. https://doi.org/https://doi.org/10.1080/00343404.2016.1227777
- Kroll, C. (2015). Sustainable development goals: Are the rich countries ready? Bertelsmann Foundation.
- Mateus, A., & Associados, CIRIUS, GeoIdeia, & CEPREDE. (2005). Competitividade territorial e coesão económica e social, Colecção Estudos de Enquadramento Prospectivo do Quadro Comunitário de Apoio III. Observatório do QCA III.
- Mateus, A. (Coord.) (2015). Três Décadas de Portugal Europeu – Balanço e perspetivas. Fundação Francisco Manuel dos Santos.
- Medeiros, E. (2016). Territorial Cohesion: An EU concept. European Journal of Spatial Development, 60, 1–30. Stockholm. https://archive.nordregio.se/Global/EJSD/Refereed%20articles/refereed60.pdf
- Medeiros, E. (2019). O PNPOT 1.0 vs 2.0. Uma visão crítica da estratégia e modelo territorial. Public Policy Portuguese Journal, 4(2), 14–34. https://www.umpp.uevora.pt/publicacoes/Public-Policy-Portuguese-Journal
- Nicolai, S., Hoy, C., Berliner, T., & Thomas, A. (2015). Projecting progress: Reaching the SDGs by 2030. Overseas Development Institute.
- Pike, A., Rodriguez-Pose, A. S., & Tomaney, J. (2007). What kind of local and regional development and for whom? Regional Studies, 41(9), 1253–1269. https://doi.org/https://doi.org/10.1080/00343400701543355
- Pinto, H., & Guerreiro, J. (2010). Innovation, regional planning and latent dimensions: The case of the Algarve region. The Annals of Regional Science, 44(2), 315–329. https://doi.org/https://doi.org/10.1007/s00168-008-0264-5
- Ramos, A. S., & Marreiros, A. (2019). Quando fala o território? O papel do Programa Nacional da Política de Ordenamento do Território (PNPOT) na matriz territorial da programação regional dos Fundos – O caso da região do Algarve. Public Policy Portuguese Journal, 4(2), 89–115. https://www.umpp.uevora.pt/publicacoes/Public-Policy-Portuguese-Journal
- RCM. (2007). Estratégia Nacional para o Desenvolvimento Sustentável 2005–2015. Resolução do Conselho de Ministros 109/2007, 20 August, Lisbon.
- Reis, J. (2015). Ensaios de Economia Impura. Livraria Almedina.
- Reis, J. (2019). Recuperar o país inteiro: Discutir a regionalização em busca do tempo perdido. In J. Fernandes, L. Carvalho, P. Chamusca, T. Mendes, M. Pacheco, A. Rei, I. Rocha, H. Santos, & A. Silva (Org.). Livro de artigos IV Conferência em Políticas Públicas, Planeamento e Desenvolvimento Territorial – Descentralização & Desenvolvimento, 1–5. Ermesinde, 11–12 April.
- SDSN. (2015). Indicators and a monitoring framework for sustainable development goals: Launching a data revolution for the SDGs. Sustainable Development Solutions Network.
- Seixas, P. C. (2012). Políticas e modelos de desenvolvimento territorial na Europa e em Portugal. Revista Paranaense de Desenvolvimento, 122, 147–175. Curitiba.
- Seixas, P. C., Oliveira, A., & Dias, R. C. (2020). Regional paroxysms in Portugal: Top-down or bottom-up development? Revista Brasileira de Gestão e Desenvolvimento Regional, G&DR, 16(1), 58–71.
- Silva, R., & Ferreira-Lopes, A. (2014). A regional development index for Portugal. Social Indicators Research, 118(3), 1055–1085. https://doi.org/https://doi.org/10.1007/s11205-013-0455-z
- Simão, A. M. (2013). Percurso Profissional no Instituto Nacional de Estatística. Destaque para a divulgação de indicadores de desenvolvimento sustentável, Tese de Mestrado em Economia, especialização em Economia Regional e Desenvolvimento Local. Universidade de Évora.
- Soares, J. O., Marques, M. M. L., & Monteiro, C. M. F. (2003). A multivariate methodology to uncover regional disparities: A contribution to improve European Union and governmental decisions. European Journal of Operational Research, 145(1), 121–135. https://doi.org/https://doi.org/10.1016/S0377-2217(02)00146-7
- Turok, I., Bailey, D., Clark, J., Du, J., Fratesi, U., Fritsch, M., Harrison, J., Kemeny, T., Kogler, D., Lagendijk, A., Mickiewicz, T., Miguelez, E., Usai, S., & Wishlade, F. (2017). Global reversal, regional revival? Regional Studies, 51(1), 1–8. https://doi.org/https://doi.org/10.1080/00343404.2016.1255720
- UMVI – Unidade de Missão para a Valorização do Interior. (2016). Programa Nacional para a Coesão Territorial, Lisboa. http://www.portugal.gov.pt/pt/o-governo/pnct/pnct.aspx
- UN CSD. (1996). Indicators of sustainable development framework and methodologies, No.E.96.II.A.16. United Nations Sales Publ.
- UN CSD. (2001). Indicators of sustainable development: Guidelines and methodologies (2nd ed.). No.E.01.II.A.6. UN Sales Publ.
- UN CSD. (2007). Indicators of sustainable development: Guidelines and methodologies (3rd ed.). United Nations.
APPENDIX A
Table A1. Cluster membership.
Table A2. Standardized canonical discriminant function coefficients.
Table A3. Standardized canonical discriminant function coefficients based on competitiveness variables.
Table A4. Standardized canonical discriminant function coefficients based on cohesion variables.
Table A5. Standardized canonical discriminant function coefficients based on environmental variables.