
 ?Mathematical formulae have been encoded as MathML and are displayed in this HTML version using MathJax in order to improve their display. Uncheck the box to turn MathJax off. This feature requires Javascript. Click on a formula to zoom.
ABSTRACT
This paper empirically tests the Kuznets hypothesis that structural transformation – the movement of labour from low productivity to higher productivity sectors – is associated with rising inequality in a developing economy. We assemble a unique data set of inequality and sectoral employment shares of almost 300 districts of Indonesia and sector-specific measures of inequality for the period 1992–2017. Unlike studies that use value added shares to test the Kuznets hypothesis, this paper is among a few that directly test it with sectoral employment shares. We find that structural change and rising inequality coevolve in different ways depending on the modality of structural transformation. Specifically, we find in the Indonesian case that structural transformation has a tendency to be associated with falling inequality during a period of industrialization and increasing inequality during a period of tertiarization.
INTRODUCTION
The seminal work of Kuznets (Citation1955) on inequality and economic development is often misrepresented in the sense that it is reduced to the inverted-‘U’ curve. Kuznets hypothesized that income inequality would rise – an upswing – during industrialization as labour moves from the rural to the urban ‘sector’. This is only the case, as Kuznets noted, if the rural sector is more equal than the urban sector. If labour moves from a more equal sector to a less equal sector, the overall effect is likely to be unequalizing. Although dismissed as a universal law, rising inequality in some fast-growing developing countries has renewed interest in distributional dynamics during economic development. At the same time, many middle-income developing countries are experiencing either a stalling of industrialization in terms of plateauing manufacturing employment shares, or an outright deindustrialization of manufacturing employment shares and a tertiarization of employment.
In light of the above, the contribution of this paper is to directly test the Kuznets hypothesis in a developing economy, using Indonesian district-level data set, spanning a 25-year period (1992–2017). This data set is arguably unique in at least two counts. First, for Indonesia, this is the first data set of employment share by economic sectors covering districts (finer than provinces) and spanning from the 1990s toward the end of the 2000s. Second, it encompasses the period before and after significant multidimensional structural breaks in Indonesia during the Asian Financial Crisis (AFC) in 1997–99, involving major shifts in Indonesia’s political institutions and economic development.
The sectoral employment share is important in the context of Kuznets theory because labour movement across sectors is at the centre of his theory. Yet, most of literature tested Kuznets’ theory using the share of value-added data, which for the global scale only recently available with 10 sectors, such as reported in the Groningen Growth and Development Centre (GGDC) database (https://www.rug.nl/ggdc). Among the few that use employment share data to test Kuznets are Angeles (Citation2010) and Baymul and Sen (Citation2020).
The objectives of our paper are two-fold. First, to understand how structural transformation – the movement of labour from low productivity to higher productivity sectors – is associated with inequality in a developing economy with Indonesia as a case, by directly test the Kuznets hypothesis using district-level sectoral employment shares data. Second, to understand how the structural transformation – inequality nexus differs during different types of labour movement; specifically, the industrialization of employment and during a period of stalling industrialization and tertiarization of employment. In doing so, we estimate – in keeping with Kuznets’ seminal work – the contribution of changes in between- and within-sector inequality to overall inequality, and the ‘turning point’ for the Kuznets downswing. To our knowledge, this is the first attempt to study such a relationship in a developing economy using district-level data spanning over a quarter of a century.
We use a nationally representative household socioeconomic survey (a repeated cross-section) data set of expenditure to construct inequality of expenditure (income is not available in the data) and sectoral employment shares in 290 districts of Indonesia covering the period 1992–2017. This includes sector-specific measures of consumption inequality that are decomposable. In constructing this data set, we maintain consistency of districts over time by re-merging districts split during Indonesia’s post AFC decentralization process (from 2000 onward). We thus create a consistent panel data set of almost 300 districts spanning 25 years, with 7275 district-year observations. To our knowledge, these data for Indonesia are the first of their kind and enable us to directly test (the relationship between inequality and changing sectoral share of employment) the Kuznets hypothesis. We also aim to provide this data set open for other researchers to use to study more about the relationship between inequality and sectoral share of employment.
We find that structural change and rising inequality coevolve in different ways depending on the modality of structural transformation. Specifically, we find in the Indonesian case that structural transformation has a tendency to be associated with falling inequality during a period of industrialization (1992–97) and increasing inequality during a period of tertiarization period (2001–17). Looking forward, it is likely inequality in Indonesia will continue to rise in the foreseeable future as labour moves to urban, tertiary sectors. This calls for strong policy interventions to soften the possible adverse impact of rising inequality.
The remainder of the paper is structured as follows. The next section revisits the seminal Kuznets paper and those writing in a Kuznetsian tradition. The third section discusses the country context in terms of inequality and structural transformation. The fourth section describes the methodology, specifically the empirical strategy and data set construction. The fifth section discusses the results. The sixth section concludes.
LITERATURE REVIEW
Kuznets (Citation1955), working with a two-sector model, argued that the labour transition from the ‘rural’ (i.e., agriculture) to the ‘urban’ (i.e., manufacturing) sector would be accompanied by rising inequality in the early stages of economic development because the initial benefits of growth go to those with capital and education, and as more people move out of the rural sector, real wages rise in the urban sector and inequality falls overall. Kuznets made use of time-series data for the United States, the UK and two German states, and point estimates for India, Puerto Rico and Ceylon for his ‘upswing’ in inequality, using ‘urban’ and ‘rural’ as ‘sectors’. His ‘downswing’ was based on an abstract arithmetical model and driven by politics (though this is often missed in interpretations of Kuznets which reduce his seminal paper to the inverted-‘U’ curve).
A vast number of empirical works have been devoted to testing Kuznets’ hypothesis, typically with income per capita rather than sectoral employment shares. Many earlier studies supported the theory (e.g., but not limited to, Ahluwalia, Citation1976; Paukert, Citation1973) as did many later studies (e.g., Barro, Citation2000; Chang & Ram, Citation2000; Jha, Citation1996; Mbaku, Citation1997; Thornton, Citation2001). At the same time, other empirical studies have rejected the theory as a universal phenomenon (whilst accepting that the relationship could be evident in specific countries) (e.g., Anand & Kanbur, Citation1993; Cook & Uchida, Citation2008; Deininger & Squire, Citation1998; Desbordes & Verardi, Citation2012; Frazer, Citation2006).
The Kuznets hypothesis is about movements between ‘sectors’ and structural transformation is where labour moves from a more equal (and less productive) sector such as the rural or agriculture sector to a more unequal sector (and more productive) such as urban or non-agriculture. However, countries may have differing economic structures even at the same level of per capita income. And some countries experience an employment transition from agriculture to a manufacturing economy (i.e., industrialization) whilst other countries may experience an employment transition from agriculture to services. Further, stalled industrialization and deindustrialization are also evident alongside tertiarization (Rodrik, Citation2016). To the best of our knowledge, only a few papers attempt to test the Kuznets hypothesis directly by considering how structural change (i.e., a labour move from agriculture to non-agriculture) is associated with inequality. These include Angeles (Citation2010) and Baymul and Sen (Citation2020).
Angeles (Citation2010) takes 4000 observations of the Gini coefficient from the UNU-WIDER World Income Inequality Database (WIID) (v. 2.0), covering most countries and five decades, and tests the effect of a change in non-agricultural employment shares on income/consumption inequality with panel data analysis (the percentage of labour employed in non-agriculture and the share of the urban population). He finds mixed results: support for Kuznets is dependent on country groupings; and country-by-country analysis does not support the Kuznets hypothesis.
More recently, Baymul and Sen (Citation2020) used the GGDC 10-Sector database and identified different types of countries as follows: structurally under-developed (agriculture is the largest employment share in the most recent period), structurally developing (employment shares in services > agriculture > manufacturing), and structurally developed (employment shares in manufacturing > agriculture). Baymul and Sen used the Standardized UNU-WIDER WIID. They found that structural transformation in many poorer countries has been from agriculture to services, rather than from agriculture to manufacturing. They found, in contrast to Kuznets, that in the countries that have had a labour transition toward manufacturing, it has been income-equalizing, irrespective of the type of country. They also found that the movement of workers into services has no discernible overall impact on inequality, but increased inequality in structurally developing countries and decreased inequality in structurally developed countries.
It is worth revisiting precisely what Kuznets said about this. Kuznets (Citation1955, Citation1973) made use of a dual-economy model (closed) and outlined that income inequality in a dual-sector economy is an aggregation of (1) inequality in each sector; (2) the mean income of each sector; and (3) the population shares in each sector. Thus, even the population shift itself could lead to rising inequality as Kuznets himself noted. Furthermore, although inequality may rise as a result of movement between sectors, that occurrence may be balanced or outweighed by what happens to the within-sector components. The shares of each sector and initial inequality between and within sectors will also play an important role.
As described by Anand and Kanbur (Citation1993), the Kuznets process can be represented by decomposing between-sector (or group) inequality and within-sector (or group) inequality, each of which contributes to overall inequality. As illustrated in , suppose we define inequality (I) to be the overall measure of inequality in a given country and x to be the share of labour in the non-agricultural sector. Assume that there is only one non-agricultural sector and the working population is normalized to 1. We can then define between-sector inequality as the inequality in the income distribution when a fraction x of the population receives income µ1 and the remaining fraction, 1 – x, receives income µ1. Between-sector inequality is defined as the value of the index of inequality when everyone in the sector receives the mean income of that sector.
Figure 1. The Kuznets process.
Source: Anand and Kanbur (Citation1993).
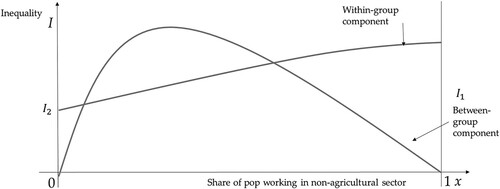
Kuznets assumed that the mean income of the non-agricultural sector is higher than that of the agricultural sector, or µ1 > µ2. At both x = 0 and 1, inequality must be 0. When 0 < x < 1, inequality will first increase with increasing x, then decrease as x increases. This is because when x is low, there is more labour in agriculture than in non-agriculture, so that between-sector inequality is high. However, when more and more workers are in non-agriculture, between-sector inequality starts falling. It continues falling until it reaches 0 when all workers are in the non-agriculture sector. How within-group inequality (the difference between overall inequality and between-group inequality) changes with the increase in x depends on the assumptions about which sector is more unequal than the other. If we assume that within-group inequality in the non-agricultural sector is higher than in the agricultural sector, then the within-group inequality component of overall inequality will increase as x increases.
What is often not highlighted in discussions of Kuznets is that he was clear that public policy has the potential to counterbalance any increase in inequality. The Kuznets downswing of inequality was based on a data simulation and a belief that two forces would increase gross inequality; specifically, the concentration of savings in the upper-income group and the transfer of labour to urban/manufacturing, which was assumed to be a less equal sector than the rural/agriculture sector. Kuznets argued that as more people move out of the rural sector, real wages rise in the urban sector and inequality falls. The poorest lost out more rapidly than other groups as income-expanding opportunities increased outside of agriculture, and the only way to offset this was for the share of lower income groups in non-agriculture to rise. He further contended that in democracies, urban migrants would become politically organized, leading to redistribution.
More recently, in a similar vein, Acemoglu and Robinson (Citation2002) argue that when the process of industrialization does increase inequality, this leads to the political mobilization of the masses who are concentrated in urban areas and factories. Political elites thus undertake reform to ensure their continued position at the top. The extension of the franchise is the best option for elites as it acts as a commitment to future redistribution and thus prevents unrest.
A further level of complexity is added when the assumption of a closed economy is removed. Kuznets in his seminal piece said little about open economies and how an open economy would impact his theory of distributional dynamics. There has been a set of contemporary scholars building new theory in the Kuznetsian tradition, many of whom have focused on the impact of economic openness. Such scholars have developed theory with a focus on open economies and agrarian liberalization, the role of technology, as well as aspects of national political economy and the distribution of land. Galbraith (Citation2011), for example, argues that it is global forces – interest rates and commodity prices – that have driven the changes in national inequality since 1970. This is because a commodity boom reduces inequality in countries with a dominant agricultural sector as it raises the relative income of farmers, and higher rates of interest are bad for debtor countries and increase inequality. In a somewhat similar vein, at least in the sense of a focus on open economies, Lindert and Williamson (Citation2001) argue that it is the shift toward market orientation (domestic to export) of agriculture which causes inequality to rise. They predict an initial rise in inequality because income in the urban sector outpaces rises in income in the rural sector as agriculture shifts to market orientation. Oyvat (Citation2016) also argues that it is agrarian structures – national land inequality – that are deterministic. Consistent with Kuznets, he argues that migration is driven by higher urban incomes and this suppresses wages in the urban sector. If land inequality is higher, more people will migrate for lower wages as they do not own land or own small plots, and rural incomes are lower which will further depress urban wages. In contrast, Roine and Waldenström (Citation2014) argue that technology makes skilled workers more productive and there is an increase in the relative demand for those workers; the rewards accrue to a small proportion of the population who are skilled workers.
Although Kuznets said little on the open-economy dynamics, there has been a set of contemporary scholars building new theory in the Kuznetsian tradition, many of whom have focused on such issues.
Contemporary scholars have developed theory with a focus on the impact of the global economy via commodity prices, interest rates and agrarian liberalization; as well as aspects of national political economy and the distribution of land. Galbraith (Citation2011), for example, argues that it is global forces – commodity prices and interest rates – that have driven the changes in national inequality since 1970. He reasons that a commodity boom reduces inequality in countries with a dominant agricultural sector because it raises the relative income of farmers, while higher interest rates are bad for debtor countries and thus increase inequality.
In a somewhat similar vein, at least in the sense of a focus on open economies, Lindert and Williamson (Citation2001) argue that it is the shift towards market orientation (from domestic to export) of agriculture that causes inequality to rise. They predict an initial rise in inequality after liberalization because income in the urban sector outpaces rises in income in the rural sector as agriculture shifts to market orientation.
Oyvat (Citation2016) also argues that it is agrarian drivers – national land-ownership patterns – that are deterministic. Consistent with Lewis and Kuznets, he argues that migration is driven by higher urban incomes and this suppresses wages in the urban sector. If land inequality is higher, more people will migrate for lower wages as they do not own land or own small plots, and rural incomes are lower which will further depress urban wages.
Finally, Acemoglu and Robinson (Citation2002) argue – consistent with Kuznets – that when the process of industrialization does increase inequality, this leads to political mobilization of the masses that are concentrated in urban areas and factories. Political elites thus undertake reform to ensure their continued position at the top of society. The extension of the franchise is the best option for elites as it acts as a commitment to future redistribution and thus prevents unrest.
Structural transformation and inequality in Indonesia
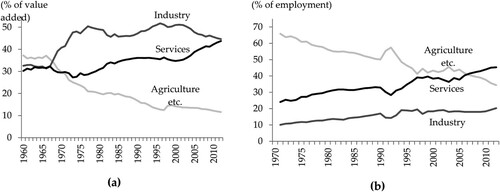
Indonesia makes an interesting case study to examine the Kuznetsian hypothesis in a developing economy context because it has recorded various episodes of labour movement out of the agriculture sector in past 25 years. Indonesia experienced a period of rapid industrialization in the 1990s, which was then followed by a severe economic crisis (1997–99), prompted by the Asian Financial Crisis (AFC). Since the AFC, industrialization has stalled and a notable tertiarization of employment has occurred (). At the same time inequality remains a development concern. The precise cause(s) of inequality in Indonesia in the past 25 years is/are not well established in the literature. Various contenders have been suggested (for a review, see Yusuf et al., Citation2014), one of which is structural change that is unequalizing.
Figure 2. (a) Percentage of agriculture, industry and services in value added; and (b) percentage of employment in agriculture, industry and services in Indonesia.
Source: Groningen Growth and Development Centre (GGDC) 10-Sector database.
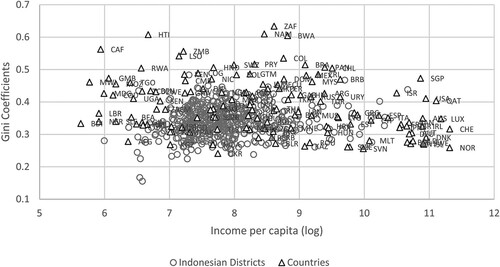
Another reason why the case of Indonesia is interesting, given our district-level data set, is that the cross-sectional variation of Indonesia’s development is substantial. shows the scatter plot of the relationship in 2015 between (log) gross domestic product (GDP)/capita and the Gini coefficient at district level in Indonesia, superimposed on a similar plot using the global data set of countries. shows that the income and inequality of the Indonesian districts represent a good range of the cross-country data. The regional diversity in Indonesia means that some regions within Indonesia share structural characteristics such as the dominance of agriculture and/or mining with poorer, low-income countries, whilst other parts of Indonesia share characteristics with better-off, upper-middle-income developing countries, where the dominance of manufacturing and/or services is evident. Indonesian districts also represent a broad range of characteristics, from rural districts (such as most districts in the island of Papua) to metropolitan districts (such as districts/cities in most of Java, including in the Special Economic Region of Jakarta, the Indonesian capital), where income per capita is comparable with some Western European countries.
Figure 3. Income per capita and inequality of Indonesian district versus countries, 2015.
Sources: Authors’ estimates, UNU-WIDER, World Income Inequality Database (WIID3.4) and World Bank (Citation2019).
Using within-countries cross-subnational data also offer another advantage. Unlike cross-country data, subnational inequality data of one country are directly comparable since they share exactly the same estimation method, and most importantly a result of the same legal, educational and political institutions (Nielsen & Alderson, Citation1997). This reduces the need for extensive control variables in the empirical analysis. In these regards, results from our Indonesian district-level data may add to the body of existing literatures using the global (cross-country) data.
METHODOLOGY
Empirical analysis strategy
Between- and within-sector Atkinson inequality decomposition
As explained previously, at the centre of Kuznets theory is how inequality changes as an economy’s sectoral share of employment change and how overall inequality is affected by the difference of inequality between and within sectors. To see whether this actually happen in Indonesia, we need an indicator of inequality that can be used to check this. To do this we make use of the Atkinson index of inequality because of its decomposability into between and within inequality. We look at the evolution of inequality over the period 1992–2017. The Atkinson index of inequality is as proposed by Atkinson (Citation1970). To calculate the inequality index,Footnote1 define a population of household i = 1, 2, … , N with income . Atkinson defines
, the equally distributed-equivalent income, which can be calculated from the data as:
(1)
(1) The Atkinson index is then defined as:
(2)
(2) where
is the arithmetic mean of
; and ϵ is a parameter for the degree of inequality aversion. The well-known property of the Atkinson index of inequality is that it is decomposable by between- and within-group components. Therefore, we can estimate the contribution of within- and between-group inequality to overall inequality. The Atkinson index can be decomposed into within-group inequality
and between-group inequality
, where:
(3)
(3)
(4)
(4) where k = 1, … , K is the subgroup k of the population;
is the number of the population in group K; and
is the equally distributed-equivalent income of group k. A decomposition analysis will be used to estimate the contribution of within- and between-sector inequality to overall inequality, and also how the proportion of each contribution changes over time.
Econometric analysis
To formally estimate the impact of structural transformation on consumption inequality at the district level in Indonesia during the sample period, we use a fixed-effect panel data regression with time- and district-specific dummies. This approach is appropriate for the task in hand because it is simple and tractable, yet capable of neatly summarizing the statistical relationships in the data. The empirical model to be estimated can be written as follows:
(5)
(5) where i and t represent district i in year t; and j represents the sectors of the economy; while INEQ denotes the expenditure per capita inequality in district i in year t.
The main focus of the estimation is the sectoral labour share denoted in SLAB, which represents the labour share in specific sectors, to control for the effect of structural change due to labour movement, on the level of consumption inequality in Indonesia. We also add the squared term of the sectoral labour share to control for the Kuznets ‘U’-shaped hypothesis in the model. Additionally, the dummy variables YR9297 and YR9800 are included to represent the period of the AFC, where YR9297 = 1 if the period is between 1992 and 1997 (pre-AFC) and YR9800 = 1 if the period is between 1998 and 2000 (during the AFC). Otherwise, both YR9297 and YR9800 are set equal to 0. The pre-AFC period corresponds to the period of rapid industrialization, whereas the post-AFC control for the period of stalling industrialization/rapid tertiarization.
As discussed in the previous section, we also focus on the interaction between the AFC dummy and the main independent variables to control for how the AFC may affect the structural labour composition, which then impacts on inequality in Indonesia. Furthermore, to keep the consistency of the results, Xit operates as a vector of control variables that consists of years of schooling, the rate of urbanization, population size and access to basic services, that is, electricity coverage, piped water coverage and good sanitation coverage. The basic service represents how government expenditure may affect the level of inequality in the districts. Finally, as we employ the fixed-effect method, the district fixed effects are used to control for districts’ constant characteristics, while the time effect is included in the model to control for the common trends across areas in the given year. The fixed effect may indeed control important factors that may play an important role in how inequality in Indonesia vary across districts such as geography (e.g., being in the island of Java, the growth centre of the development in Indonesia, or being in the resource-rich regions), yet these are not actually the main objectives of this paper. Not controlling for these unobserved factors may lead to biased estimate of the parameters. It should be noted, however, that this does not control for time-varying (non-constant) district heterogeneity, and possible endogeneity of the regressors.
Panel data fixed-effects may control for unobserved time-invariant districts heterogeneity but no address the possible endogeneity of the regressors. In this particular specification, variable of interest, the sectoral employment share may be endogenous. To fully take into account this issue, we need to use instrumental variable fixed effect regression. The challenges, however, is to find the best variable and data for instrumenting the sectoral employment. This is a challenge. We acknowledge this limitation and leave this issue to be addressed for future research.
A new panel data set of district-level inequality and sectoral employment shares
We construct, for the purpose of this paper, a new data set of inequality and sectoral employment shares at district level. Districts are the second layer of subnational government below Indonesia’s 34 provinces. Indonesia currently has 590 districts. The consistent SUSENAS (the Socio-Economic Survey) data – a large-scale nationally representative household survey undertaken annuallyFootnote2 – is available for a 25-year period from 1992 to 2017. Although there are many studies on Indonesia using provincial data, very few use district-level data and none to the authors’ knowledge spans a quarter of a century.
One issue that is necessary to address is the changes in Indonesian districts over time and particularly after the decentralization process started after the AFC. In 1992, Indonesia had 290 districts. As noted above, this doubled by 2018 to 591. We make use of 25 years of the SUSENAS data to follow how districts split over time from 1992 to 2017. We construct the data set by moving backward from 2017 and re-merging all districts into their original districts of 1992. Thus, we create a consistent data set of 290 districts spanning 25 years, and 7275 district-year observations. We use the historical data of district proliferation using crosswalk collected by the World Bank. To the best of our knowledge, there has never been any attempt to assemble this data set for Indonesia in the context of studying inequality and structural transformation.
For the purpose of this paper, we calculated for each year and for each district the following variables: (1) expenditure per capita inequality (Gini coefficient) and other inequality measures that will be used for robustness checks;Footnote3 (2) mean per capita expenditure; (3) sectoral employment shares for six sectors as follows: (i) the agriculture sector; (ii) non-manufacturing industry; (iii) manufacturing industry; (iv) market services – 1 (which comprise trade and transport); (v) market services – 2 which comprise all types of financial services; and (vi) non-market services, including government administration, education and other services; (4) mean years of schooling; (5) the urbanization rate; (6) the total population; and (7) access to public goods: electricity coverage, piped water coverage and improved sanitation coverage.
We use the newly constructed data set to study the relationship between sectoral employment changes and consumption inequality during the three different periods that involved structural change, allowing for the direct test of the Kuznets hypothesis. The periods are (1) the pre-AFC period (1992–97), which corresponds to the period of rapid industrialization; (2) the AFC through until the end of crisis and stabilization (1998–2000); and (3) post-AFC (2001–17), which corresponds to the period of stalling industrialization/rapid tertiarization. In each period, we focus on the relationship between the employment share of the non-agricultural sectors and consumption inequality.
Our data are from the SUSENAS, the national socioeconomic survey, which control for households’ consumption expenditure. The use of consumption rather than the gross domestic regional product (GDRP)-based inequality measurement allows us to gain a better picture of inequality amongst residents at district level. GDRP is production based and relies on a production-based survey. It is problematic to measure the welfare of the residents of districts using GDRP because factor ownership is not necessarily within the same jurisdiction, in the same way as GDP and gross national product (GNP) are distinguished. At a district level, such a problem with GDRP will be more noticeable because profits or capital spillovers are likely to be more pronounced cross-district than cross-country.
EMPIRICAL FINDINGS AND DISCUSSION
Between- and within-sector inequality decomposition
A consideration of inequality within different economic sectors and how inequality within sectors evolves over the course of structural transformation is important in understanding how structural change and inequality coevolve. This process is at the heart of the classical Kuznetsian theory of structural transformation. Kuznets hypothesized that inequality rises in the early stages of structural transformation because labour moves from a relatively equal sector (e.g., agriculture) to relatively less equal sectors (e.g., manufacturing), and as a consequence of this process overall inequality will rise. We analyse this in the Indonesian case using our district-level data. We measure consumption inequality within and between economic sectors using the distribution of expenditure per person within each sector and the sector of employment of the head of the household.
shows the density curve for the six main economic sectors using the start and end observations of the data set, 1992 and 2017, respectively. We observe the following. The distribution of consumption per capita in all other sectors changed quite markedlyFootnote4 between 1992 and 2017, during which within-sector inequality increased significantly, in particular in agriculture and non-market services.
Figure 4. Density curve of consumption per capita by sector of the economy.
Note: The horizontal axis is the log of expenditure per capita per month: (a) agriculture; (b) non-manufacturing industry; (c) manufacturing; (d) trade and transportation; (e) finance; and (f) non-market services.
Source: Authors’ estimates.
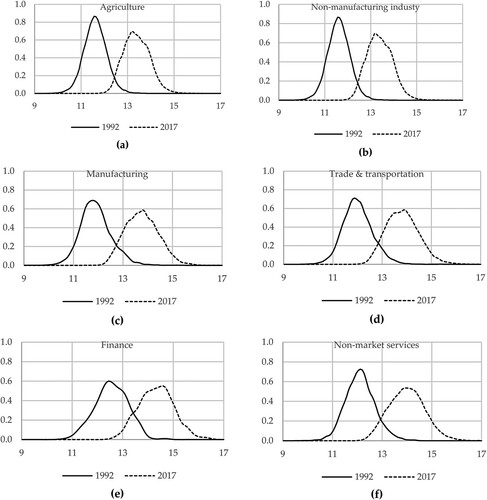
In 1992, the first year of our data set, agriculture is the sector with the lowest inequality (Gini coefficient = 0.27), followed by non-manufacturing industry (0.37) and the manufacturing sector (0.37). As labour moved from agriculture (a relatively more equal sector) to non-agriculture (a relatively less equal sector) in Indonesia during the period 1992–2017, we would expect overall inequality to rise. Indeed, during the period 1992–2017, overall inequality did rise. However, before the AFC (rapid industrialization period) as labour moved from agriculture to non-agriculture, inequality did not rise. It is in the post-AFC period (stalling industrialization/rapid tertiarization period) that the movement of labour is associated with overall inequality rising.
In 2017, we also find that agriculture has the lowest mean real expenditure per person, and finance has the highest mean real expenditure per person. The manufacturing sector mean real expenditure per person is in between the mean real expenditure per person in agriculture and finance. The economic sector with the highest inequality is finance (Gini coefficient = 0.40) followed by non-manufacturing industry (0.39), while agriculture has the lowest inequality (0.32) and the manufacturing sector has the second lowest inequality (0.38). In fact, we find that the skewness of the distribution increases in all sectors between 1992 and 2017. Compared with 1992, we observed a higher degree of inequality in all sectors and including in agriculture and non-market services ().
The decomposition of inequality by economic sector using the Atkinson index of inequality additionally helps to explain what happened to inequality within the context of structural transformation. shows a ‘heat map’ of the Atkinson index of inequality (with alpha parameters 0 and 1) for each of the relevant sectors, whereby the white colour represents the lowest inequality and black colour represent the highest inequality. The Atkinson index of inequality is decomposable by within- and between-group components; thus, we can look closer to the evolution of these components.
Figure 5. Atkinson index of inequality in various sectors, and within- and between-sector components, 1992–2017.
Note: (a) Atkinson index with ϵ = 0; and (b) Atkinson index with ϵ = 1.
Source: Authors’ estimates.
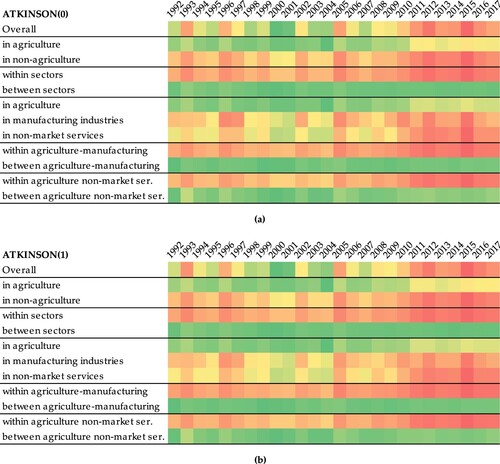
From , one can observe the following. First, inequality in Indonesia started rising during the decade of the 2000s during the stalling industrialization/rapid tertiarization period, in particular during the mid-2000s. This confirms earlier findings using more standard inequality measures such as the Gini coefficient (Yusuf et al., Citation2014). The Atkinson(1) index shows Indonesian consumption inequality increased by 33.5% from 1992 to 2017. However, there are two discernible periods: during the rapid industrialization period (1992–97), when consumption inequality actually declined by 9.0%, and the stalling industrialization/rapid tertiarization period (2001–17), when consumption inequality increased by 56.1%.
Second, the largest contributor to rising inequality in Indonesia overall is the change in inequality within sector, and certainly not inequality between sectors. In the period from 2001 to 2017, the Atkinson(1) index for Indonesia overall increased by 28%, and 98% of the increase is due to the increase in the within-sector component of inequality.
Third, looking at the overall period (1992–2017), the rise in inequality within sector in the manufacturing sector is small compared with non-agriculture sectors. Inequality within the manufacturing sector during this period rose by just 5.3% (using the Atkinson(1) index), while non-market services, by contrast, increased by 41.2%. Inequality within manufacturing rose quite significantly during the stalling industrialization/rapid tertiarization period (2001–17) at 43%, though this is lower than the inequality rise within agriculture at 56.1% or non-market services at 63.8%.
In sum, in the process of structural transformation in Indonesia during the sample period, labour has moved from agriculture to non-agriculture sectors. Yet, there are two distinct periods that mark the transformation. During the rapid industrialization period (1992–97), there was substantial labour movement to industry, specifically to manufacturing industry. During the stalling industrialization period/rapid tertiarization period (2000–17), the share of the labour in manufacturing has been steady and more labour has moved to the services sectors. We find that structural transformation during the rapid industrialization period is not accompanied by overall rising inequality, yet the structural transformation during the stalling industrialization/rapid tertiarization period is. In short, the Kuznets hypothesis connecting income inequality and structural change holds in the later period but not in the former. Further, rising inequality is evident in all sectors of the economy, including the sector that much labour moved from: agriculture. Moreover, we find that the rate of increase in inequality within the agriculture sector is much faster than within non-agriculture. The Kuznets hypothesis does not explicitly predict this. When we disentangle the non-agriculture sector, we find that there are certain subsectors within the services sectors where labour from the agriculture sector moves to, for example, non-market services, which experience a dramatic fall in inequality in the earlier period (1992–97), but a dramatic rise in the later period by almost 64%. Finally, within-sector inequality is the largest contributor to rising inequality in Indonesia after the AFC.
Econometrics analysis
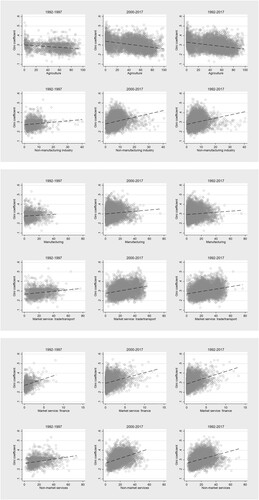
shows scatter plot diagrams of the association between sectoral employment share and Gini coefficient across different years in Indonesia. It suggests that, in general, inequality across district-years is non-declining as the sectoral employment share increases, with the exception of agriculture. The non-declining inequality applies not only to all sectors but also to all periods in Indonesian economic development for the last 25 years. also shows clearly that the slope of the fitted line is notably higher, in general, for the period of stalling-industrialization/tertiarization (2000–17) relative to the period of rapid industrialization (1992–97), and especially so in finance and non-market services.
Figure 6. Relationship between sectoral employment share and inequality, 1992–97, 2000–17 and 1992–2017.
Source: Authors’ estimates.
Next, we show the fixed-effect panel regression results. We show two sets of regression results. The first in is the regression without additional control variables. The second regression is presented in and has additional control variables. In the set of results without additional controls, we only control for district fixed effects, and year effects (trend). The regression without additional controls, in general, confirms our casual observations from the scatter plot diagrams in , that is, the increase in the employment share of all five non-agricultural sectors is associated with increasing inequality for the period of stalling-industrialization/rapid tertiarization (2000–17). The association is statistically significant with at least a 5% level. For each of the five non-agricultural sectors, the relationship statistically exhibits an inverted-‘U’ shape as shown, with a statistically significant coefficient for the quadratic term of the labour share variables.
Table 1. Regression results with Gini indicator as a dependent variable, without control variables.
Table 2. Regression results with Gini indicator as dependent variable, with control variables.
We also find that in the regressions without additional controls, the interaction terms of labour share with the pre-AFC or rapid industrialization period (1992–97) all, with the exception of finance, are negative and statistically significant (at 5% level). In short, we confirm our initial observation from the scatter plot diagrams, that the effect of an increasing sectoral employment share is lower during the pre-AFC/rapid industrialization period than the post-AFC/stalling-industrialization/rapid tertiarization period. Moreover, since the coefficient of the interaction term is larger for some sectors such as manufacturing in the pre-AFC period (1992–97), we find that an increasing share of employment in manufacturing industry is associated with declining inequality – in contrast to the post-AFC period where the opposite is the case.
contains robustness checks of the results by adding additional control variables, that is, district mean of expenditure per capita (the proxy of the effect of economic growth on inequality), district mean years of schooling, the rate of urbanization, the size of population and various indicators of access to basic services.
The results show that in only three out of the five non-agriculture sectors, the relationship between sectoral labour share and inequality that we found, as discussed above, is robust to the inclusion of additional controls. The sectors are manufacturing industry, finance and non-market services. We find similar findings for the period 2001–17; that is, that the increase in the sectoral labour share of manufacturing, finance and non-market services is associated with an increase in inequality (with at least a 5% level of significance). We again find that the square term of the labour share is negative and statistically significant, suggesting an inverted-‘U’ relationship. We note that the strongest association observed is that between the sectoral labour share of finance and inequality, followed by non-market services.
We find that the interaction term between the labour share and rapid industrialization/pre-AFC period is only statistically significant in manufacturing and non-market services, but not statistically significant (at 5% level) in finance. The result for the finance sector suggests that the positive association between the labour share in finance and inequality, or the tension between structural transformation and inequality, is similar between both periods. However, the relationship between the labour share in non-market services and inequality during the pre-AFC period is lower than post-AFC/rapid-tertiarization. Looking at the coefficient, we can say that the relationship during the pre-AFC is 30% weaker than post-AFC but still positive, i.e., an increasing employment share is associated with increasing inequality. The reverse relationship in manufacturing found in (without additional controls) is robust after adding additional control variables.
summarizes the result of the regression (based on ) and shows the turning point of labour shares in each sector using only statistically significant coefficients. We also checked the results of the regressions using various different inequality measures and with slight variations in structural breaks for robustness checks. Our results are robust to variation in model specifications. We find that most of the turning points of the labour share are considerably above the current district means and only a few districts have labour shares above the turning points. This signifies that the tension between structural transformation and inequality in Indonesia is likely to remain a challenge in the short and medium term. In addition, if the Indonesian economy continues to experience a process of tertiarization, inequality in Indonesia is likely to continue to rise.
Table 3. Regression results with Gini indicator as dependent variable, without control variables.
DISCUSSION
Back to the original questions of this paper: Does structural transformation is associated with inequality in Indonesia? Our findings using district level data suggest that the answer is affirmative in Indonesia though with different outcomes for inequality depending on the modality of structural transformation. Specifically, we find in the Indonesian case that structural transformation has a tendency to be associated with falling inequality during a period of industrialization and increasing inequality during a period of tertiarization period. Our findings formalized the more stylized province level study in Indonesia using SUSENAS data reported in Yusuf et al. (Citation2014) who showed that structural transformation in post AFC Indonesia is marked by a pronounced rise in inequality which is more or less common across regional dimensions, urban and rural areas.
There are several possible mechanisms that may explain a differential impact of structural transformation on inequality before and after the AFC.Footnote5 First is related to the increasing capital utilization during the period of economic recovery combined with changing industrial relations following Indonesian political reforms. In 1998, Indonesian economic growth collapsed to around 13.2%. Manufacturing sector capacity utilization suddenly drop from around 70% before the AFC to less than 50% in 1999 (Yusuf et al., Citation2013, p. 12). Statistics for manufacturing industry from 1999 suggest that the capacity utilization rate slowly returns toward the pre-AFC level. In 2005, for example, the capacity utilization is still around 60%. Therefore, during the 2000s, manufacturing sectors grew on the basis of the utilization of capital without proportionate increase in employment. This was made possible by the second possible explanation. In Indonesia, the economic crisis in 1998 has triggered political reforms that give more power to labour union that used to be suppressed by the Soeharto regime (Manning & Pratomo, Citation2013). Labour has a lot more bargaining power in the reform era. As Yusuf et al. (Citation2013, p. 13) observe, real wage growth after the AFC is higher than the real wage before the AFC. Therefore, these may explain why structural transformation after the AFC tend to be associated with increasing inequality.
Second explanation is related to the large macroeconomic adjustment during the AFC and how it may have impacted the sectoral resource allocation. For Indonesia, the AFC involves a combination of currency and banking crisis. The former was signified by a major depreciation of the rupiah (Rp)/US dollar exchange rate. The rupiah lost almost 80% of its value against the US dollar during the period from August 1997 until the height of the currency crisis in mid-1998. Such large depreciation in the nominal exchange rate discouraged import and encouraged export. The banking crisis, moreover, led to the drying up of lending flows to domestic private non-financial corporations. Loans to the private sector by domestic banks contracted, adding to the liquidity crunch, as capital stopped flowing to Indonesia.
The above two forces combined may have led to a shift of economic resources in the immediate aftermath and for a few years after the AFC, away from the manufacturing sector towards the natural resource sectors, particularly the quick-yielding raw commodity exporting sector. This shift may have slowed labour absorption in urban manufacturing sector, leaving the low value-added tertiary sector as the sector that does the job of absorbing labour migration from rural agriculture sector.
A somewhat related story is China’s entry to the World Trade Organization (WTO) since 2001 and its impact on global trade. World export and trade in value added expanded significantly with the rising contribution of China. Concomitant to this is the boom in commodity prices. Indonesia commodity export sectors may have been affected positively following this period of export and commodity price boom, adding to the slower labour absorption by the manufacturing sector after the AFC.
Another possible explanation is the long-term dynamic in the labour market. Rodrik (Citation2016) proposes that technology might explain stalling industrialization and rising tertiarization in the developing world. Maloney and Molina (Citation2016) find the incipient impact of technological change (automation) and trade in tasks on polarization in the labour markets in the developing economies. Accordingly, technological change may also be a factor in explaining the dynamics of labour demand, and hence inequality in developing economies.
But more importantly, the results above serve as the Indonesian case for the global narrative on the possible tension between structural transformation and equality in the developing economies, as has been put forward by Sumner (Citation2016, Citation2017, Citation2019). Moreover, a very recent cross-country study involving 32 economies with at least four decades of annual aggregated data until 2012, as conducted in Baymul and Sen (Citation2020), has shown empirically that (1) movement of workers away from agriculture is unambiguously related to an increase in inequality, yet (2) they do not see a Kuznets-type relationship between manufacturing employment share and inequality when the different paths of industrialization are taken into account, and in fact (3) the increasing share of workers in the manufacturing sector tends to decrease inequality in Africa and Asia. Using Indonesian cross-district panel data between 1992 and 2017, our empirical results in this paper provide additional nuances to the global results reported by Baymul and Sen (Citation2020).
The aforementioned development tension in post-AFC Indonesia is felt mostly within rather than between sectors, as shown by the results discussed in the fifth section. This gives further insight into the presence of the developer’s dilemma in Indonesia, as policy measures to promote growth through structural transformation may also tend to increase inequality – discounting the net gain in political capital that might be accrued from economic reforms. In other words, the development trade-off tends to revolve around the political economy of income distribution within sector, rather than between sectors.
The key findings discussed above naturally lead to at least two policy relevant questions for policymakers, which warrant further study beyond the scope of this paper. What might be the sources of the pronounced within-sector inequality in manufacturing and financial services sectors, the two key and complementary sectors that are growth promoting? What can one do about the rising overall inequality in the short run so as to minimize the potential loss of political capital before the U-turn?
CONCLUSIONS
Kuznets argued that the labour transition from rural/agriculture to urban/manufacturing sectors would be accompanied by rising inequality in the early stages of development. Many empirical works have been devoted to testing the Kuznets hypothesis. That said, to the best of our knowledge, only a handful of studies attempt to directly test the Kuznets theory by looking at sectoral change and whether employment shares are associated with inequality changes. Most studies focus on the relationship between income per capita and inequality.
This paper attempts to contribute to the literature by first analysing how inequality by sector of economy has evolved over the last 25 years in Indonesia; second, by estimating the between- and within-sector contributions of inequality to overall inequality; and third, exploring how structural transformation is associated with inequality, a more direct test of the Kuznets hypothesis.
We construct a unique data set of inequality and sectoral employment shares of 290 districts of Indonesia, as well as sector-specific measures of (between- and within-sector decomposable) consumption inequality, covering the period 1992–2017.
We find, first, that during the period of rising inequality, that is, the period of stalling industrialization/rapid tertiarization (2000–17), inequality increased in all sectors, including agriculture, industry and services. We note that agriculture, the sector with the least initial inequality, experienced a faster increase in inequality relative to non-agriculture. Second, inequality within sectors is more important than inequality between sectors in its contribution to overall inequality. Third, in general, the relationship between the sectoral employment share and inequality in Indonesia varies between different periods. We observe a tension between structural change and inequality during the period of stalling industrialization/rapid-tertiarization after the AFC (2000–17).
This study has several limitations. First, the fixed-effect regression analysis does not establish full causality. Second, the exact causes of why the relationship between structural transformation and inequality is so different between pre- and post-AFC is not empirically analysed or tested. Third, testing the Kuznets hypothesis using district-level data within one country may help isolate multi-country heterogeneity of institutions, culture or endowments. Yet, within-country factor mobility ideally should also be taken into account. Inequality in one district may have a spillover effect to their surrounding districts, for example. One way of incorporating this is by applying regression with spatial effects. We leave these caveats for further research.
DATA AVAILABILITY STATEMENT
The data that support the findings of this study are available from Arief Anshory Yusuf upon request.
DISCLOSURE STATEMENT
No potential conflict of interest was reported by the authors.
Correction Statement
This article has been republished with minor changes. These changes do not impact the academic content of the article.
Notes
1 This formulation of the Atkinson index is based on the explanation in the STATA software manual, of which its routine ineqdeco is used to practically implement the decomposition written by Jenkins (Citation1999). The ineqdeco command from STATA is used to perform the decomposition.
2 Unlike other popular household surveys such as Indonesian Family Life Survey (IFLS), SUSENAS coverage is nationwide. The IFLS, for example, only represents 87% of the population because it only surveys 13 out of 34 provinces. The SUSENAS covers the whole population; the survey is used by the Indonesian government; and its sample size is considered enough to calculate the official poverty incidence and Gini coefficient at province and district levels. For the example, see https://jabar.bps.go.id/statictable/2016/10/13/122/persentase-penduduk-miskin-menurut-kabupaten-kota-di-jawa-barat-persen-2002-2016.html, where the National Statistics Office reports the poverty incidence of each district in West Java provinces.
3 The other measures of inequality are the Atkinson index, Mehran index, coefficient of variation, general entropy GE-1, Kakwani index, mean log deviation, Piesch index, relative mean deviation, standard deviation of logs and Theil entropy index. For regression results using these various measures, see Tables A1–A9 in the supplemental data online. The expenditure is adjusted with national-level consumers price index (CPI).
4 The change in the distribution of expenditure in the finance sector is the least pronounced.
5 This naturally led to the need for further study beyond the scope of this paper.
REFERENCES
- Acemoglu, D., & Robinson, J. A. (2002). The political economy of the Kuznets curve. Review of Development Economics, 6(2), 183–203. https://doi.org/https://doi.org/10.1111/1467-9361.00149
- Ahluwalia, M. S. (1976). Income distribution and development: Some stylized facts. The American Economic Review, 66(2), 128–135. https://www.jstor.org/stable/1817209?seq=1
- Anand, S., & Kanbur, S. M. R. (1993). The Kuznets process and the inequality—development relationship. Journal of Development Economics, 40(1), 25–52. https://doi.org/https://doi.org/10.1016/0304-3878(93)90103-t
- Angeles, L. (2010). An alternative test of Kuznets’ hypothesis. The Journal of Economic Inequality, 8(4), 463–473. https://doi.org/https://doi.org/10.1007/s10888-009-9117-4
- Atkinson, A. B. (1970). On the measurement of inequality. Journal of Economic Theory, 2(3), 244–263. https://doi.org/https://doi.org/10.1016/0022-0531(70)9003
- Barro, R. J. (2000). Inequality and growth in a panel of countries. Journal of Economic Growth, 5(1), 5–32. https://doi.org/https://doi.org/10.1023/A:1009850119329
- Baymul, C., & Sen, K. (2020). Was Kuznets right? New evidence on the relationship between structural transformation and inequality. The Journal of Development Studies, 56, 1643–1662. https://doi.org/https://doi.org/10.1080/00220388.2019.1702161
- Chang, J. Y., & Ram, R. (2000). Level of development, rate of economic growth, and income inequality. Economic Development and Cultural Change, 48(4), 787–799. https://doi.org/https://doi.org/10.1086/452477
- Cook, P., & Uchida, Y. (2008). Structural change, competition and income distribution. The Quarterly Review of Economics and Finance, 48(2), 274–286. https://doi.org/https://doi.org/10.1016/j.qref.2006.12.017
- Deininger, K., & Squire, L. (1998). New ways of looking at old issues: Inequality and growth. Journal of Development Economics, 57(2), 259–287. https://doi.org/https://doi.org/10.1016/s0304-3878(98)00099-6
- Desbordes, R., & Verardi, V. (2012). Refitting the Kuznets curve. Economics Letters, 116(2), 258–261. https://doi.org/https://doi.org/10.1016/j.econlet.2012.03.010
- Frazer, G. (2006). Inequality and development across and within countries. World Development, 34(9), 1459–1481. https://doi.org/https://doi.org/10.1016/j.worlddev.2005.12.006
- Galbraith, J. K. (2011). Inequality and economic and political change: A comparative perspective. Cambridge Journal of Regions, Economy and Society, 4(1), 13–27. https://doi.org/https://doi.org/10.1093/cjres/rsq014
- Jha, S. K. (1996). The Kuznets curve: A reassessment. World Development, 24(4), 773–780. https://doi.org/https://doi.org/10.1016/0305-750x(95)00165-9
- Kuznets, S. (1955). Economic growth and income inequality. The American Economic Review, 45(1), 1–28. https://www.jstor.org/stable/1811581?seq=1
- Kuznets, S. (1973). Modern economic growth: Findings and reflections. The American Economic Review, 63(3), 247–258.
- Lindert, P. H., & Williamson, J. G. (2001). Does globalization make the world more unequal? (National Bureau of Economic Research (NBER) Working Paper 8228). NBER. https://doi.org/https://doi.org/10.3386/w8228
- Maloney, W. F., & Molina, C. (2016). Are automation and trade polarizing developing country labor markets, too? (World Bank Policy Research Working Paper 7922).
- Manning, C., & Pratomo, D. S. (2013). Do migrants get stuck in the informal sector? Findings from a household survey in four Indonesian cities. Bulletin of Indonesian Economic Studies, 49(2), 167–192. https://doi.org/https://doi.org/10.1080/00074918.2013.772940
- Mbaku, J. M. (1997). Inequality in income distribution and economic development: Evidence using alternative measures of development. Journal of Economic Development, 22(2), 57–67.
- Nielsen, F., & Alderson, A. S. (1997). The Kuznets curve and the great U-turn: Income inequality in U.S. Counties, 1970 to 1990. American Sociological Review, 62(1), 12–33. https://doi.org/https://doi.org/10.2307/2657450
- Oyvat, C. (2016). Agrarian structures, urbanization, and inequality. World Development, 83, 207–230. https://doi.org/https://doi.org/10.1016/j.worlddev.2016.01.019
- Paukert, F. (1973). Income distribution at different levels of development: A survey of evidence. International Labor Review, 108, 97.
- Rodrik, D. (2016). Premature deindustrialization. Journal of Economic Growth, 21(1), 1–33. https://doi.org/https://doi.org/10.1007/s10887-015-9122-3
- Roine, J., & Waldenström, D. (2014). Long-run trends in the distribution of income and wealth (IZA (Institute for the Study of Labor) Discussion Paper No. 8157). IZA.
- Jenkins, S. P. (1999). INEQDECO: Stata module to calculate inequality indices with decomposition by subgroup. Statistical Software Components S366002, Boston College Department of Economics, revised 15 Feb 2021.
- Sumner, A. (2016). Global poverty: Deprivation, distribution and development. Oxford University Press.
- Sumner, A. (2017). The developer’s Dilemma: The inequality dynamics of structural transformation and inclusive growth (ESRC GPID Research Network Working Paper 1).
- Sumner, A. P. (2019). Global poverty and inequality: Change and continuity in late development. Development and Change, 50(2), 410–425. https://doi.org/https://doi.org/10.1111/dech.12487
- Thornton, J. (2001). The Kuznets inverted-U hypothesis: Panel data evidence from 96 countries. Applied Economics Letters, 8(1), 15–16. https://doi.org/https://doi.org/10.1080/135048501750041213
- World Bank, J. (2019). GDP per capita (current US$), World Development Indicators. The World Bank. Group.Retrived January 31, 2019, from https://data.worldbank.org/indicator/NY.GDP.PCAP.CD
- Yusuf, A. A., Komarulzaman, A., Purnagunawan, M., & Resosudarmo, B. P. (2013). Growth, poverty and labor market rigidity in Indonesia: A general equilibrium investigation (Working Papers in Economics and Development Studies (WoPEDS) 201304). Department of Economics, Padjadjaran University, Retrieved January 2013, from https://ideas.repec.org/p/unp/wpaper/201304.html.
- Yusuf, A. A., Sumner, A., & Rum, I. (2014). Twenty years of expenditure inequality in Indonesia, 1993–2013. Bulletin of Indonesian Economic Studies, 50(2), 243–254. https://doi.org/https://doi.org/10.1080/00074918.2014.939937