
ABSTRACT
Based on a collection of daily Search Index data of symptom-, prevention- and recovery-related terms in Baidu, this study visualizes the spatial patterns of public responses towards the COVID-19 outbreak during the response and coexisting response and recovery phases. We find that provincial capitals and cities in China’s Pearl River Delta and Yangtze River Delta regions show a relatively high level of public responses in both phases. Furthermore, cities with similar past experiences show a high level of public responses in the response phase, suggesting that enhancing urban resilience is associated with the learning-by-doing process.
User-generated content with spatial reference information on the Internet has become a valuable source of real-time information for understanding the spatial patterns of public responses during adverse events. A better understanding these responses is fundamental for emergency management and is therefore a key step towards increasing urban resilience (Wang et al., Citation2020).
This graphic uses Internet search data to visualize public responses towards the COVID-19 outbreak across all Chinese prefectural-level-and-above citiesFootnote1 during the period from 20 January 2020, when human-to-human transmission was officially confirmed, to 31 March 2020, when China announced a basic success in the blockage of transmission. Nine most relevant terms were chosen based on media reports on pandemics. Specifically, 病毒性肺炎 (virus pneumonia), 发热 (fever) and 咳嗽 (cough) were selected as symptom-related terms. Prevention-related terms include 口罩 (mask), 洗手 (wash hands) and 消毒 (disinfection). 开学 (return to school), 复工 (return to work) and 复产 (restore production) were selected as recovery-related terms. The daily Search Index of symptom- and prevention-related terms in Baidu (‘the Chinese Google’) were combined as a proxy measure of public awareness of COVID-19 and as a way of mitigating risk during the response (from 21 January to 2 February 2020), while that of symptom-, prevention- and recovery-related terms were combined as a measure of public engagement with a ‘return to normal’ during the response and recovery phase when COVID-19 was firmly established in social consciousness. The date 3 February is the end of the Chinese Spring Festival, after which time the orderly resuming of a more normal level of social and economic activity together with epidemic prevention and control has become a national concern.
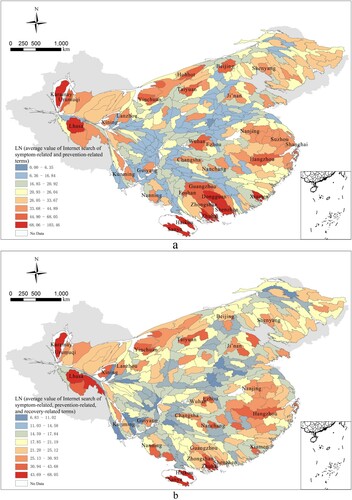
shows the cartograms of the nationwide public response to the pandemic during the two phases. In each cartogram, the area of a city is proportional to the logarithm of the average value of the Internet search of the abovementioned terms per Internet user in each phase. Overall, provincial capitals and cities in China’s Pearl River Delta and Yangtze River Delta regions show relatively higher levels of public responses. Although cities in Hubei province have been the worst hit during the pandemic, only Wuhan and Ezhou show a high level of public response to the pandemic. This finding confirms that people’s responses towards an adverse event may not necessarily relate to the severity of the incident (Wang et al., Citation2020), making formulating more pertinent and effective strategies/actions in emergency management contexts difficult. Note that cities in Guangdong province, which was at the centre of the SARS epidemic in 2003, show a comparatively higher level of public responses towards the COVID-19 outbreak in the response phase, suggesting that past experience serves as a reminder of the importance of personal prevention measures (Lau et al., Citation2020).
Figure 1. Public responses towards the COVID-19 outbreak during the (a) responses and (b) coexisting response and recovery phases.
ACKNOWLEDGEMENT
The data used in this paper were collected by the team led by Professor Liang Zhou of Lanzhou Jiaotong University.
DISCLOSURE STATEMENT
No potential conflict of interest was reported by the authors.
Additional information
Funding
Notes
1 According to China’s administrative structure, cities are classified as provincial level, prefectural level (dijishi), county level and town level.
REFERENCES
- Lau, L., Smari, G., Moresky, R., Casey, S. E., Kachur, S. P., Roberts, L. F., & Zard, M. (2020). COVID-19 in humanitarian settings and lessons learned from past epidemics. Nature Medicine, 26(5), 647–648. https://doi.org/https://doi.org/10.1038/s41591-020-0851-2
- Wang, B., Loo, B. P. Y., Zhen, F., & Xi, G. (2020). Urban resilience from the lens of social media data: Responses to urban flooding in Nanjing, China. Cities, 106, 102884. https://doi.org/https://doi.org/10.1016/j.cities.2020.102884