
 ?Mathematical formulae have been encoded as MathML and are displayed in this HTML version using MathJax in order to improve their display. Uncheck the box to turn MathJax off. This feature requires Javascript. Click on a formula to zoom.
ABSTRACT
The COVID-19 pandemic has had an unprecedented impact on both national economies and everyday life. Massive lockdowns and a shift towards digital technologies forced people to adapt to technological innovations in their daily routines in a new online format. In this study we identify patterns of change in the population’s adoption of and receptiveness to digitalization. The focus is on registering the expansion of digital routines influenced by the coronavirus depending on the place of residence, infrastructure and demographics. The results of a population survey held in August 2020 across all municipalities of the Kaliningrad region of Russia suggest that the magnitude of the pandemic’s effect in accelerating digitalization is different for various population types. Most receptive to digital innovations are residents of economically developed municipalities aged 26–40 with higher education having a stable Internet connection at a fair price. The article presents a typology of municipalities on the adoption of and receptiveness to innovation. It is shown that without the established infrastructure, technological, economic, cultural and behavioural basis, the acceleration of digitalization does not occur.
INNOVATION
The COVID-19 pandemic has affected all countries around the globe, calling for specific measures at national and global levels. Due to lockdowns introduced worldwide (with minor exceptions, such as some Scandinavian countries and Baltic states at the initial stage), the ‘new normal’ is taking shape in the economy, society, politics and even the natural environment (Akpan et al., Citation2020; Hesse & Rafferty, Citation2020; Sharifi & Khavarian-Garmsir, Citation2020). The need to minimize social contacts and interpersonal communication is challenging the established business processes and the daily routines of the population. Many companies got out of business, while others had to switch to digital, placing an ever-increasing focus on information and communication technologies (ICT) – consulting and sales are done remotely, distant education has become the only choice, public catering had to intergrade online food ordering systems and collaborate heavily with delivery services, shops have focused on online marketplaces and largely invested in online services (e.g., dressing rooms), public services have become more flexible and digitalized (Kraus et al., Citation2020; Priyono et al., Citation2020; Fletcher & Griffiths, Citation2020; Papadopoulos et al., Citation2020).
It seems that the coronavirus pandemic has forced the rapid introduction of digital innovations in nearly all spheres of life. As noted by Richter (Citation2020), it would be hardly possible to realize this massive digital switch 10 years ago, whereas the strategic vector on digitalization has long been proposed in numerous international reports of the United Nations (UN), the Organization for Economic Co-operation and Development (OECD), the World Bank, the World Economic Forum (WEF) and other institutions. They have all urged countries to deploy strategies of digital transformation as the digital economy (also known as platform, gig or sharing economy) and the advanced (or ‘propulsive’; Kuznetsov et al., Citation2019) industries of 4.0 are projected to act as the driver of growth in the 21st century, but these reports could hardly affect the adaption of digital innovations by individual businesses and the general public.
Despite the COVID-19 pandemic being one of the strongest external shocks of modern times, said to trigger the innovation adaptation speed and public receptiveness to innovation, scholars point to the strong digital divide between and within countries and regions (Archibugi et al., Citation2013). As noted by Gilbert and Masucci (Citation2020, p. 3654), the ‘digital divide both reflects and contributes to increasing economic and social marginalization between places and people at multiple scales from the global to the local’. As further elaborated by Švarc et al. (Citation2020, p. 2), ‘digitalization contributes towards economic growth, increases in productivity and employment’. At the same time, the ‘digital inequality reflects the technological, economic, social, educational disparity of economic entities’ (Artemenko et al., Citation2020, p. 187). There are numerous indications of interrelationships between socio-economic inequality and the digital divide, which is defined as ‘differences in access to ICTs and the associated information flows between places and/or people’ (Gilbert & Masucci, Citation2020, p. 3654). Therefore, the patterns in receptiveness to innovation also indicate a strong correlation with the level of economic development, the quality of infrastructure and the welfare of the population (Cruz-Jesus et al., Citation2017; DiMaggio et al., Citation2004).
Studies suggest that the gap in adopting digital innovations is increasing within the European Union (Cruz-Jesus et al., Citation2017) as digitally developed countries are increasing their use of ICT at a higher rate. The difference in the spread of digital technologies is equally strong at a national level. Brown et al. (Citation2020) observed a strong divergence between internet activity across cities in the United States. The data as of 2018 suggest that in 221 large and medium-sized cities at least 30% of households had no broadband Internet connection, while in 92 cities one in five households had no Internet connection of any type. Regional level studies across Russia also suggest a strong divergence that remains between regions. For example, Kravchenko et al. (Citation2020) summarized that economically developed metropolitan areas have a distinct long-term advantage in ICT investment and adoption. The data suggest that the top 15 advanced regions represent 60% of ICT employees and almost 80% of total ICT expenditure, including 33% and 60%, respectively, accumulated in just four areas: the cities of Moscow, St Petersburg, Tyumen and the Moscow region. The gap between leading and lagging regions in using e-government by the population is seven-fold, and a three-fold gap is in the adoption of digital technologies by businesses. The digital divide within regions is even higher, featuring 95% of the population having broadband Internet access in cities and under 20% in rural areas.
With that taking the perspective of the digital divide, it is a much too simplified perspective of categorizing population into users and non-users – strong variations in online activity have to be considered: available access type, motivation, equipment requirements (e.g., Internet access, speed, etc.), and personal skills required (Eichhorn et al., Citation2020). Furthermore, the efficient integration of digital innovations first of all implies that the general public is ready to accept this change and switch their daily routines to the digital domain. Kuc-Czarnecka (Citation2020) highlights that the rapid and forced transition towards the online world is not smooth, often reducing the quality of life, the availability of services and even the risk of being ‘left out’ due to a lack of skills or technical capabilities. Studies on the adoption of innovations, widely available in the literature on the diffusion of innovation (DOI), generally understand it as the process of an innovation being communicated over time among the members of a social system (Rogers, Citation2003). With regard to the speed of digital innovations adoption by an individual, Jahanmir and Cavadas (Citation2018) review a variety of determinants that affect an individual’s receptiveness to innovation, such as the attitude toward technology, negative word of mouth about the technology, global brand image, consumer innovativeness and lead-user profile. Numerous other findings on the technology acceptance model (TAM), the technology readiness index, and the technology adoption propensity (TAP) index suggest that perceived usability and the level of trust are among the key factors that encourage or indeed inhibit one from adopting new technology, including e-government and other services of the ‘daily routine’ – public utility, shopping, etc. (Pal & Vanijja, Citation2020; Pérez-Morote et al., Citation2020; Guner & Acarturk, Citation2020).
The focus of our study is the impact of the COVID-19 pandemic on the process of introducing digital technologies into everyday life. We test whether the population’s receptiveness to innovations, primarily those related to the Internet, has increased in the new conditions determined by the pandemic. In our study we critically examine the thesis that the pandemic has acted as a universal driver for innovation, and we consider this phenomenon using the example of the ICT sector within the boundaries of one geographical region. The Kaliningrad region of Russia, an exclave region geographically and institutionally isolated from the rest of the country, was chosen as the territory and testing ground for the study. This is an ideal case for obtaining a clear picture of the impact of the pandemic on digitalization and the digital innovation receptiveness of the population. First, the region is compact enough to study both in terms of territory and population, enabling us to conduct sociological surveys across all its municipalities. Second, the region is neither a leader nor an outsider in terms of the level of internet usage among other regions of the country. According to the Federal State Statistics Service of the Russian Federation (Rosstat, Citation2020), 85.5% of the population in the Kaliningrad region use the Internet, which is 2.9% above the national average. The annual growth rates in the share of population using the Internet were above the national average over the past decade, partially facilitated by a broad Internet coverage of the territory (over 80%) and competitive subscription fees (505.9 versus 563.7 roubles countrywide). Third, despite the relatively high values for Internet usage, the population of the Kaliningrad region is still wary of going online. This is indirectly confirmed by the lower share of the population using e-government services −47.7% versus 56.5%, and online shopping −33.5% versus 35.7% (Rosstat, Citation2020).
RESEARCH METHODOLOGY
The object of the study is the daily routines andeveryday actions in human life transferred to the virtual space. Among digital routines, we have highlighted: online shopping; online payment for housing and public utilities; payment for mobiles and the Internet; the use of online marketplaces such as Avito, Yula, etc. for the search, purchase, sale and exchange of goods and services; social networking; making an online appointment for the post office, doctor and government agencies; receiving public services online at the Gosuslugi.ru e-government portal; job search via the Internet; and viewing or reading the news.
The subject of the study was spatial and social (gender, age, education, etc.) differences in the attitude of the population to digital routines in the context of the COVID-19 pandemic. Online shopping was chosen as the primary marker for the increasing adoption of innovation by the population in the context of digitalization. We proceeded from the fact that, on the one hand, going to the store is a routine process in the lives of most people, and, on the other, the fact of buying online indicates the key basic attributes of digitalization and a certain level of receptiveness to innovation: digital culture, including knowledge and skills in using digital technologies and secure online surfing; the availability of information and communication infrastructure and a stabile Internet connection; technological advancement associated both with the presence of special devices for participation in digital processes (computers, mobile phones, tablets, etc. with the Internet) and specialized software and technologies (e.g., mobile banking app, etc.).
We emphasize that the focus of the study is the introduction of digital technologies in households, and not in the economy sectors. Thus, we aimed not at the challenges of digital transformation for companies, but at the willingness and interest of end users to use digital services and/or products to improve the efficiency of traditional daily routines. In general, ICTs currently play a decisive role in the development of innovations. Considering innovation as a complex process, result and a way of thinking (Kahn, Citation2018), we present digital technologies not only as an outcome of innovation and the process of digital optimization (reconfiguration) of management and communication processes, but also as a new digital culture and ‘smart’ lifestyle. In our research, we proceed from the fact that it is not enough to develop and implement digital technologies in all spheres of human life, it is also important to ensure their relevance among the general public and the readiness of the population to go digital.
The main research method was a questionnaire survey of the population. The questionnaire included a set of closed-ended questions, identical for all respondents, with answer options and the ability to give an alternative answer. During the study, respondents were asked the following questions about their digital routines:
Do you shop online?
Did you increase the frequency of your online shopping during the lockdown?
Do you pay for public utilities, the Internet and other services online?
Do you use any online marketplace to buy and/or sell goods, services, including personal belongings?
Do you have a profile on any of the social networks?
What is your main source of news in the region, country, the world?
What is the most frequent option you use to receive public services?
Do you use specialized websites to search for job vacancies?
Respondents were also asked seven questions about their opinion of expanding the set of digital routines by introducing (1) a single digital ID card that would replace a number of other documents, such as a national passport, an insurance number and a taxpayer identification number; (2) a unified digital medical record with data from medical examinations, test results, doctors’ appointments, prescriptions, etc.; (3) an online system of elections at all levels; (4) an electronic state document management with all public documents to be issued only in digital format; (5) an electronic tax system with online tax reporting system; (6) a distance education; and (7) a legal mechanism for remote work (i.e., home office).
The geography of the study covered all 22 urban districts of the Kaliningrad region. The widely applied formula of Anton (Citation1996, p. 89) was used to calculate the sample of respondents required for obtaining representative results with a 95% confidence interval:
where N is the total population; and 1.96 is the confidence coefficient (Z-score).
The population of the region as of 1 January 2020 was just over 1 million people, and its distribution between the regional centre of Kaliningrad and other municipalities is almost equal (48% and 52%). Therefore, two samples were formed: an independent one for Kaliningrad, and an aggregate one for other urban districts, taking into account the percentage ratio between municipalities relative to the resident population. A total of 876 residents were interviewed, including 385 from Kaliningrad. presents the geographical scope of the study.
Figure 1. Territorial distribution of respondents by urban districts of the Kaliningrad region of Russia.
Source: Developed by the authors.
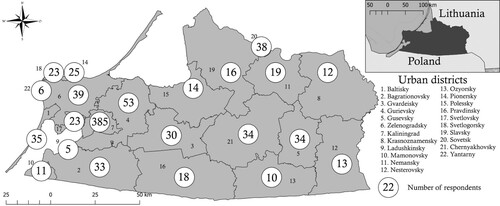
The sampling of respondents was carried out randomly without special screening for any external attributes. The survey was carried out in August 2020 after the ‘self-isolation regime’ (i.e., lockdown) in the Kaliningrad region was cancelled, which was in effect from 31 March to early May 2020. Although certain restrictions are still in effect as of 6 December 2020. This made it possible to identify the already established preferences of the population in the use of digital technologies. The main channel for obtaining information was personal communication. Additionally, about 20% of the questionnaires were collected in digital format by posting information and links to a Google form with a survey in specialized publics on online social networks (municipal groups in social networks).
Data processing was carried out in aggregated form with sorting filters in the context of municipalities; population groups by age (18–25, 26–40, 41–55, 56–70 and over 71 years of age), gender (female, male) and education (secondary, secondary vocational, higher and postgraduate); the level of satisfaction with the perceived quality and the price of the Internet connection used. shows the distribution for these attributes: by gender; by the perceived quality and price of the Internet connection; by age; and by education.
Figure 2. Distribution of sample respondents by attributes.
Source: Developed by the authors.
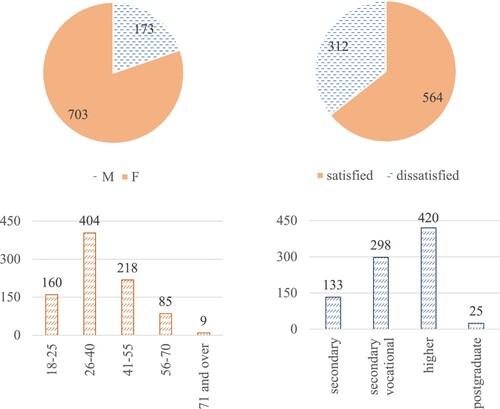
We should note some imbalance in demographics of the respondents with a slight shift towards certain groups by gender, age and the level of education ().
First, this is due actual distribution of the resident population of the Kaliningrad region as of early 2020 in the considered age categories (Rosstat, https://kaliningrad.gks.ru/population): the prevalence of women (54%) over men (46%) and the skewness in age groups (leaders are 26–40 years old −30%; and 41–55 years old −25%). The study sample retains this pattern in the predominance of women and people aged 26–40. However, the sample structure of respondents at every municipality had people of both genders and all age groups, including below 26 and above 40 years old.
Second, the specifics of the research topic also played a significant role in obtaining the voluntary consent of residents to take the survey. Often, residents of municipalities aged over 40 refused to take part in the survey because they did not see themselves as users of digital technologies. We took this into account as a general input to the study, but these respondents were not included in the sample since they did not fill out the questionnaire. It is likely that if their answers were still received, the proportion of active users of digital routines among populations aged 41 and above would be even lower. The very refusal of the survey and the rejection of the topic of digitalization testifies to a significant digital divide between the older and younger generations.
Third, the bias towards the predominance of women is due to personal factors. Women turned out to be more open to communication on the street with strangers than men. In the course of the interviews, it was also revealed that when answering the questions, the women expressed their opinions based on family experience, including their husband, son, brother, etc. (if any). Therefore, we can talk about indirect accounting in the study of the male experience of using digital technologies in female responses. Unfortunately, fewer direct answers were received in the form of a completed questionnaire from males. However, the article did not aim to identify gender differences in the use of digital routines per se. Earlier studies point to the primacy of socio-economic development for digitalization rather than gender, as shown by the example of Slovakia (Urbančíková et al., Citation2017). The gender digital divide is more prevalent in countries where women are still poorly educated, have high domestic workloads and sociocultural attachments to men, for example, in Rwanda (Mumporeze & Prieler, Citation2017).
Statistical data on education are not available as of 2020. The most complete data on the education of the population of the Kaliningrad region are presented in the All-Russian census of the population of Russia in 2010. In 2015, a sample survey of the population of the region was carried out as part of a micro-census (Rosstat, https://kaliningrad.gks.ru/Microcensus-2015), according to which among the respondents over 18 who have indicated their level of education, 44.8% had secondary vocational, 30% – higher, including postgraduate, the remaining 25.2% – secondary general education. In our survey, the share of the population with higher education is 47.9%, and with secondary vocational education is 34%. This, among other things, is due to the prevalence of the age group ‘18–40 years old’ in the sample of respondents, which is characterized by a relatively large share with higher education (36% according to the 2015 micro-census).
When interpreting the results of the survey, three groups of respondents were identified according to the dynamics of online shopping activity during the period of lockdown: A – online activity was before and increased during the period of lockdown (flexible active users); B – online activity was before and remained at the same level during the period of lockdown (stable moderate users); and C – there was no online activity before and it did not happen during the period of lockdown (retrograde cautious users). There were no respondents who reported online activity before the period of lockdown with a subsequent decrease. The logic of this division is based on the hypothesis formulated at the beginning of the study that the dynamics of online shopping, as the most basic digital routine, can be a marker of the population’s receptiveness to and adoption of innovation during the COVID-19 pandemic.
RESEARCH RESULTS
About 75% of all respondents have experience purchasing goods and/or services via the Internet. At the same time, a third of them began to make online purchases more often during the lockdown in comparison with the period before the pandemic. The distribution of respondents in the three groups is as follows: group A accounts for 23%; group B for 52%; and group C for 25%. Group A has the highest proportion of respondents with higher education (65.2%), versus 50.8% in group B and 37.4% in group C. It also has the highest proportion of women of the three groups −85.3% for comparison in groups B and C −77.9% and 80.4%. It should be noted that most of the men entered the second group B, followed by the decreasing groups C and B. The following pattern is observed in the distribution by age: group A is characterized by a significant superiority in the number of respondents from 26 to 40 years old: 58.8% of respondents in the group and 29.7% in the general sample. Also, for group A, a high proportion of young people under 25 years old remains: 20.6% in the structure of respondents in the group and 26.3% in the sample. Group B also has a high proportion of 26–40 years old, but there are less than half of them −46.8%, and the proportion of those over 40 (31.2%) is growing. The most aged group is C, in which more than half of the respondents are over 40 years old, including from 41 to 55 years old −32.9%, from 56 to 70 years old −21.9%, and over 71 −4.1%.
shows the territorial distribution of three groups of respondents in the context of the municipalities of the Kaliningrad region.
Figure 3. Geography of residence of respondents in the context of three groups A–C (%).
Source: Developed by the authors.
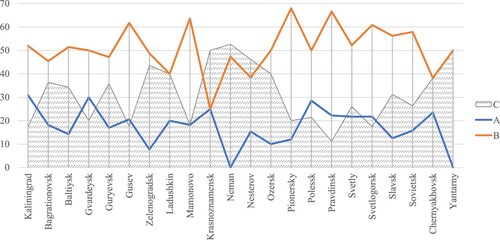
We have singled out the least innovation adaptive municipalities, where the share of respondents in group C significantly exceeds the share of other groups. These are the Krasnoznamensk, Neman and Nesterov urban districts located in the east of the Kaliningrad region, as well as the predominantly tourist urban district Yantarny. Average rates of innovation adaptation are found for the populations of Bagrationovsk, Baltiysk, Guryevsk, Zelenogradsk, Ozersk, Pionersky, Svetly, Slavsk and Chernyakhovsk urban districts and the city of Ladushkin. The most innovatively active is the population of the regional centre – the city of Kaliningrad, as well as the more economically developed urban districts located in its agglomeration: Mamonovo, Gvardeisk, Polessk, Pravdinsk, Svetlogorsk and a remote Gusev urban district.
The distribution of digital routines by the level of demand among the surveyed population of the Kaliningrad region is not uniform. To a greater extent, digitalization affected communication and leisure (92% of respondents have an account in social networks); such repetitive actions as paying bills for housing and communal services, communications and the Internet, where the recurring setup of payment is possible (81.5% of respondents); searching for goods (both new and used) and services at online marketplaces (74.2% of respondents). The adoption of digital routines in the field of e-government is relatively lower. Only 51.3% of the surveyed population used the portal of state and municipal services of the Russian Federation Gosuslugi (www.gosuslugi.ru), which has been operating since December 2009 and is the main place for receiving services from the state. Even less −46% is the share of those who use the online opportunity for booking appointments for doctor, post office, various state or municipal institutions. This is largely due to the specifics of the digital services themselves or the need to supplement the online application with a print one. The lowest level of digital adoption is the job search. Only 41.4% of respondents searched for open vacancies on specialized sites such as Rabota.ru, HeadHunter, etc., and 40% were interested in working remotely.
shows the distribution of respondents by groups A–C according to the level of use of digital technologies when performing various routine actions in everyday life.
Figure 4. Share of respondents in groups A–C on the implementation of various digital routines (%).
Source: Developed by the authors.
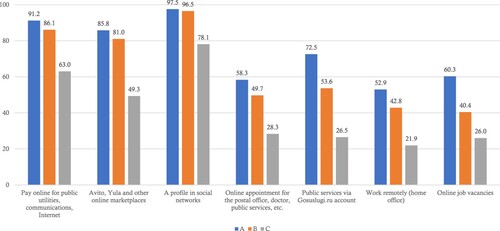
In the context of the noted digital routines, the share of respondents in group A is higher than in other groups. This indicates that those who indicated a change in their consumer preferences towards expanding online shopping during the pandemic are also more active users of other digital services. Most of them have accounts on social networks, pay their bills online, strive to minimize personal contact when visiting public institutions and getting the required services virtually. About half of them would like to work remotely and 60% have already used online services to find a job. Group B respondents also perform digital routines quite widely, however, primarily related to virtual communication, shopping and paying bills. The digital routines that are associated with obtaining a service or job (this often requires additional actions: registration, understanding complex access scheme, downloading additional information and/or documents) are less in demand (). The respondents in group C lag significantly behind the first two groups in terms of the level of implementation of digital technologies in everyday life. Among them, the share of those using various digital services is less than 30%. The exceptions are social networks, payment of bills and services for searching goods and/or services online; however, the share of group C is still significantly smaller relative to groups A and B.
Additionally, we considered the demand for the main channels for receiving news and information. In the first place are news articles on the Internet, posted on news portals, which are viewed by 62.3% of respondents; in second place is television (31.2%, which is twice less popular); the third place was shared by messengers (Viber, Telegram, WhatsApp, etc.) and blogs −25% each. Another 17.2% of respondents watch videos on YouTube. The least popular news channels are radio (7.6%) and print newspapers and magazines (5.6%). It should be noted that personal contacts remain an important channel for disseminating news: 41.1% of the respondents learn about news from relatives, friends and acquaintances. shows the distribution of respondents from groups A–C by the main channels of receiving news and information.
Figure 5. Share of respondents in groups A–C by main news channels (%).
Note: When answering this question, respondents could choose multiple answers.
Source: Developed by the authors.
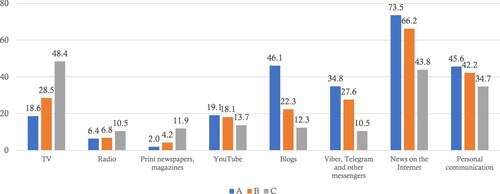
Group A respondents mainly find out news via the Internet through various resources, first, news portals, blogs and opinion leaders in social networks, channels in instant messengers. At the same time, personal communication for them is just as important as viewing posts and stories online (). On the contrary, the respondents of group C widely use traditional channels of news dissemination, and their share in obtaining information from television (48.4%), newspapers, magazines (11.9%) and radio (10.5%) is significantly higher than that of groups A and B. Respondents in group C use digital information channels significantly less often and showed the lowest values for the priority of personal communication for news exchange (34.7%). Group B respondents took an intermediate position between polar groups A and C, preferring to combine news from Internet sources (66.2%) with television (28.5%) and interpersonal communication (42.2%).
Differences in the set of news sources used often featuring different approaches to the presentation of information, according to our observation, leads to subsequent differences in the perception of the same events, which is important to consider when implementing the policy of digitalization of the state and society. In our study, we went further and asked questions characterizing the readiness and desire of the population to expand the number of digital routines in their everyday life. Most positively the respondents perceived the idea of introducing a single digital medical book for each patient, which was supported by 58.8% of respondents. Also, slightly less than half voted for introducing an electronic tax system, a universal ID card, and the assignment of official status to remote work. The weakest support was given to the ideas of digitalization in areas related to trust in government. Only 29.2% of respondents agreed to receive all public documents only in digital form, and 28.8% agreed to implement an online election system. Many respondents indicated that, in general, they are not against these innovations, but they fear that they will work poorly, and the situation will get worse. The greatest sharply negative reaction was associated with the development of online distance education through the introduction of ICTs in the educational process. Only 16.4% of respondents supported the development of this form of education. shows the spatial distribution of respondents who positively assessed the expansion of digital routines.
Figure 6. Territorial distribution of respondents who positively assessed the expansion of digital routines (%).
Source: Developed by the authors.
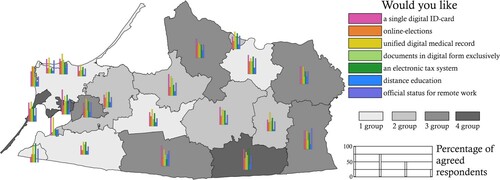
In the course of the analysis, we compared the shares of respondents who positively assessed the expansion of digital routines in the context of municipalities with the regional average values. Despite the general similar dynamics of perceptions over the suggested digital routines, there are a number of deviations from the average values, which made it possible to distinguish four groups:
First group: an approval rate of five or more digital routines is below average (Zelenogradsk, Gvardeisk, Svetlogorsk, Bagrationovsk, Mamonovo, Krasnoznamensk).
Second group: an approval rate of four digital routines is below average (Guryevsk, Gusev, Chernyakhovsk, Polessk, Sovetsk, Ladushkin).
Third group: an approval rate of one to three digital routines is below average (Pravdinsk, Kaliningrad, Yantarny, Pionersky, Slavsk, Neman, Nesterov).
Fourth group: an approval rate of all digital routines is below average (Baltiysk, Ozersk, Svetly).
DISCUSSION
When analysing the survey results in the context of groups A (flexible active users), B (stable moderate users) and C (retrograde cautious users) groups of respondents, we revealed certain regularities between the increase in online purchasing activity during the period of lockdown and the implementation of other digital routines. Our research has shown that a typical portrait of respondents who answered affirmatively about the expansion of their consumer habits towards online consumption is the following: they are predominantly the residents of a regional centre or an economically developed municipality, dominated by age groups 26–40, with higher education and mostly a good access to the Internet. shows the proportion of resident groups A and C across municipalities.
Figure 7. Distribution of respondents from polar groups A and C by municipalities (%).
Source: Developed by the authors.
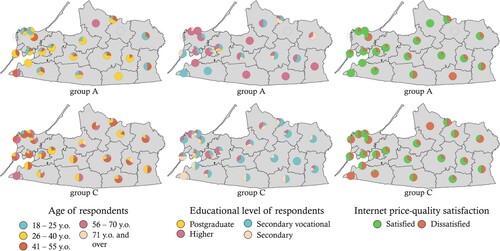
It is group A (flexible active users), which on average accounts for 23% of the respondents (maximum 30.9% in Kaliningrad), who are most predisposed to expand digitalization and are ready to introduce digital technologies into their daily routines. This was reflected in the distribution of respondents for various digital routines such as paying bills, finding and buying goods, receiving government and social services, looking for a job on the Internet, and checking news online. It should be noted that all groups of the population in terms of education and age were included in each group A–C. Therefore, it cannot be argued that all residents from 26 to 40 years old with higher education are characterized by a strong susceptibility to the introduction of digital technologies ().
Also, in our study, we analysed whether the receptiveness of the population to digitalization is related to reasons such as the level of coverage of the territory of the municipality with Internet connection () and the incidence of COVID-19 (). Here and for , colours indicate municipalities in terms of innovation receptiveness based on the ratio of groups of respondents A–C (): orange – high, blue – medium, and grey – low.
Figure 8. Distribution of municipalities of the Kaliningrad region by the ratio of indicators of density of Internet coverage and satisfaction with Internet communication.
Note: Internet coverage density is calculated as the share of the municipality’s territory covered in total by 3G and/or 4G networks from the four largest telecom operators Beeline, MTS, Megafon and Tele2.
Source: Developed by the authors.
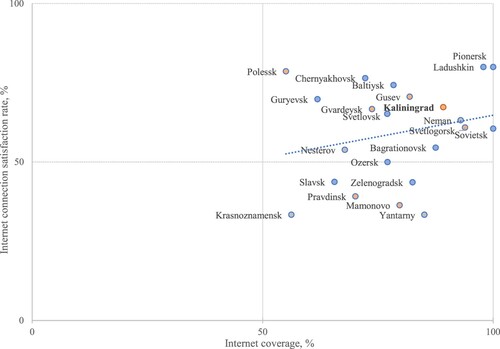
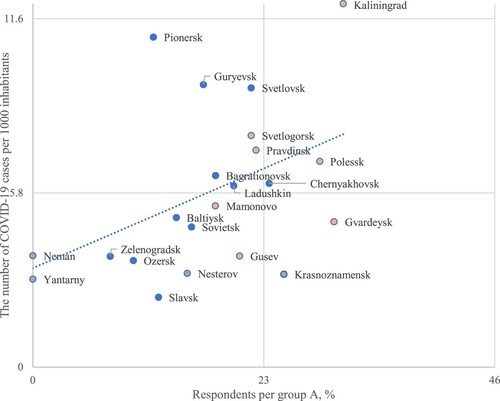
Figure 9. Distribution of municipalities in the Kaliningrad region by the ratio of the number of COVID-19 cases per 1000 inhabitants (as of November 2020) and the share of flexible active users (group A).
Source: Developed by the authors.
The correlation coefficient between the density of the Internet coverage and the satisfaction with the Internet connection by the population of the municipalities of the Kaliningrad region is 0.233, which indicates a weak connection between them. illustrates the differentiation of municipalities by the indicators under consideration. Pravdinsk, Mamonovo, Slavsk, Yantarny and Krasnoznamensk municipalities, with a coverage density of less than 50%, demonstrate a level of satisfaction with the ratio of quality and price of Internet communications above 50% of respondents. The rest of the municipalities have relatively high levels of coverage and satisfaction with the Internet. Note that such a discrepancy in the level of coverage and satisfaction of the population may be caused by the quality of services provided or overpriced services. When conducting the survey, a number of respondents indicated problems with the quality of the Internet, even within different districts of the same city, depending on the service provider.
The correlation coefficient we calculated between the share of the most innovatively active respondents (group A – flexible active users) and the number of COVID-19 cases per 1000 inhabitants is 0.443, which is higher than in the case of Internet coverage, but it also indicates a weak dependence. illustrates the differentiation of municipalities according to the indicators under consideration. The group with morbidity rates higher than the average for the municipalities of the region as a whole (5.8 per 1000 inhabitants) included the Pionersky, Guryevsk, Svetly, Svetlogorsk, Pravdinsk, Bagrationovsk and Ladushkin urban districts which are part of the Kaliningrad agglomeration, in which the share of flexible active users is below the average for the region, as well as Kaliningrad, Polessk and Chernyakhovsk urban districts with higher indicators of innovative receptiveness of the population. Also, the Gvardeisk and Krasnoznamensk municipalities should be singled out separately, where the incidence rate is not so high, but the proportion of group A respondents is above average.
presents the final typology of municipalities by combining their level of innovation adoption () and interest in expanding digital routines ().
Figure 10. Typology of municipalities of the Kaliningrad region by the degree of digitalization.
Source: Developed by the authors.
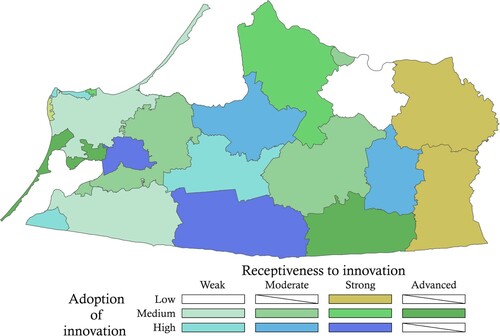
We have identified 12 types of municipalities (nine are represented in the Kaliningrad region) with a different combination of levels of innovation adoption in everyday life and openness to digitalization, which indicates a significant diversity of territories and the multifactorial nature of this process. Kaliningrad and Pravdinsk urban district turned out to be most ready for active digitalization, while Neman urban district has the weakest positions.
CONCLUSIONS
Digitization is a bright trend of our time. Digital technologies are increasingly being introduced into all spheres of life. This became especially relevant during the pandemic, when social distance, lockdown (including self-isolation) and remote work formed a new reality in the life of people around the world. In our study, we wanted to identify how the COVID-19 pandemic affected the ordinary life of the population in the context of digitalization and to explore various territorial and structural patterns of the spread of digital routines. To achieve our goal, we studied the case of the Kaliningrad region of Russia by conducting a representative survey of residents of all municipalities. According to the results of the study, we saw that there is a wide variety of municipalities within the same region in terms of both the level of digital routine adopted by the population and receptiveness to innovation. On the one hand, we have identified a population group (flexible active users) that has increased the level of use of digital technologies in their everyday life during the period of lockdown, and for them the pandemic has really become a driver for digitalization. On the other hand, we also identified a large group of the population (retrograde cautious users) that is not at all involved in the digitalization process (there is no interest, relevant knowledge, needs, technical, infrastructural or economic opportunities for a number of other reasons), and for them, the pandemic did not have such an impact. Thus, our study showed that the COVID-19 pandemic can only be viewed as an additional ‘incentive’ to expand the use of digital technologies in society, but the real acceleration of this process is impossible without an appropriate economic, infrastructural, knowledge, technological and cultural–behavioural basis.
In this regard, when building a regional development strategy based on innovations and a wider implementation of digital technologies in all spheres of public life, authorities should take into account the existing digital divide between population groups – flexible active users (group A), stable moderate users (group B) and retrograde cautious users (group C), which have very different susceptibility to digitalization. It can be expected that flexible active users (group A) and stable moderate users (group B) will be more open to initiatives in the framework of digitalization policy, while group A will strive to implement them altogether. Whereas the population from group C (retrograde cautious users) will most likely react negatively and boycott the digital initiatives. When initiating state policies in a broad context of a digital society, it is important to understand the territorial heterogeneity of the digital space of the region in order to prevent or reduce possible discontent from the unprepared population. Building on the experience of earlier studies (Atkinson et al., Citation2008; Song et al., Citation2020), as well as the results of the current research, in order to narrow the digital divide, it is first necessary to focus on increasing the overall socio-economic development level of regions concentrating the largest share of the population least involved in the digitalization process (group C – retrograde cautious users). Accelerated digitalization is possible only in regions with a predominance of the population from group A – flexible active users.
ACKNOWLEDGEMENTS
The authors thank A. Torre, A. N. Pilyasov and other colleagues for the opportunity to present, and for valuable comments, at the online conference ‘The World in COVID-19: The Impact of the Pandemic on the Development of Countries and Regions’, Lomonosov Moscow State University, Russia, 20–21 November2020.
DISCLOSURE STATEMENT
No potential conflict of interest was reported by the authors.
Additional information
Funding
REFERENCES
- Akpan, I. J., Udoh, E. A. P., & Adebisi, B. (2020). Small business awareness and adoption of state-of-the-art technologies in emerging and developing markets, and lessons from the COVID-19 pandemic. Journal of Small Business and Entrepreneurship. https://doi.org/https://doi.org/10.1080/08276331.2020.1820185.
- Anton, J. (1996). Customer relationship management: Making hard decisions with soft numbers. Prentice Hall.
- Archibugi, D., Filippetti, A., & Frenz, M. (2013). Economic crisis and innovation: Is destruction prevailing over accumulation? Research Policy, 42(2), 303–314. https://doi.org/https://doi.org/10.1016/j.respol.2012.07.002
- Artemenko, DА, Yalunina, E. N., Panfilova, ЕА, Sinyuk, T. Y., & Prokopets, T. N. (2020, June). Indicators of digital inequality and spatial development of the ICT sector in the Russian Federation. Inclusive Development of Society: Proceedings of the 6th International Conference on Management and Technology in Knowledge, Service, Tourism & Hospitality (SERVE 2018) (pp. 187). CRC Press.
- Atkinson, J., Black, R., & Curtis, A. (2008). Exploring the digital divide in an Australian regional city: A case study of Albury. Australian Geographer, 39(4), 479–493. https://doi.org/https://doi.org/10.1080/00049180802419203
- Brown, M., Ezike, R., & Stern, A. (2020). How Cities Are Leveraging Technology to Meet Residents’ Needs during a Pandemic. Urban Institute. https://www.urban.org/sites/default/files/publication/102355/how-cities-are-leveraging-technology-to-meet-residents-needs-during-a-pandemic_0_0.pdf.
- Cruz-Jesus, F., Oliveira, T., Bacao, F., & Irani, Z. (2017). Assessing the pattern between economic and digital development of countries. Information Systems Frontiers, 19(4), 835–854. https://doi.org/https://doi.org/10.1007/s10796-016-9634-1
- DiMaggio, P., Hargittai, E., Celeste, C., & Shafer, S. (2004). Digital inequality: From unequal access to differentiated use. In K. Neckerman (Ed.), Social inequality (pp. 355–400). Russell Sage Foundation.
- Eichhorn, T., Jürss, S., & Hoffmann, C. P. (2020). Dimensions of digital inequality in the sharing economy, Information, Communication & Society. https://doi.org/https://doi.org/10.1080/1369118X.2020.1791218.
- Fletcher, G., & Griffiths, M. (2020). Digital transformation during a lockdown. International Journal of Information Management, 55, 102185. https://doi.org/https://doi.org/10.1016/j.ijinfomgt.2020.102185
- Gilbert, M. R., & Masucci, M. (2020). Defining the geographic and policy dynamics of the digital divide. In Handbook of the changing world language map (pp. 3653–3671).
- Guner, H., & Acarturk, C. (2020). The use and acceptance of ICT by senior citizens: A comparison of technology acceptance model (TAM) for elderly and young adults. Univ Access Inf Soc, 19(2), 311–330. https://doi.org/https://doi.org/10.1007/s10209-018-0642-4
- Hesse, M., & Rafferty, M. (2020). Relational cities disrupted: Reflections on the particular geographies of COVID-19 for small but global urbanisation in Dublin, Ireland, and Luxembourg city. Luxembourg. Tijdschrift Voor Economische En Sociale Geografie, 111(3), 451–464. https://doi.org/https://doi.org/10.1111/tesg.12432
- Jahanmir, S. F., & Cavadas, J. (2018). Factors affecting late adoption of digital innovations. Journal of Business Research, 88, 337–343. https://doi.org/https://doi.org/10.1016/j.jbusres.2018.01.058
- Kahn, K. B. (2018). Understanding innovation. Business Horizons, 61(3), 453–460. https://doi.org/https://doi.org/10.1016/j.bushor.2018.01.011
- Kraus, S., Clauss, T., Breier, M., Gast, J., Zardini, A., & Tiberius, V. (2020). The economics of COVID-19: Initial empirical evidence on how family firms in five european countries cope with the corona crisis. International Journal of Entrepreneurial Behaviour and Research, 26(5), 1067–1092. https://doi.org/https://doi.org/10.1108/IJEBR-04-2020-0214
- Kravchenko, N., Kuznetsova, S., Ivanova, A., & Shemyakin, A. (2020). Regional aspects of digital economic development. In M. Bilgin, H. Danis, G. Karabulut, & G. Gözgor (Eds.), Eurasian economic perspectives. Eurasian studies in business and economics, vol 13/1. Springer. https://doi.org/https://doi.org/10.1007/978-3-030-40375-1_19.
- Kuc-Czarnecka, M. (2020). COVID-19 and digital deprivation in Poland. Oeconomia Copernicana, 11(3), 415–431. https://doi.org/https://doi.org/10.24136/oc.2020.017
- Kuznetsov, S. V., Lachininskiy, S. S., Mikhaylov, A. S., & Shendrik, A. V. (2019). “Propulsive industries” of the regions of Russia’s western borderland under of geopolitical turbulence. Economy of Region, 15(4), 1253–1265. https://doi.org/https://doi.org/10.17059/2019-4-22
- Mumporeze, N., & Prieler, M. (2017). Gender digital divide in Rwanda: A qualitative analysis of socioeconomic factors. Telematics and Informatics, 34(7), 1285–1293. https://doi.org/https://doi.org/10.1016/j.tele.2017.05.014
- Pal, D., & Vanijja, V. (2020). Perceived usability evaluation of Microsoft teams as an online learning platform during COVID-19 using system usability scale and technology acceptance model in India. Children and Youth Services Review, 119, Article No. 105535. https://doi.org/https://doi.org/10.1016/j.childyouth.2020.105535
- Papadopoulos, T., Baltas, K. N., & Balta, M. E. (2020). The use of digital technologies by small and medium enterprises during COVID-19: Implications for theory and practice. International Journal of Information Management, 55, 102192. https://doi.org/https://doi.org/10.1016/j.ijinfomgt.2020.102192
- Pérez-Morote, R., Pontones-Rosa, C., & Núñez-Chicharro, M. (2020). The effects of e-government evaluation, trust and the digital divide in the levels of e-government use in European countries. Technological Forecasting and Social Change, 154, 119973. https://doi.org/https://doi.org/10.1016/j.techfore.2020.119973
- Priyono, A., Moin, A., & Putri, V. N. A. O. (2020). Identifying digital transformation paths in the business model of SMEs during the covid-19 pandemic. Journal of Open Innovation: Technology, Market, and Complexity, 6(4), 1–22. https://doi.org/https://doi.org/10.3390/joitmc6040104.
- Richter, A. (2020). Locked-down digital work. International Journal of Information Management, 55, 102157. https://doi.org/https://doi.org/10.1016/j.ijinfomgt.2020.102157
- Rogers, E. (2003). The Diffusion of innovations. Fifth edition. The Free Press.
- Rosstat. (2020). Monitoring the development of the information society in the Russian Federation. Indicators of the development of the information society in the Russian Federation. URL: https://rosstat.gov.ru/folder/14478.
- Sharifi, A., & Khavarian-Garmsir, A. R. (2020). The COVID-19 pandemic: Impacts on cities and major lessons for urban planning, design, and management. Science of the Total Environment, 749, 142391. https://doi.org/https://doi.org/10.1016/j.scitotenv.2020.142391
- Song, Z., Wang, C., & Bergmann, L. (2020). China’s prefectural digital divide: Spatial analysis and multivariate determinants of ICT diffusion. International Journal of Information Management, 52, 102072. https://doi.org/https://doi.org/10.1016/j.ijinfomgt.2020.102072
- Švarc, J., Lažnjak, J., & Dabić, M. (2020). The role of national intellectual capital in the digital transformation of EU countries. Another digital divide?. Journal of Intellectual Capital, 22(4). https://doi.org/https://doi.org/10.1108/JIC-02-2020-0024
- Urbančíková, N., Manakova, N., & Bielcheva, G. (2017). Socio-economic and regional factors of digital literacy related to prosperity. Quality Innovation Prosperity, 21(2), 124–141. https://doi.org/https://doi.org/10.12776/qip.v21i2.942