
ABSTRACT
In a structuralist reading, the hegemonies of the global economy are perceived as threateningly fixed. We suggest understanding the global knowledge economy as an always unfinished project of ordering socio-spatial relations. To better communicate the struggles of peripherally located places/companies associated with this process of spatial ordering, we provide a simplified visualization of the global knowledge economy.
INTRODUCTION AND CONTEXT
From a Global North perspective, the global knowledge economy (GKE) can be seen as a dominant representation of the global economic order. In our research project we study how this hegemonic order is perceived, re-produced or challenged from Global South (Collyer et al., Citation2019) and Global East (Müller, Citation2020) perspectives. Further, we ask how internationally active and innovative companies from the ‘double-peripheries’ in Central Asia/South Caucasus and Sub-Sahara Africa emerge and integrate into this GKE or construct their own understandings of potentially more diverse global economies. With a ‘double-periphery’ we play with a Global North understanding of periphery as beyond both, the ‘leading’ world regions in terms of gross domestic product (GDP) and economic concentration, and the nodal points of the global economy, namely global/world cities. With our visualization of the GKE, we challenge the inherent unevenness of the global economy and the predominance of the Global North when traditional measures are used.
THE GLOBAL KNOWLEDGE ECONOMY AND SPATIAL ORDERING
Roberts (Citation2009, p. 288) defines the GKE as the:
growing economic interdependence and integration between countries brought about through the increasing cross-border mobility of goods, services, capital and people facilitated by technological change, the rise of multinational corporations (MNCs) and the liberalizing policies of nation-states and international regulatory institutions.
READING THE GKE MAP
The map shown in highlights global inequalities in economic development and hints at dynamics in the past decade, strikingly to be seen in the rising number of top 100 companies in Asia – especially China – to the detriment of Europe (specifically London), and growing shares of global GDP and trade in North America and Asia with a significant decline in Europe. Africa shows the lowest values in the institutional dimension of innovation systems (GII).
Figure 1. The ‘global knowledge economy’ (GKE).
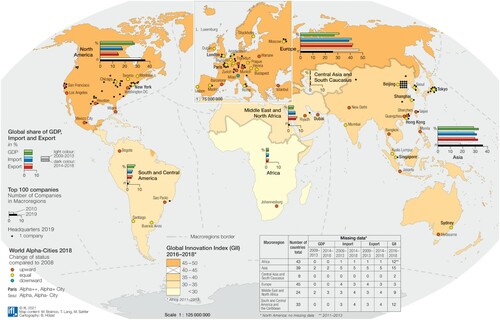
Our multi-scalar visualization hints at the centrality of large agglomerations and megaregions, showing particular densities in North America, Europe and Eastern China, with Guangzhou and Shenzhen rising to Alpha World Cities. World Cities are thought of as places that offer central services to support firm internationalization. In the other macro-regions, the map rather suggests a static relational view notwithstanding the rise of Dubai and Riyadh as World Cities. Central Asia/South Caucasus and Africa are not represented with top 100 companies, while in South America/Caribbean and Middle East and North Africa (MENA) they are related to extractive industries.
METHODOLOGICAL AND TECHNICAL CHALLENGES
In line with the definition by Roberts (Citation2009), we selected a set of indicators as best possible proxies to issues of economic development (global share of GDP), innovation systems and knowledge (GII), trade flows (global share of import/export), large corporations (top 100 companies) and nodal points (Alpha World Cities). The GII assesses national innovation systems (Jankowska et al., Citation2017) in a rather traditional understanding. Large corporations were chosen by revenue. This means also that extractive industries are included in the dataset next to financial and multinational corporations. World Cities are measured relationally and hierarchically (Taylor & Derudder, Citation2016). They provide network connectivity and link major economic regions into the world economy.
The original data refer to local and national scales. While showing city-level data (World Cities, companies) as point symbols, we have aggregated all national data. To highlight macro-regional differences, we illustrate GII data as cartogram and relational data (GDP, import, export) using bar charts. This allows for better comparability and for visualization of dynamic processes. To cope with data issues (e.g., outlier cases or missing values), we used mean values over periods of five years (three years for GII). To further highlight trends between macro-regions we included a comparison of the top 100 companies between 2010 and 2019 and the position of Alpha World Cities between 2008 and 2018.
A technological challenge was to show data gaps as support for map interpretation. In favour of a visual focus on the macro-regions, we decided against graphically highlighting gaps in the map itself and opted for a supplementary table. However, this disguises the fact that missing data in Asia relate more to island states, while data on large, densely populated territorial states are missing for Africa.
CONCLUSIONS
We have produced a complex map, working with six indicators covering a 10-year period, representing aspects of the GKE which are commonly considered relevant. The map draws attention to uneven development and increasing macro-regional inequalities as well as to the relationships between those measures. Thus, it provides a starting ground for researching firm, economic and regional development in the context of globalization.
For future visualizations, we postulate a need to include flows and networks graphically. Moreover, as data are mainly compiled by powerful actors with their own agendas, alternative indicators, other measures of knowledge and non-Northern conceptualizations that challenge current representations of the GKE are needed in order to avoid the visual reproduction of power relations inscribed in them. In this respect, we suggest seeing our map as a starting point for further discussion.
DISCLOSURE STATEMENT
No potential conflict of interest was reported by the authors.
DATA AVAILABILITY STATEMENT
Raw data were retrieved from https://www.lboro.ac.uk/gawc/gawcworlds.html (World Cities); https://fortune.com/global500/2019/search/ and https://money.cnn.com/magazines/fortune/global500/2010/full_list/ (Top 100 International Companies); https://www.theglobaleconomy.com/ (gross domestic product (GDP), export/import, GII). Derived data supporting the findings of this study are available from the corresponding author on request.
Additional information
Funding
REFERENCES
- Collyer, F., Maia, J., Connell, R., & Morrell, R. (2019). Knowledge and global power. Making new sciences in the south. Wits University Press.
- Jankowska, B., Matysek-Jędrych, A, & Mroczek-Dąbrowska, A. (2017). Efficiency of national innovation systems – Poland and Bulgaria in the context of the global innovation index. Comparative Economic Research. Central and Eastern Europe, 20(3), 77–94. https://doi.org/https://doi.org/10.1515/cer-2017-0021
- Marung, S., & Middell, M. (2019). The respatialization of the world as one of the driving dialectics under the global condition. In S. Marung & M. Middell (Eds.), Spatial formats under the global condition (pp. 1–11). Walter de Gruyter.
- Müller, M. (2020). In search of the global east: Thinking between North and South. Geopolitics, 25(3), 734–755. https://doi.org/https://doi.org/10.1080/14650045.2018.1477757
- Roberts, J. (2009). The global knowledge economy in question. Critical Perspectives on International Business, 5(4), 285–303. https://doi.org/https://doi.org/10.1108/17422040911003033
- Taylor, P. J., & Derudder, B. (2016). World city network – A global urban analysis (2nd ed.). Routledge.