
ABSTRACT
Scholars have long been interested in where new technologies and industries emerge. This regional graphic examines the emergence of one such technology: blockchain. We developed a global database of blockchain firms, as well as capturing investment rounds at the firm level, using Crunchbase, a well-accepted source of information on technology firms. We geocoded the dataset and created original network data at the city-region level to capture investment interactions. We find that blockchain firms are located in cities around the world. However, firms receiving investments are concentrated in a small number of global city-regions, with Silicon Valley, New York, Singapore, London, and Beijing accounting for half of all investments. Moreover, there appear to be supra-regional networks, suggesting that new technology firms continue to concentrate in a handful of interconnected world cities.
Scholars have long been interested in where new technologies and industries emerge. Technology firms tend to locate in world cities and technology hubs, with concentrations of highly skilled workers, venture capital, anchor institutions and knowledge infrastructure (Brail, Citation2020). Blockchain, a distributed ledger system that allows for record-keeping without central oversight, is one such emerging technology. Although blockchain is best known as a disruptive financial technology associated with cryptocurrencies such as Bitcoin, it can be used in supply chain optimization, royalty and copyright tracking, cybersecurity, refugee identity and transaction systems, and voting systems. There is limited scholarship on the blockchain industry (cf. Fernandez-Vazquez et al., Citation2019; Park et al., Citation2020; Zook & Grote, Citation2020), and very few studies focus on the location patterns of the blockchain industry or the investment flows supporting these firms (see Friedlmaier et al., Citation2018, for an exception).
We developed a novel database of 3839 blockchain firms founded between 2010 and 2018 using Crunchbase,Footnote1 including data on employment, location and area of application specialization. For firms receiving investments (25.9%), we collected information on investment rounds. We geocoded the dataset and created original network data at the city-region level to capture investment interactions.
We visualize the global geography of blockchain firms and the related network of investment (), showing places with 10 or more investments to capture meaningful levels of interactions. We illustrate the level of interaction as measured by the number of investments between cities from low (blue, thin) to very high (red, thick), using a natural breaks scale determined by the Jenks optimization algorithm. Line widths and colour gradations accentuate differences in levels of interaction; redder, thicker lines represent higher numbers of interactions.
Figure 1. Global geography of investment in blockchain firms.
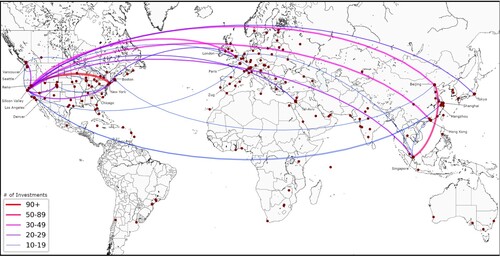
While there are blockchain firms on almost every continent, firms receiving investments are concentrated in a small number of cities. Unsurprisingly, Silicon Valley is the most highly connected place, with connections to both global financial centres (e.g., Tokyo, London and Singapore), as well as smaller tech hubs in Canada, Israel and elsewhere. Five locations account for approximately half of the 3243 investments (51.4%): Silicon Valley, New York, Singapore, London and Beijing. These five centres are also highly connected to one another. There also appears to be supra-regional networks suggesting that new technology firms continue to concentrate in a handful of interconnected world cities.
ACKNOWLEDGEMENTS
The authors are grateful for the constructive comments offered by Shauna Brail (University of Toronto), Heather Hall (University of Waterloo), Markus Moos (University of Waterloo) and the anonymous reviewers. This paper is based on Holicka (Citation2021).
DISCLOSURE STATEMENT
No potential conflict of interest was reported by the authors.
Additional information
Funding
Notes
1 Crunchbase is one of the leading proprietary business databases providing extensive information on technology sector firms, including start-ups.
REFERENCES
- Brail, S. (2020). World cities of ride-hailing. Urban Geography. https://doi.org/10.1080/02723638.2020.1775030
- Fernandez-Vazquez, S., Rosillo, R., De La Fuente, D., & Priore, P. (2019). Blockchain in FinTech: A mapping study. Sustainability, 11(22), 6366. https://doi.org/10.3390/su11226366
- Friedlmaier, M., Tumasjan, A., & Welpe, I. M. (2018). Disrupting industries with blockchain: The industry, venture capital funding, and regional distribution of blockchain ventures. Retrieved May 17, 2021, from https://core.ac.uk/reader/143481280
- Holicka, M. (2021). The emerging geography of the blockchain industry. Thesis, Department of Geography and Environmental Management, University of Waterloo.
- Park, G., Seungryul, R. S., & Choy, M. (2020). Early mover (dis)advantages and knowledge spillover effects on blockchain startups’ funding and innovation performance. Journal of Business Research, 109, 64–75. https://doi.org/10.1016/j.jbusres.2019.11.068
- Zook, M., & Grote, M. H. (2020). Initial coin offerings: Linking technology and financialization. Environment and Planning A: Economy and Space, 52(8), 1560–1582. https://doi.org/10.1177/0308518X20954440