
 ?Mathematical formulae have been encoded as MathML and are displayed in this HTML version using MathJax in order to improve their display. Uncheck the box to turn MathJax off. This feature requires Javascript. Click on a formula to zoom.
ABSTRACT
Over the past decade, the Beveridge curve in the Austrian labour market has shifted significantly outward. Using detailed administrative data on job vacancies and registered unemployed persons by region and skill level, we investigate which factors have caused this shift. We find that the Beveridge curve has shifted mainly because mismatch has increased significantly. Looking at the regional and skill level dimensions of mismatch unemployment, we find a significant increase in mismatch unemployment in manual routine jobs and in the Vienna region of Austria.
INTRODUCTION
The Austrian unemployment rate rose from around 4% in the early 2000s to 5.6% in 2005 and, after the Great Recession, to around 6% in 2015. The rising unemployment rate and a sharp increase in the vacancy rate led to a significant outward shift of the Beveridge curve. Schiman (Citation2021) argues that the Austrian Beveridge curve shifted due to a labour supply shock caused by the opening of the labour market to several Eastern European countries after 2008. However, Christl et al. (Citation2016) and Christl (Citation2020), using detailed data on the labour market transition, argue that the shift was primarily caused by an increase in labour market mismatch.
An increase in labour market mismatch implies a decrease in matching efficiency, that is, the productivity of the process of matching jobseekers with available jobs. If demanded and offered skills are no longer matched, this could be due to a decline in the matching productivity (Şahin et al., Citation2014). Such a mismatch can be caused, for example, by changes in the institutional environment (Klinger & Weber, Citation2016). Regional mismatch occurs when job vacancies and unemployed persons are located in different regions (Manacorda & Petrongolo, Citation2006). Changes in the composition of the labour force can lead to mismatch (Kolsrud, Citation2018). In addition, a reduction in the search intensity of workers, for example, due to changes in unemployment benefits (Valletta & Kuang, Citation2010), can reduce matching efficiency.
Following Veracierto (Citation2011) and Şahin et al. (Citation2014), we examine whether or not the outward shift of the Beveridge curve in Austria was caused by mismatch unemployment. We define mismatch unemployment as the difference between the unemployment rate under a stable matching productivity and the steady-state unemployment rate. We first analyse aggregate data at the national level. We use unemployment data from the Austrian unemployment office (AMS) by skill level and regional level. We group 119 specific occupations (ISCO-08) into five categories: manual routine tasks, manual non-routine tasks, analytical non-routine tasks, interactive non-routine tasks and cognitive routine tasks. The regions are the nine Austrian federal states. We combine these data with information from the Austrian Mikrocensus, which contains detailed information about labour market status and transitions by skill level and by region. We then conduct analyses at different levels of disaggregation, by region and skill level, to provide more detailed evidence of the shift in the Beveridge curve.
Labour markets in different regions of a country, but also for different skills, are likely to develop differently. Economic growth, and thus employment growth, can differ greatly by region, but also by skill level. Therefore, an analysis of labour markets at a disaggregate level illustrates potential problems in specific areas of labour markets. The estimation of regional Beveridge curves is widely used in the literature (e.g., Wall & Zoega, Citation2002; for the UK; Kosfeld et al., Citation2008, for Germany; Bouvet, Citation2012; for several European regions; and Valletta, Citation2005, for the United States). We contribute to this literature by analysing the regional Beveridge curves for Austria.
To our knowledge, we are the first to analyse regional labour markets for skills. Wall and Zoega (Citation2002) argue that ‘having regional Beveridge curves allows for an examination of the underlying regional changes driving the shifts of the aggregate Beveridge curve and an estimation of the degree of regional mismatch’ (p. 261). We present estimates of the extent of skill mismatch and regional skill mismatch.
As Autor et al. (Citation2006), Goos and Manning (Citation2007), Goos et al. (Citation2010) and Autor and Dorn (Citation2013) show, the employment share of occupations in the middle of the skill distribution has declined rapidly in the United States and Europe. At the same time, the share of occupations with higher and lower skills has increased significantly. The literature on automation highlights that these jobs often routine tasks that can be relatively easily automated and therefore disappear due to lower labour demand (Autor et al., Citation2003; Michaels et al., Citation2014). Acemoglu et al. (Citation2021) show for the United States that artificial intelligence replaces human workers in various types of tasks, but there is currently no aggregate impact on labour markets. For Austria, however, Hofer et al. (Citation2017) find no evidence of polarization between 1994 and 2015, despite a relative decline in the share of jobs requiring intermediate formal education.
These changes in labour demand have created significant challenges in most developed countries. While demand for certain skills can change quickly, supply-side responses are usually slow, as workers need more time to acquire new skills. Such developments can lead to substantial mismatch and highlight the importance of identifying the reasons for mismatch in the labour market in order to take appropriate policy action.
The reasons for the shifts in the Beveridge curve have been discussed in the literature. It is well documented that a labour supply shock can potentially affect matching in the labour market by changing the skill mix in the (regional) labour market. For example, Kolsrud (Citation2018) finds for Norway that immigrants reduced regional mismatch, as immigrants in Norway tended to supply labour in regions with good employment prospects. However, the author also shows that immigration in Norway tends to increase the skill mismatch. Overall, the positive effect at the regional level slightly dominated the negative effect at the occupational level.Footnote1
Our results show that the outward shift of the Austrian Beveridge curve was primarily caused by a significant increase in mismatch unemployment for manual routine tasks. We find that mismatch unemployment for manual routine tasks increased from approximately 2% to almost 8% between 2013 and 2016. Mismatch unemployment for interactive non-routine tasks also increased, from 1% to 3%. In contrast, we found that mismatch unemployment for other skill groups increased only moderately.
Our analysis also reveals regional differences in the rise of mismatch unemployment, for example, in Vienna the overall increase in mismatch unemployment is the strongest. Overall, however, the results do not suggest that insufficient regional mobility, for example, due to home ownership (Farber, Citation2012), is the reason for the increased mismatch.
THEORETICAL BACKGROUND
Since the pioneering work of Mortensen and Pissarides (Citation1994), economists have attempted to estimate the matching function (e.g., Petrongolo & Pissarides, Citation2001). For an overview of extensions of their original model, see, for example, Faggian (Citation2021). We use Veracierto’s (Citation2011) model in which each firm offers jobs that remain vacant or are filled when a worker accepts an offer. Workers are either employed, unemployed or inactive. Employed workers leave their jobs with probability . (For simplicity, our notation does not distinguish between skills and regions, which are additional dimensions that we consider below.)
Matching between unemployed workers and vacancies is modelled with a standard Cobb–Douglas matching function with constant returns to scale, where the number of new matches, , is a function of the matching efficiency,
, the number of unemployed workers,
, and vacancies,
:
(1)
(1) where
,
, imposes constant returns to scale (Petrongolo & Pissarides, Citation2001).Footnote2
Workers move between three states: unemployment (), employment (
) and inactivity (
). Hazard rates,
, describe the transitions from labour market status
to labour market status
.
is the ratio of workers who move from
to
at time
,
, over the number of workers who were in
at time
,
, for example,
. The job-finding rate is
, and the separation rate is
.
The movement of workers between labour market statuses is described by the following equations:
(2)
(2)
(3)
(3)
(4)
(4)
The steady-state unemployment rate is given by:
(5)
(5) where
and
.
We follow Veracierto (Citation2011) and assume constant transition rates for the period before 2014.Footnote3 We also assume a constant matching productivity for the period before 2014, separately by region and skill levels. We calculate
by using the information on labour market tightness, measured as vacancies per unemployed person, of the month with the strongest and the month with the weakest labour market tightness, separately for each combination of region and skill level (Veracierto, Citation2011, eqn 34).Footnote4 We then use these values to calculate the matching efficiency parameter
that can be expressed as a function of the specific transition rates, unemployment rates and vacancy rates (Veracierto, Citation2011, eqn 33).Footnote5 We obtain hypothetical vacancy rates for the post-2014 period by setting
to the average level of the pre-2014 period,
, conditional on the observed unemployment rate.
We calculate the unemployment rates under the assumption of stable matching productivity for all levels of disaggregation (region, skill level and their interaction). Beveridge curve movements can be caused by several factors, and we follow Barnichon and Figura (Citation2010) to identify the source of Beveridge curve shifts. While changes in the separation rate () cannot be clearly attributed to a supply or demand factor, the attachment of workers to the labour force (inflows and outflows to and from the labour force,
,
,
,
) can be attributed to changes in labour supply. Changes in labour market tightness (matching function,
) are usually due to changes in labour demand. In addition, we identify changes in matching efficiency
by comparing the results based on the estimated matching efficiency with results obtained under the assumption that the matching efficiency after 2014 was the same as in the period 2004–14.
We define the mismatch unemployment rate as the difference between the steady-state unemployment rate,
, and the unemployment rate under a stable matching productivity,
:
(6)
(6) where
is the obtained job-finding rate under the assumption of a constant matching efficiency.Footnote6
The shift of the Austrian Beveridge curve at the national level and the associated increase in unemployment after 2014 is mainly due to a change in matching efficiency, while other factors play only a minor role (Christl, Citation2020). However, it is important to stress that Austria has had a steady inflow of immigrants and migrant workers, especially after the eastern enlargement of the European Union (Schmieder & Weber, Citation2018). This labour supply shock started in May 2011, when nationals from the CESEE-8 countries gained unrestricted access to the Austrian labour market.Footnote7 From January 2014, Bulgarian and Romanian citizens also gained unrestricted access to the labour market. Figure B2 in Appendix B in the supplemental data online shows the increasing share of foreigners in the Austrian labour force by federal state. The increase was particularly strong in Vienna.
DATA AND CALIBRATION
We use data from the Austrian public employment services (PES), from 2004 to 2016, which provide detailed information on the skill levels of the unemployed and the required tasks of advertised vacancies (AMS Österreich, Citation2020). Following Spitz-Oener (Citation2006), we group 119 specific occupations (ISCO-08) into five categories: manual routine tasks, manual non-routine tasks, analytical non-routine tasks, interactive non-routine tasks and cognitive routine tasks. The detailed list of how occupations are classified is given in Table B4 in Appendix B in the supplemental data online.
The data are quarterly data from 2004:Q1 to 2016:Q4 for five skill categories, aggregated to the nine federal states. We use the Austrian Labour Force Survey (LFS) to calculate all transition rates and employment levels by federal state and skill level (e.g., Statistik Austria, Citation2020; Moser, Citation2010). The LFS uses the same occupational classification (ISCO-08) as the Austrian PES. Prior to 2011, the ISCO-88 classification was used, and we convert both classifications to five skill categories, following Bock-Schappelwein et al. (Citation2017). The Austrian LFS has a rotating panel structure that follows workers for five consecutive quarters. This allows us to calculate job-finding rates by skill category and by region.
shows the distribution of unemployment and employment across federal states in Austria. According to PES data, approximately 19.2% of employed persons and 31.9% of unemployed persons were in Vienna. We report the region's share of unemployed persons based on both the number of registered unemployed observed by the PES and the number of the unemployed observed in the LFS which uses the ILO's definition of unemployment. In general, the unemployment shares are fairly similar in both sources, although the unemployment rates differ due to the different definitions of unemployment. For example, according to LFS data the share of unemployed in Vienna is 36% and it is 31.9% according to PES data.
Table 1. Employment and unemployment shares, by federal state.
lists the employment and unemployment shares by skill category, pooled over the sample period. Before 2011, the LFS did not survey skill categories and we cannot compare the unemployment rates of the LFS and the PES data. Of all jobs, approximately 30% were manual non-routine tasks, 22% were interactive non-routine jobs and 19% were cognitive routine tasks. Approximately 15% of jobs were analytical non-routine tasks and 13% of jobs were manual routine tasks.
Table 2. Employment and unemployment, by skill category.
The variation of unemployment shares over skill category during our observation period was greater than for employment shares. Thus, some 15% of the jobs were analytical non-routine tasks, and some 7% of the unemployed had such a job before they became unemployed. Of all jobs, approximately 13% were manual routine tasks, but some 32% of the unemployed had such a job before they became unemployed. The second most common type of job, interactive non-routine tasks (22% of jobs), was held by almost 14% of the unemployed.
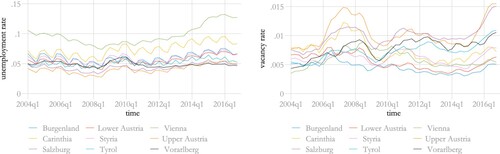
shows the quarterly unemployment rates and vacancy rates by region. While the unemployment rate in Vienna was higher than in other regions throughout the observation period, we observe an increase from the lowest value of around 8% in 2008 to almost 13% in 2016. The unemployment rate also increased in other regions such as Upper Austria, Salzburg and Tyrol, but less strongly. The vacancy rate, in contrast, has risen in most regions, with a particularly strong increase in Upper Austria and Salzburg.
Figure 1. Unemployment rates and vacancy rates, by region.
Note: Quarterly data, 2004–16.
Source: Statistik Austria (Citation2020).
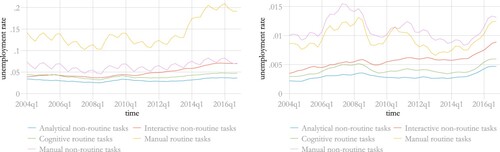
shows the unemployment rates and job vacancy rates by skill category. The unemployment rate for manual routine tasks has increased significantly from around 2013. We also observe a moderate increase in unemployment rates for interactive non-routine tasks. Unemployment rates for the other skill categories remained relatively stable over this period. However, vacancy rates increased for all skill categories, especially for manual routine tasks and manual non-routine tasks.
Figure 2. Unemployment rates and vacancy rates, by skill category.
Note: Quarterly data, 2004–16.
Source: Statistik Austria (Citation2020).
There were also considerable differences in the unemployment rate between the regions and the skill categories. For example, the unemployment rate in Vienna was 9.8% and in Upper Austria slightly over 4%. We also observe differences by skill category, for example, the unemployment rate for analytical non-routine workers was 3.1% and it was 14.1% for manual routine workers.
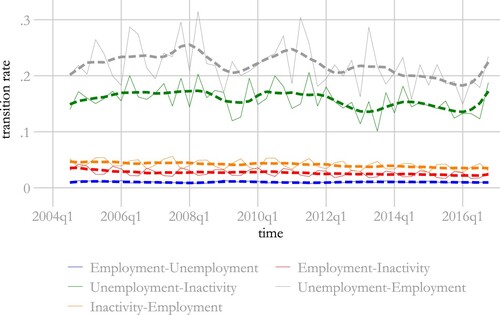
The transition rates between the different labour market statuses at the aggregate level, which are shown in , changed only slightly over this period. During the 2008 financial crisis, the transition rate from unemployment to employment dropped significantly. Factors related to labour supply shocks that determine the position of the Beveridge curve, such as entries and exits into and out of the labour force, were also relatively stable. Only the transition rate from unemployment to inactivity declined slightly after 2012.
Figure 3. Transition rates between labour market statuses, Austria, 2004–16.
Note: Calculations are based on quarterly data from 2004 to 2016.
Source: Statistik Austria (Citation2020).
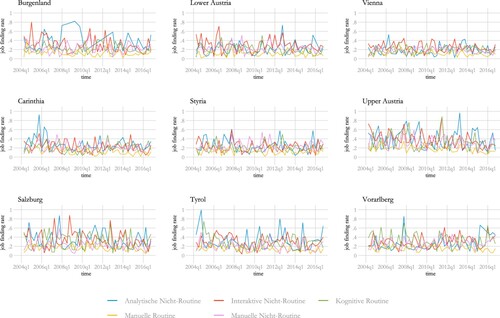
Matching efficiency, that is, the productivity of the process of matching jobseekers with available jobs, determines the job-finding rate. We provide a detailed overview on the job-finding rate and plot it by skill category and region in . It highlights regional but also skill-specific differences. The average job-finding rate was lowest for manual routine work (13.1%) and greatest for interactive non-routine workers (27.9%). The average placement rate was lowest for manual routine work (13.1%) and highest for non-routine interactive work (27.9%). There were also significant regional differences. For example, the average placement rate in Upper Austria was 28.0% and in Vienna only 18.3%. Detailed summary statistics by region and skill categories are presented in the Tables B1 and B2 in Appendix B in the supplemental data online.
Figure 4. Job-finding rates, by region and skill category.
Note: Calculations are based on quarterly data from 2004 to 2016. ISCO-08 occupations are grouped as manual routine tasks, manual non-routine tasks, analytical non-routine tasks, interactive non-routine task and cognitive routine tasks (see Table B4 in Appendix B in the supplemental data online for details).
Source: Statistik Austria (Citation2020).
RESULTS
Results based on aggregated data for Austria
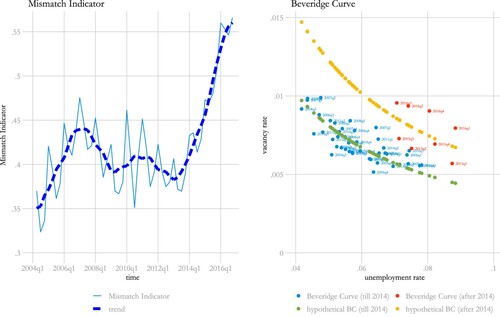
shows the estimated mismatch indicator (left) and the resulting Beveridge curves (right) based on aggregated quarterly data from 2004 to 2016. The mismatch indicator, measured as 1 minus the matching efficiency , suggests a significant increase in mismatch after 2014. To illustrate the impact of increased mismatch, we divide the sample into two periods, pre- and post-2014, and plot the Beveridge curves for the period before 2014 (blue dots) and for the quarters after 2014 (red dots). The predicted Beveridge curve, calibrated with data from 2004 to 2014, is plotted in green. The predicted Beveridge curve calibrated with data from 2014 to 2016 is shown in yellow. The distance between the post-2014 labour market outcomes (red dots) and the predicted Beveridge curve (yellow) suggests a deterioration of the matching efficiency, highlighted by the increase in the mismatch indicator (left).
Figure 5. Mismatch indicator and Beveridge curves, aggregated data for Austria, 2004–16.
Note: The trend was obtained by local linear smoothing. The hypothetical Beveridge curves are estimated with the average matching efficiency before 2014 and after 2014.
Sources: Calculations based on data from Statistik Austria (Citation2020); and AMS Österreich (Citation2020).
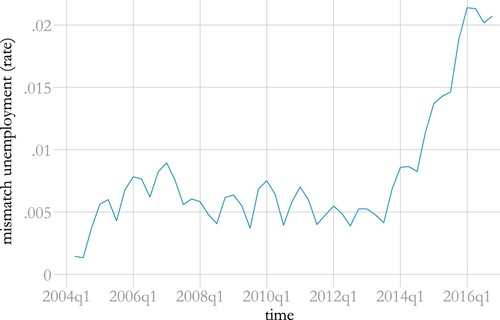
In a first step, we predict the unemployment rate based on a model where we allow the matching efficiency to change over time, using the observed matching efficiency.Footnote8 We also predict the unemployment rate assuming that the matching efficiency is constant at the average level of the pre-2014 period.Footnote9 We calculate the mismatch unemployment rate as the difference between the two predicted unemployment rates. plots the predicted mismatch unemployment rate and we observe a strong increase after 2014. In 2016, the observed unemployment rate was above 7%, while the unemployment rate under stable matching would have been close to 5%, suggesting a mismatch unemployment of more than 2 percentage points. The mismatch unemployment in 2016 exceeds all other values in this period.
Figure 6. Mismatch unemployment, aggregated data for Austria, 2004–16.
Note: Mismatch unemployment is the difference between the unemployment rate under a stable matching productivity and the steady-state unemployment rate.
Results by federal state
Increased mismatch could result from divergent development of Austrian regions, from supply shocks or from changes in matching productivity. We repeat our analyses and estimate Beveridge curves for all nine federal states. Figure B4 in Appendix B in the supplemental data online shows the resulting mismatch indicators. For most states, we observe an increased in mismatch after 2014. In Burgenland, Carinthia and Vorarlberg mismatch was stable over time, while in Tyrol and Salzburg it increased over the whole period. Only in Lower Austria, Styria, Upper Austria and Vienna do we find a marked increase after 2014. These changes in mismatch efficiency over time are reflected in the predicted Beveridge curves in Figure B5 in Appendix B online. We find substantial shifts in the Beveridge curves after 2014, especially in Salzburg, Tyrol, Upper Austria and Vienna.
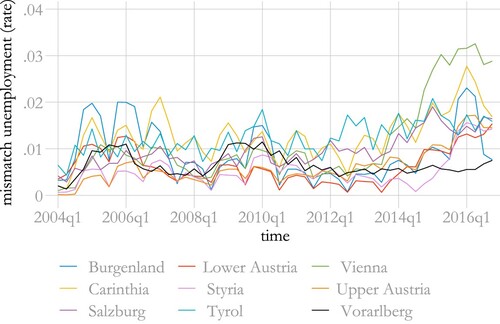
We estimate the regional mismatch unemployment rates (). The comparison of the regional mismatch unemployment rates shows the particularly strong increase in Vienna, where the mismatch unemployment rose to 3% after 2014. In most other regions, we also find an increase in mismatch unemployment, albeit at a lower level. Only in Vorarlberg and Tyrol did the mismatch unemployment rate remain stable during this period.
Figure 7. Mismatch unemployment, by region.
Note: Mismatch unemployment is the difference between the unemployment rate under a stable matching productivity and the steady-state unemployment rate.
Results by skill level
Labour markets differ in their supply of and demand for different skills. We see substantial regional differences in unemployment rates and vacancy rates by skill category. Job-finding rates may also differ substantially. Figure B7 in Appendix B in the supplemental data online shows the evolution of the mismatch indicator over time by skill category. Mismatch has increased particularly for manual routine tasks and to some extent for routine cognitive tasks and analytical non-routine tasks after 2014.
These differences correspond to shifts in the estimated Beveridge curves, with the shift being particularly pronounced for manual routine tasks. The different skill categories have developed differently in recent years. In particular, we find a substantial increase in the unemployment rate and a stable vacancy rate for manual routine tasks, where unemployment tends to be higher than for other skill types.
This points to an increasing polarization of the labour market caused by an increased mismatch between skill supply and demand for manual routine tasks. In contrast, we find stable unemployment rates and a substantial increase in vacancy rates for routine cognitive tasks. We interpret this as evidence of a shortage of this specific skill type, with few workers available to fill vacancies.
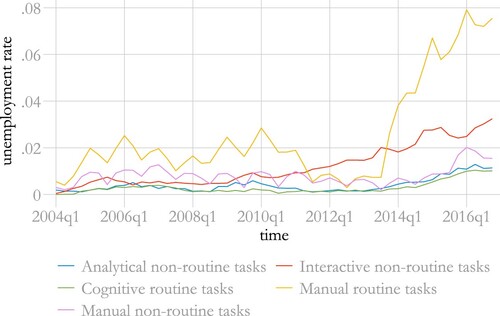
We plot the resulting mismatch unemployment rates in . Although mismatch unemployment was greater for manual routine jobs than for other skill categories prior to 2011, it increased after 2014 to almost 8% in 2016. While we also observe an increase in mismatch unemployment for other skill categories after 2014, the increase is much more pronounced for manual routine jobs. It seems that the rise in mismatch unemployment for interactive non-routine tasks started as early as 2010 and increased steadily thereafter.
Figure 8. Mismatch unemployment, by skill level.
Note: Mismatch unemployment is the difference between the unemployment rate under a stable matching productivity and the steady-state unemployment rate.
Results by skill level and federal state
If we assume that each skill type has its own labour market in each region, we can repeat the analysis for the resulting 45 different labour markets. Caution is needed when interpreting the results, as at least for neighbouring regions or similar skill types, some markets are clearly connected. In addition, some of these labour markets are small, which leads to considerable uncertainty due to the sample size of the LFS.
Figure B10 in Appendix B in the supplemental data online shows the Beveridge curves for analytical non-routine tasks for each of the nine regions. With the exception of Upper Austria and Salzburg, we find no shifts in these Beveridge curves. From this we conclude that mismatch for analytical non-routine tasks is a minor problem in the Austrian labour market.
The Beveridge curves for interactive non-routine jobs shown in Figure B11 in Appendix B in the supplemental data online, on the other hand, show considerable shifts in all provinces. It is striking that, with the exception of Vienna and Carinthia, the shifts are mainly caused by increased vacancy rates – recognizable by the red dots indicating a relatively higher vacancy rate at an unchanged unemployment rate. This indicates an increased demand for interactive non-routine jobs, especially in Upper Austria, Salzburg and Vorarlberg.
The Beveridge curves for cognitive routine tasks, shown in Figure B12 in Appendix B in the supplemental data online, reveal shifts only in Styria, Upper Austria and Salzburg. The shifts seem to be more due to supply-side factors, as the unemployment rate is relatively more stable than the vacancy rate.
The Beveridge curves for manual routine jobs, shown in Figure B13 in Appendix B in the supplemental data online, shift outwards in all regions except Upper Austria. These shifts, in contrast to the shifts for cognitive routine tasks, are caused by an increase in unemployment rates and not by higher vacancy rates. This can be seen in the red dots, which indicate higher unemployment rates at a constant vacancy rate. This indicates that the demand for manual routine tasks has decreased over time, which means that unemployed workers with manual routine skills will find it difficult to find employment.
The Beveridge curves for manual non-routine tasks (see Figure B14 in Appendix B in the supplemental data online) are quite stable, and only in a few regions are there minor outward shifts. In contrast to the manual routine tasks, we find no substantial changes in matching efficiency for the manual non-routine tasks.
shows the estimated mismatch unemployment by region and skill type. The graphs show substantial differences by skill type and region. In particular, mismatch unemployment increased in all regions except Vorarlberg. Mismatch unemployment increased most noticeably in Vienna, where we estimate an increase for manual routine tasks and interactive non-routine tasks. While the increase in mismatch unemployment is most pronounced in Vienna, we estimate an increase in mismatch unemployment for analytical non-routine tasks also in the other regions, but at a more moderate level.
Figure 9. Mismatch unemployment, by region and skill level.
Note: Mismatch unemployment is the difference between the unemployment rate under a stable matching productivity and the steady-state unemployment rate.
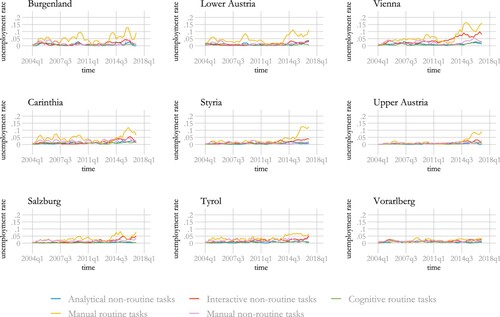
The overall increase in mismatch unemployment for interactive non-routine jobs that we have seen before seems to be mainly driven by the development in Vienna, where the increase is particularly strong with almost 10% mismatch unemployment in 2016. There is no strong increase in mismatch unemployment for the other skill types, although there are smaller upward movements for manual non-routine jobs in Salzburg, Upper Austria, Lower Austria and Tyrol towards the end of the period.
CONCLUSIONS
We analyse the Austrian Beveridge curve shift that took place after 2014. We combine detailed vacancy data from the Public Employment Office (AMS) with data from the Austrian Labour Force Survey (LFS), which allow us to estimate labour market flows at a disaggregated level. Using these data, we analyse the labour market by region and skill levels. Following the approach of Veracierto (Citation2011), we estimate Beveridge curves for Austria. Additionally, we calculate the mismatch unemployment corresponding to each of the disaggregated dimensions.
We find a substantial increase in mismatch unemployment in Austria after 2014 from around 0.5% to over 2%. Second, when we focus on regional mismatch unemployment, we see an increase in most of Austrian regions after 2014. The increase was especially strong in Vienna where mismatch unemployment rose from 1% to over 3%. Third, we find a particularly strong increase in mismatch unemployment for one specific skill group: manual routine tasks. Mismatch unemployment rose from levels between 1% and 2% before 2014 to almost 8%.
Our analysis confirms that a decline in matching efficiency after 2014 led to a shift in the Beveridge curve. Figure B15 in Appendix B in the supplemental data online shows a positive correlation between mismatch unemployment and the share of foreigners in some regional labour markets, especially in Vienna. This could be seen as evidence that the inflow of immigrants related to the enlargement of the European Union may have changed the skill mix in regional labour markets and reduced matching efficiency. Our results suggest that the shift in the Beveridge curve is due to an increase in mismatch unemployment, which could also be related to the increase in the share of immigrants in the Austrian labour force.
From a policy perspective, it is important to distinguish between shifts in the Beveridge curve due to changes in demand or supply and those due to changes in matching efficiency. Shifts due to labour supply shocks are usually not permanent, while changes in matching efficiency are usually permanent.
We identify in detail the mismatch unemployment at the regional level and for different skill groups. This can help policymakers target measures to the specific labour markets that have severe mismatch problems. Upskilling the labour force or increasing mobility between regions (e.g., through stronger financial incentives to find a job in another region) could be attractive policy options to improve labour markets.
Although our analysis is based on the most detailed data currently available for Austria, our empirical approach is nevertheless limited. First, we cannot account for job-to-job transitions, and as Elsby et al. (Citation2015) point out, these transitions could affect the dynamics of the Beveridge curve in several ways. For example, an increase in employed searchers may lead to a crowding out of the employment prospects of unemployed searchers. We also assume free entry, but as Elsby et al. note, ‘some deviation from free entry’ would perhaps more accurately capture the dynamics of the Beveridge curve. An increase in long-distance commuting could lead us to conclude that the Beveridge curve is shifting outwards in the regions where commuters live. However, the survey data on commuting do not suggest that commuting has changed drastically over this period. In 2009, for example, some 13% of all employed persons in Austria commuted to another province or abroad; in 2016, it was 13.4% of all employed persons (Statistics Austria, Citation2022).
Furthermore, it is not possible with our approach to identify all potential causes of mismatch separately. However, following Şahin et al. (Citation2014), we argue that the analysis of different levels of disaggregation is informative for the policy perspective, for example, whether the PES should require the unemployed to accept jobs that are far from their place of residence or whether it should focus more on training the unemployed.
Supplemental Material
Download PDF (1.5 MB)ACKNOWLEDGEMENT
We are grateful to Veronika Murauer (AMS Austria) for her patient support with the preparation of the data. An earlier version of this research was circulated as Böheim and Christl (Citation2021).
DISCLOSURE STATEMENT
No potential conflict of interest was reported by the authors.
Notes
1 Similarly, Crawley et al. (Citation2021) argue that migration flows affect the skill mix in the labour market, and show that the decline in matching efficiency in New Zealand is related to migration patterns in New Zealand, suggesting that net out-migration of predominantly high-skilled workers has significantly reduced matching efficiency. Furthermore, Jonsson and Theobald (Citation2019) argue that the high levels of immigration in the period 2015–16 in Sweden have negatively affected matching efficiency.
2 Kohlbrecher et al. (Citation2016) argue that there is widespread empirical evidence for Cobb–Douglas matching functions with constant returns across countries.
3 See also Barlevy (Citation2011) for related work.
4 The estimated values are shown in Table B3 in Appendix B in the supplemental data online.
5 For a general discussion on estimating matching efficiencies, see, for example, Crawley et al. (Citation2021).
6 We fix the matching efficiency to the average level of the period before 2014.
7 The CESEE-8 countries are the Czech Republic, Estonia, Hungary, Latvia, Lithuania, Poland, Slovakia and Slovenia.
8 The predictions are plotted in Figures B3, B6 and B9 in Appendix B in the supplemental data online.
9 As a robustness check, we follow Veracierto (Citation2011) who estimates the matching function directly using OLS to account for potential fluctuations in the transition rate. The results are presented in Appendix A, Figures A.1, A.2, and A.3 in the supplemental data online. These results differ only slightly from our main results and we conclude that the main results are not caused by the assumption of a constant transition rate.
REFERENCES
- Acemoglu, D., Autor, D., Hazell, J., & Restrepo, P. (2021). AI and jobs: Evidence from online vacancies. NBER working paper 28257.
- AMS Österreich. (2020). Arbeitsmarktdaten online. Data at http://iambweb.ams.or.at/ambweb/.
- Autor, D. H., & Dorn, D. (2013). The growth of low-skill service jobs and the polarization of the US labor market. American Economic Review, 103(5), 1553–1597. https://doi.org/10.1257/aer.103.5.1553
- Autor, D. H., Katz, L. F., & Kearney, M. S. (2006). The polarization of the US labor market. American Economic Review, 96(2), 189–194. https://doi.org/10.1257/000282806777212620
- Autor, D. H., Levy, F., & Murnane, R. J. (2003). The skill content of recent technological change: An empirical exploration. The Quarterly Journal of Economics, 118(4), 1279–1333. https://doi.org/10.1162/003355303322552801
- Barlevy, G. (2011). Evaluating the role of labor market mismatch in rising unemployment. Economic Perspectives, 35(3), 82–96.
- Barnichon, R., & Figura, A. (2010). What drives movements in the unemployment rate? A decomposition of the Beveridge curve. FEDS Finance and Economics Discussion Series 2010-48.
- Bock-Schappelwein, J., Famira-Mühlberger, U., & Leoni, T. (2017). Arbeitsmarktchancen durch Digitalisierung. WIFO Studies 60909.
- Böheim, R., & Christl, M. (2021). Mismatch unemployment in Austria: The role of regional labour markets for skills, Working Papers on labour, education and technology 2021–08. Joint Research Centre.
- Bouvet, F. (2012). The Beveridge curve in Europe: New evidence using national and regional data. Applied Economics, 44(27), 3585–3604. https://doi.org/10.1080/00036846.2011.579062
- Christl, M. (2020). A Beveridge curve decomposition for Austria: Did the liberalisation of the Austrian labour market shift the Beveridge curve? Journal for Labour Market Research, 54(1), 1–15. https://doi.org/10.1186/s12651-020-00271-z
- Christl, M., Köppl-Turyna, M., & Kucsera, D. (2016). Structural unemployment after the crisis in Austria. IZA Journal of European Labor Studies, 5(1), 12. https://doi.org/10.1186/s40174-016-0062-5
- Crawley, A., Welch, S., & Yung, J. (2021). Improving estimates of job matching efficiency with different measures of unemployment. Journal of Macroeconomics, 67, 103282. https://doi.org/10.1016/j.jmacro.2020.103282
- Elsby, M. W., Michaels, R., & Ratner, D. (2015). The Beveridge curve: A survey. Journal of Economic Literature, 53(3), 571–630. https://doi.org/10.1257/jel.53.3.571
- Faggian, A. (2021). Job search theory. In M. M. Fischer & P. Nijkamp (Eds.), Handbook of regional science (pp. 481–495). Springer. https://doi.org/10.1007/978-3-662-60723-7_8
- Farber, H. S. (2012). Unemployment in the Great Recession: Did the housing market crisis prevent the unemployed from moving to take jobs? American Economic Review, 102(3), 520–525. https://doi.org/10.1257/aer.102.3.520
- Goos, M., & Manning, A. (2007). Lousy and lovely jobs: The rising polarization of work in Britain. Review of Economics and Statistics, 89(1), 118–133. https://doi.org/10.1162/rest.89.1.118
- Goos, M., Manning, A., & Salomons, A. (2010). Explaining job polarization in Europe: The roles of technology, globalization and institutions. CEP Discussion Papers 1026.
- Hofer, H., Titelbach, G., & Vogtenhuber, S. (2017). Polarisierung am österreichischen arbeitsmarkt. Wirtschaft und Gesellschaft, 43(3), 379–404.
- Jonsson, M., & Theobald, E. (2019). A changed labour market – effects on prices and wages, the Phillips curve and the Beveridge curve. Sveriges Riksbank Economic Review 1.
- Klinger, S., & Weber, E. (2016). Decomposing Beveridge curve dynamics by correlated unobserved components. Oxford Bulletin of Economics and Statistics, 78(6), 877–894. https://doi.org/10.1111/obes.12135
- Kohlbrecher, B., Merkl, C., & Nordmeier, D. (2016). Revisiting the matching function. Journal of Economic Dynamics and Control, 69, 350–374. https://doi.org/10.1016/j.jedc.2016.05.018
- Kolsrud, D. (2018). Mismatch in the Norwegian labour market 2003–2013: Did immigrants make a difference? Social Indicators Research, 137(3), 979–997. https://doi.org/10.1007/s11205-017-1628-y
- Kosfeld, R., Dreger, C., & Eckey, H.-F. (2008). On the stability of the German Beveridge curve: A spatial econometric perspective. The Annals of Regional Science, 42(4), 967–986. https://doi.org/10.1007/s00168-007-0190-y
- Manacorda, M., & Petrongolo, B. (2006). Regional mismatch and unemployment: Theory and evidence from Italy, 1977–1998. Journal of Population Economics, 19(1), 137–162. https://doi.org/10.1007/s00148-005-0001-7
- Michaels, G., Natraj, A., & Van Reenen, J. (2014). Has ICT polarized skill demand? Evidence from eleven countries over twenty-five years. Review of Economics and Statistics, 96(1), 60–77. https://doi.org/10.1162/REST_a_00366
- Mortensen, D. T., & Pissarides, C. A. (1994). Job creation and job destruction in the theory of unemployment. The Review of Economic Studies, 61(3), 397–415. https://doi.org/10.2307/2297896
- Moser, C. (2010). Daten zur Erwerbstätigkeit in der Mikrozensus-Arbeitskräfteerhebung. Austrian Journal of Statistics, 39(1&2), 117–125. https://doi.org/10.17713/ajs.v39i1&2.238
- Petrongolo, B., & Pissarides, C. A. (2001). Looking into the black box: A survey of the matching function. Journal of Economic Literature, 39(2), 390–431. https://doi.org/10.1257/jel.39.2.390
- Şahin, A., Song, J., Topa, G., & Violante, G. L. (2014). Mismatch unemployment. American Economic Review, 104(11), 3529–3564. https://doi.org/10.1257/aer.104.11.3529
- Schiman, S. (2021). Labor supply shocks and the Beveridge curve: Empirical evidence from EU enlargement. Review of Economic Dynamics, 40, 108–127. https://doi.org/10.1016/j.red.2020.09.005
- Schmieder, J., & Weber, A. (2018). How did EU eastern enlargement affect migrant labor supply in Austria? Focus on European Economic Integration, Q3/18, 113–121.
- Spitz-Oener, A. (2006). Technical change, job tasks, and rising educational demands: Looking outside the wage structure. Journal of Labor Economics, 24(2), 235–270. https://doi.org/10.1086/499972
- Statistics Austria. (2022). Economically active persons 2009 to 2019 by the category of distance. Data at https://www.statistik.at/web_en/statistics/PeopleSociety/population/population_censuses_register_based_census_register_based_labour_market_statistics/commuters/index.html (accessed: 18/1/2022).
- Statistik Austria. (2020). Mikrozensus-Arbeitskräfteerhebung. Data at https://www.statistik.at/web_de/services/mikrodaten_fuer_forschung_und_lehre/datenangebot/standardisierte_datensaetze_sds/index.html#index3.
- Valletta, R. G. (2005). Why has the US Beveridge curve shifted back? New evidence using regional data, Technical report, Federal Reserve Bank of San Francisco Working paper 2005 25.
- Valletta, R. G., & Kuang, K. (2010). Extended unemployment and UI benefits. Federal Reserve Bank of San Francisco Economic Letter 2010-12.
- Veracierto, M. (2011). Worker flows and matching efficiency. Economic Perspectives, 35(4), 147–169.
- Wall, H. J., & Zoega, G. (2002). The British Beveridge curve: A tale of ten regions. Oxford Bulletin of Economics and Statistics, 64(3), 257–276. https://doi.org/10.1111/1468-0084.00019