
ABSTRACT
This graphic uses cartogram analysis to demonstrate how Covid-19 affects high-speed rail (HSR) and air networks in China. During the first round of the Covid-19 outbreak, intercity transportation networks significantly decreased their service. However, the supply of transport hubs was retained to ensure basic service coverage and efficiency. Conversely, air transportation was affected more than HSR networks. The average number of daily flights declined to 19% of the original traffic, while high-speed trains maintained their original 64%. This disparity is explained by the owners and operation of the two transportation networks and their different roles in intercity connections.
JEL CLASSIFICATIONS:
High-speed railway (HSR) and air networks in China have experienced rapid development (Wang et al., Citation2020). During the Covid-19 pandemic there were many risks associated with human movement in intercity transportation networks, and this paper demonstrates how their supply was affected during the Covid-19 outbreak. The epidemic was first reported in Wuhan, a hub city located in Central China, resulting in a high risk of transmission. Control measures were implemented that included urban lockdowns and intercity connection blocks. Consequently, HSR and airline companies employed adaptive scheduling (for data, see Appendix 1 in the supplemental data online).
The method used in this study – cartograms – refers to a mapping technique where geographical size is transformed proportionally to a selected variable (Batty, Citation2013) (see Appendix 2 in the supplemental data online). A horizontal comparison reveals that spatial disparity existed in the supply of HSR and air networks before and during Covid-19 (). The air network presented a more obvious hub-and-spoke structure, while the HSR network provided relatively balanced services. The coefficient of variation for flights at the city level was 2.71, while that of high-speed trains (HST) was 1.51. This tendency was strengthened during Covid-19. A vertical comparison reveals that air transportation was affected more than HSR networks in general. The average daily flights declined to the original 19%, while HSTs maintained 64%.
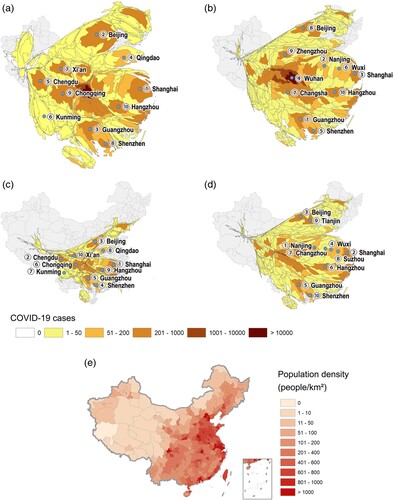
Figure 1. Cartogram of intercity transportation networks: (a) Air network before Covid-19 (14 February 2019); (b) the HSR network before Covid-19 (2019); (c) the air network during Covid-19 (14 February 2020); (d) the HSR network during Covid-19 (14 February 2020); and (e) population density.
Note: The number of flights from/to cities (a, c) and the daily average number of high-speed trains (HSTs) in 2019 (b, d) are shown. The top 10 cities are labelled by flights/HSTs. Cumulative confirmed Covid-19 cases denote those between 31 December 2019 and 14 February 2020. The population density in 2019 is displayed in (e).
Overall, the geometries of cities with more confirmed cases were significantly diminished. This indicates that the primary goal of service reduction in intercity transportation networks was to control the outbreak of the epidemic. Moreover, the degrees of service reduction by both HSR and air were different, which can be explained by their owners and management. The HSTs were operated by the China Railway Corporation (CRC), a state-owned corporation, while flights were operated by private airline companies. During Covid-19, the even distribution of HSTs and its state-oriented operation largely remained resilient. However, air networks retained resilience through hub airports, because they maintained as many flights as possible. In such cases, the air network can recover its original service once the epidemic is under control.
In the graphics, we found that airline companies experienced greater market reduction during Covid-19, while HSR tended to ensure basic service across the country. The policy implication is that the different roles for HSR and air networks should be emphasized in intercity connections.
Supplemental Material
Download PDF (123 KB)DISCLOSURE STATEMENT
No potential conflict of interest was reported by the authors.
Additional information
Funding
REFERENCES
- Batty, M. (2013). The new science of cities. MIT Press.
- Wang, J., Huang, J., & Jing, Y. (2020). Competition between high-speed trains and air travel in China: From a spatial to spatiotemporal perspective. Transportation Research Part A: Policy and Practice, 133, 62–78. doi: 10.1016/j.tra.2019.12.030