
 ?Mathematical formulae have been encoded as MathML and are displayed in this HTML version using MathJax in order to improve their display. Uncheck the box to turn MathJax off. This feature requires Javascript. Click on a formula to zoom.
ABSTRACT
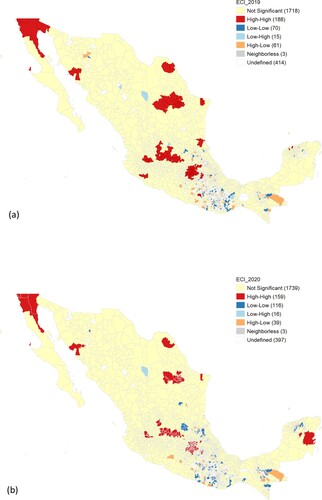
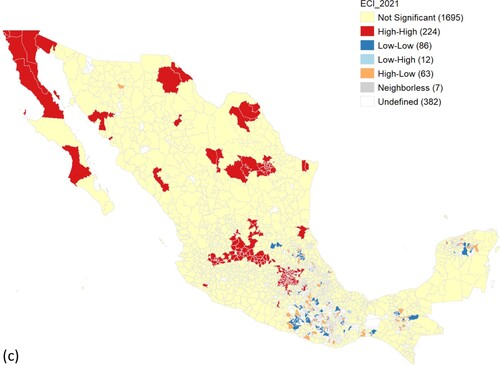
In response to the SARS-CoV-2 outbreak, the Mexican government implemented lockdown and business closure measures to minimize the spread of the disease. This graphic shows whether under those measures the clusters of economic complexity – a measure of the diversification of economic activities, particularly those that are highly sophisticated – have changed relative to the period before the Covid-19 pandemic. The visualization shows a notable reduction in economic complexity clusters during 2020 and a rapid increase in 2021.
In response to the SARS-CoV-2 outbreak, the Mexican government imposed strict measures to minimize the spread of the novel coronavirus. On 31 March 2020, the Health Minister implemented a strict lockdown and business closure initially designated to last until 30 April 2020. Ultimately, those measures were in place until 30 May 2020. As a result, the only activities allowed to operate were those deemed to be essential for the functioning of the economy: agriculture, energy, water provision, food and non-alcoholic beverages, food sales, telecommunications, transport, logistics and financial services, among a few others related to health services. Evidence for the European Union suggests that countries more diversified in sophisticated activities fared comparatively better than others facing the impacts of the Covid-19 (Hausmann et al., Citation2021). The pandemic, and its subsequent impacts, may have profoundly affected the spatial association of economic activity.
We use permanent employment data from the Mexican Institute for Social Security (IMSS, in Spanish) at the municipality level,Footnote1 available for 276 economic activities during the 2019–21 period. The data, however, have some limitations. For example, employment information is missing for some municipalities, particularly for the State of Oaxaca. And the IMSS reports formal employment at the municipality level, except for Mexico City. Therefore, we must consider Mexico City as a whole. Following Hidalgo and Hausmann (Citation2009), we calculate for each municipality the employment-based economic complexity index (ECI), a summary measure of the number of economic activities in which a location specializes, particularly those that are highly sophisticated.Footnote2 We obtain a binary matrix , containing 1 if a location
engages in activity
, and 0 otherwise. From this matrix, diversity is obtained by summing each row,
; ubiquity, by summing each column,
. Diversity is the first approximation to a location’s economic complexity. The ECI is a refined measure of diversity that also considers the ubiquity dimension (for more details, see Hidalgo & Hausmann, Citation2009).
We rely on local indicators of spatial association (LISA) (Anselin, Citation1995) to unveil economic complexity clusters through GeoDa. shows the resulting clusters in 2019, 2020 and 2021. In 2019, before the Covid-19 pandemic, the high–high economic complexity clusters were mainly located in the north and centre of the country. In part, this trend reflects the distribution of the automotive industry zones and the proximity of these municipalities to the border with the United States. However, in 2020, the size of those high–high economic complexity clusters sharply decreased relative to the year before the SARS-CoV-2 outbreak, while the size of low–low clusters increased along with the entire country. In 2021, the second year of the Covid-19 pandemic, there was a relatively rapid recovery in the size of high–high economic complexity clusters. This size is even larger than the period before the SARS-CoV-2 outbreak. While the size of the low–low clusters sharply decreased. From a spatial perspective, these results suggest that the municipalities in the north and centre of Mexico have recovered or even exceeded their economic specialization relative to the severe initial impacts of the Covid-19 pandemic.
Figure 1. Impact of Covid-19 on clusters of economic complexity: (a) spatial association of economic complexity before the SARS-CoV-2 outbreak; (b) spatial association of economic complexity in 2020; and (c) spatial association of economic complexity in 2021.
DISCLOSURE STATEMENT
No potential conflict of interest was reported by the author(s).
Notes
1 The municipality is the first-level governmental unit of legal, social, territorial and economic affairs, equivalent to a district.
2 We rely on the ‘economiccomplexity’ package in R to calculate the ECI.
REFERENCES
- Anselin, L. (1995). Local indicators of spatial association – LISA. Geographical Analysis, 27(2), 93–115. https://doi.org/10.1111/j.1538-4632.1995.tb00338.x
- Hausmann, R., Santos, M. A., Macchiarelli, C., & Giacon, R. (2021). What economic complexity theory can tell us about the EU’s pandemic recovery and resilience plans. Growth Lab/European Politics and Policy. http://www.tinyurl.com/ygrubx59
- Hidalgo, C. A., & Hausmann, R. (2009). The building blocks of economic complexity. Proceedings of the National Academy of Sciences, 106(26), 10570–10575. https://doi.org/10.1073/pnas.0900943106