
 ?Mathematical formulae have been encoded as MathML and are displayed in this HTML version using MathJax in order to improve their display. Uncheck the box to turn MathJax off. This feature requires Javascript. Click on a formula to zoom.
ABSTRACT
This paper investigates divergences in levels of affective polarization across Belgian regions around the 2019 elections. Elaborating on the relative deprivation theory, we analyse the role of current and long-term socio-economic regional inequalities and of geographical distance separating regions. Empirically, we aggregate individual-level measures of affective polarization at the Belgian NUTS-3 level and use a gravity approach to explore the determinants of regional divergences. Our results show that regional variations in affective polarization are best explained by a current rural–urban divide and by how regions have performed economically in the last years. We also show that geographical proximity matters and reinforces the effects of economic deprivation.
1. INTRODUCTION
Several political events have recently occurred throughout Europe, such as Brexit and the electoral success of populist radical parties. Belgium does not make exception to that, with 2019 elections that have seen the unprecedent success of parties located on the extremes of the political spectrum. These events have been increasingly linked to growing levels of affective polarization in advanced democracies, that is, the tendency among party supporters (the in-party group) to increasingly dislike or resent supporters of other parties (the out-party group) (Iyengar et al., Citation2012).
Political disagreement and a certain level of ideological polarization is normal in representative democracies. However, affective polarization was shown to negatively affect the way a political system works through different channels. It increases emotional reactivity and creates biases in perception of party competition (Dalton, Citation2008; Mason, Citation2016; Ward & Tavits, Citation2019). It pushes voters to adopt protest behaviours in the form of abstention or mobilization for radical parties (Abramowitz & Saunders, Citation2008; Bourdin & Tai1, Citation2021; Dalton, Citation2008; Immerzeel & Pickup, Citation2015). It decreases satisfaction with democracy (Oscarsson & Holmberg, Citation2020) and political trust amongst voters – especially when the opposing party is in charge (Hetherington & Rudolph, Citation2015). It affects how voters evaluate policies and assess the economy (Oscarsson & Holmberg, Citation2020). It also reduces the incentives to cooperate and compromise at the elite level and increases the risks of gridlock, especially in multiparty systems where coalition government is the rule. Finally, it has spillover effects outside politics to life choices (Iyengar & Westwood, Citation2015), where it stimulates discriminatory behaviours in private relationships (Huber & Malhotra, Citation2017), friendships and everyday interactions (Iyengar et al., Citation2019); but it also affects economic interactions and the labour market, for instance, in job recruitment processes (Iyengar et al., Citation2012; McConnell et al., Citation2018).
The rise of affective polarization and its potentially serious consequences call for a better understanding of its drivers. Even though the interest for the dynamics driving affective polarization is growing fast, the attention of scholars has mainly been directed to variations of affective polarization across countries or over time using country comparisons or to single-country case studies. So far, within-country variations between different regions remain unexplored. This is surprising as many recent studies show that political attitudes and voting patterns vary heavily across regions (e.g., Broz et al., Citation2021; Greve et al., Citation2021; Iammarino et al., Citation2019; McCann, Citation2020; McKay, Citation2019; Rodden, Citation2019; Rodriguez-Pose, Citation2020; Stockemer, Citation2017; Van Hauwaert et al., Citation2019).
This paper fills this gap by investigating (1) whether we find empirical support for regional variations in levels of affective polarization, and (2) if so, what are the drivers of these divergent patterns of affective polarization across regions. We start by reviewing the existing literature on affective polarization, stressing the interest of a regional approach to the topic. We then lay out our theoretical expectations, connecting the literature on affective polarization to regional studies in an innovating way. Theoretically, we contend that regional socio-economic performance – both current and long-term changes – drives patterns of affective polarization. Moreover, in line with the relative deprivation hypothesis, we sustain that it is not only the performance of regions per se that matters, but also the one of a region compared with others. We also argue that geographical distance between regions acts both as a direct and as a moderating factor, with proximity strengthening divergent patterns. Empirically, we test these expectations by looking at the case of Belgium, an ideal-typical case of multipartyism. By aggregating individual-level data at Belgian NUTS-3 level, and comparing pairs of regions via a gravity model, we confirm that Belgium is characterized by large regional variations in levels of affective polarization. We then explore the role of regional socio-economic inequalities and geographical distance as drivers of such heterogeneity.
Our results show that diverging patterns of affective polarization across regions are best explained by how regions have performed economically in last years and by a rural–urban divide. Furthermore, we show how geographical proximity matters and reinforces the effects of economic deprivation.
These findings point to the added value of a regional approach to the study of affective polarization and its drivers. It deconstructs the implicit assumption that affective polarization is homogeneously distributed within countries. It also allows us to go beyond country- and individual-level drivers that dominate the literature and focus on regional characteristics such as the role of regional inequalities in driving partisan feelings. Finally, this approach contributes to a better understanding of the roots of contrasting findings regarding the effects of economic inequalities or economic downturn on levels of affective polarization (Boxell et al., Citation2020; Gidron et al., Citation2020), by stressing that it may be due to a problem of the level of analysis. What matters may not be national socio-economic performances, but rather socio-economic disparities across regions, as well as long-term structural regional decline.
2. AFFECTIVE POLARIZATION AND ITS DRIVERS
In the last few years, studies on partisanship (Oscarsson & Holmberg, Citation2020) and ideological polarization (Abramowitz & Saunders, Citation2008) have taken a new turn with a growing literature on affective polarization (Wagner, Citation2020). The concept is based on the idea that individuals identify with a specific party not only based on ideological considerations but also as part of their social identity (in-group identification). This identification would increasingly lead to a vision of a divided world between an in- and an out-group, and to a feeling of dislike, antipathy, resentment, or even hostility and loathing towards the out-group (Carlin & Love, Citation2018; Iyengar et al., Citation2012; Lelkes, Citation2016).
First studies focused on the United States (Iyengar et al., Citation2012; Iyengar & Westwood, Citation2015) and emphasized an increasing hostility between Democrats and Republicans over time. Progressively, comparative studies have developed and nuanced the exceptionality of the American case, showing that levels of affective polarization can be high in European, multiparty settings too (Boxell et al., Citation2020; Carlin & Love, Citation2018; Gidron et al., Citation2020; Reiljan, Citation2020; Reiljan and Ryan, Citation2021; Wagner, Citation2020; Ward & Tavits, Citation2019; Westwood et al., Citation2018).
The analyses of drivers of affective polarization have mainly focused on individual-level determinants such as age, employment status, education and income (Bonikowski, Citation2017; Ford & Goodwin, Citation2014), or attitudes such as ideological polarization, political interest or national identity (Boxell et al., Citation2020; Levendusky, Citation2018; Mason, Citation2016; Reiljan, Citation2020; Webster & Abramowitz, Citation2017). Among other drivers, the role of mobilizing agencies has also been emphasized. Iyengar et al. (Citation2019) stress that homogeneous personal networks (homophily) and social sorting drive affective polarization up. Political elites, by their explicit appeals to in-groups and their rejection of out-groups, have been shown to contribute to deepening affective polarization (Abramowitz & McCoy, Citation2019; Iyengar et al., Citation2019; Levendusky, Citation2018; Sood & Iyengar, Citation2016). An extended exposure to negative campaigns via partisan news and biased content activates partisanship and partisan hostility, thereby increasing affective polarization (Boxell et al., Citation2020; Garrett et al., Citation2014; Iyengar et al., Citation2019; Lelkes et al., Citation2017).
Finally, a limited number of comparative studies focus on macro-level factors (Hansen & Kosiara-Pedersen, Citation2017; Westwood et al., Citation2018). Institutions matter: majoritarian systems favour affective polarization because they generate a structure of competition that often opposes two major players (Gidron et al., Citation2020; Levendusky, Citation2018); centralization favours polarization, while decentralization diffuses power and multiplies political actors. Gidron et al. (Citation2020) review the role of economic structural factors and find that countries with larger economic inequalities display higher levels of affective polarization, and that economic downturn and increasing inequality over time in the United States drove affective polarization up. This finding is contested by others (Boxell et al., Citation2020; Fenzi, Citation2018).
This overview stresses a crucial limitation in the existing literature. Research often implicitly assumes a homogeneous distribution of affective polarization within countries. To the best of our knowledge, no studies examine aggregate geographical variations of affective polarization within countries. As noted above, this paper intends to fill this gap by estimating the scope of regional variation in levels of affective polarization, and by investigating drivers of these divergent patterns across regions.
3. REGIONAL INEQUALITIES AND AFFECTIVE POLARIZATION
We argue that the nuanced findings regarding the link between structural economic factors and affective polarization might be due to a problem of level of analysis, and that national aggregate measures may hide large within-country disparities. We contend that socio-economic inequalities between regions – both current and long-term changes – drive divergent patterns of affective polarization. We also argue that geographical distance acts as both a direct and a moderating factor, with proximity strengthening divergent patterns.
Regional socio-economic disparities have been at the core of early studies in political science, as part of the structuralist approach. Lipset and Rokkan (Citation1967) already stressed the role of the industrial revolution in generating urban–rural divisions, which in turn have contributed to the shaping of party systems in some Western European countries. However, this approach has made a recent comeback (Autor et al., Citation2016; Ford & Jennings, Citation2020; Gimpel et al., Citation2020; Rodriguez-Pose, Citation2020), with authors emphasizing how structural socio-economic and demographic changes have contributed to increasing geographical disparities within countries, with some (often urban) regions attracting economic development, skilled workforce and capital, and other (rural) areas left behind and facing economic and demographic decline (Johnson & Lichter, Citation2019; Wilkinson, Citation2019). In particular, the literature has focused on the economic decline of former industrial hubs due to increasing competition from emerging economies and changes in the economic structure (Autor et al., Citation2016, Citation2017; Colantone & Stanig, Citation2018; Rodriguez-Pose, Citation2020), and demographic decline, which have caused the loss of basic public and private services, as well as economic opportunities (Essletzbichler et al., Citation2018; Guilluy, Citation2019; Martin et al., Citation2018). The development of these ‘left behind’ areas (McKay, Citation2019) and ‘places that don’t matter’ (Rodriguez-Pose, Citation2020) have been pinpointed as drivers of a ‘geography of discontent’ (Dijkstra et al., Citation2020; McCann, Citation2020). More specifically, studies (Cramer, Citation2016; Dijkstra et al., Citation2020; Maxwell, Citation2020) have shown that these regional socio-economic disparities contribute to widening the gap in political attitudes and voting behaviours, opposing groups of winners (urban affluent cosmopolitan, pro-globalization citizens) and groups of losers (rural, traditional, more conservative citizens). These disparities have been mostly linked to the development of radical, anti-system, populist voting behaviours (Becker et al., Citation2017; Bin Zaid & Joshi, Citation2018; Broz et al., Citation2021; Di Matteo & Mariotti, Citation2020; Di Matteo et al., Citation2022; Greve et al., Citation2021; Ivaldi & Mazzoleni, Citation2020; Jennings & Stoker, Citation2016; Margalit, Citation2019; McCann, Citation2020; McKay, Citation2019; Rodden, Citation2019; Rodriguez-Pose, Citation2020; Van Hauwaert et al., Citation2019). In fact, authors have acknowledged that frustration for the fraying of the economic and social fabric associated with declining regions has pushed people to express their dissatisfaction through the ballot box (Dijkstra et al., Citation2020; Garretsen et al., Citation2018; Los et al., Citation2017).
However, this recent revival of the regional approach has mainly focused on Britain and the United States and has not been connected to the literature on affective polarization.
In this article we connect regional socio-economic inequalities between regions and their difference in levels of affective polarization. In doing so, we follow the work of Stockemer (Citation2017) and Greve et al. (Citation2021) and argue that it is not the absolute level of regional socio-economic development that matters the most, but rather the relative variation between neighbouring regions. That deficit of one region towards other regions has been shown to feed negative feelings such as disrespect, not being represented, of unfairness and favouritism (Algan et al., Citation2019; Boyer et al., Citation2019; Flavin & Franko, Citation2020; Hitlin & Harkness, Citation2017; Pociūtė-Sereikienė, Citation2019). These feelings, known in social psychology as feelings of relative deprivation, explain people’s reactions to objective circumstances based on their subjective comparisons (Gurr, Citation1970; Pettigrew, Citation2016; Smith et al., Citation2012; Smith & Pettigrew, Citation2015; Walker & Pettigrew, Citation1984; Walker & Smith, Citation2002). It rests on the notion of social and/or temporal comparison, as individuals feel deprived relative to their own past or to another person/group (Walker & Smith, Citation2002).
As a result, we contend that current relative regional socio-economic deprivation fuels affective polarization and formulate the following hypothesis:
Hypothesis 1: The larger the socio-economic inequalities between two regions today, the more divergent their patterns of affective polarization today.
Hypothesis 2: The more socio-economic inequalities between two regions have increased over time, the more divergent their patterns of affective polarization today.
Hypothesis 3a: The spatial position of a region pair significantly affects their relative degree of affective polarization, all else being equal.
Hypothesis 3b: The effect of socio-economic inequalities among regions on patterns of affective polarization is moderated by the distance separating the two regions, with proximity strengthening the effect.
4. DATA AND METHOD
4.1. Case selection
In this paper, we analyse regional patterns of affective polarization in Belgium, as it represents an ideal case to better understand affective polarization in multiparty settings (Westwood et al., Citation2018). Indeed, Belgium is a highly fragmented multiparty system. Since the split of traditional party families along the linguistic divide, Belgium is characterized by two party systems operating separately (): Flemish parties compete in Flanders (north of the country), whereas Francophone parties compete in Wallonia (south of the country).Footnote1
Table 1. Parties with representation in the federal parliament, 2014–19 and 2019–present.
Furthermore, the relationship dynamics between parties has changed over the last decades. Belgium has long been labelled as a typical case of consociational democracy with deep social divisions mediated by consensus at the elite level (Paulis et al., Citation2021). However, the capacity of the elite of the two main linguistic groups (French- and Dutch-speakers) to reach agreements has been challenged in last years, as indicated by the length of government formation at the federal level (De Winter, Citation2019). This translated into polarizing trends in the ballot box. The 2019 elections saw substantial shifts in party preferences and the rise of radical left (PVDA-PTB, 12 seats in the Lower Chamber, +10) and radical right parties (VB, who became the second party in Flanders with 18 seats in the Lower Chamber, +15) and the continuing decline of centre, Christian Democratic parties (CD&V, CDH, DéFI). These trends show how Belgium incarnates the understudied and complex character of polarization in multiparty settings.
Our main data source is the RepResent Panel Voter Survey 2019 (Walgrave et al., Citation2020), conducted by the EOS consortium of five research teams at the University of Antwerp, Vrije Universiteit Brussel, KULeuven, Université libre de Bruxelles and UCLouvain.Footnote2 It is a rich and original dataset that includes multiple waves (for more details, see Pilet et al., Citation2020). We are interested in the first two waves of the panel survey. Wave 1 was pre-electoral and conducted from 5 April to 21 May (3298 respondents in Flanders and 3025 in Wallonia). Wave 2 was post-electoral and conducted from 28 May to 18 June (1978 respondents in Flanders and 1429 in Wallonia). The survey was conducted using computer-assisted web interviewing (CAWI) questionnaires and was distributed by Kantar TNS to their own online panel. Panel participants were selected using a quota sample based on gender, age, education and region of residency. The final samples slightly differ from the target population, with an overrepresentation of higher educated respondents and age group 45–65 years. Therefore, when we compute variables making use of the RepResent dataset, we use weights for age, gender and education.
4.2. Dependent variable: Affective polarization at the regional level
Affective polarization has been measured in various ways, using feeling thermometer ratings (Iyengar et al., Citation2019; Wagner, Citation2020), traits ratings (Iyengar et al., Citation2012; Levendusky, Citation2018), trust (Westwood et al., Citation2018), opinion-based groups (Hobolt et al., Citation2021) or social distance measures; albeit the latter has been characterized as less consistent (Druckman & Levendusky, Citation2019). Thermometer ratings, using survey data asking respondents to evaluate parties or partisans on a 0–100 scale, are the most common tools used in the literature. They measure feelings towards parties or partisan, the former usually displaying higher scores (Izengar et al., Citation2012; Knudsen, Citation2021).
In this paper, we opt for the thermometer rating of partisans, a classic and more conservative measure of affective polarization. The data were retrieved from the RepResent Voter Panel Survey 2019, where a question asking respondents to evaluate supporters of each party on a scale ranging from 0 to 100 is available in waves 1 and 2.Footnote3 The higher the score, the higher the sympathy towards partisans of the party. To identify the respondent’s favourite party (in-group) among available parties, we use respondents’ self-reported vote choice for the Lower Chamber in the 2019 federal elections.Footnote4 In a proportional representation system, the proportion of wasted votes is relatively low, and voters are expected to vote according to their actual preference rather than strategic considerations (Cox, Citation1997). Our data confirms that voters in Flanders and Wallonia systematically give the highest sympathy score to partisans from the party they voted for (see Tables A3a and A3b in Appendix A in the supplemental data online). To compute our affective polarization index, we use data from the second wave only, to leave open the possibility of using the first wave to construct explanatory variables. In so doing, we relax potential issues of endogeneity thanks to the time elapsed between the two waves.
Our measure of affective polarization is adapted to a multiparty system setting. We take on board Wagner’s (Citation2020) recommendation that the size of parties matters and that the measure should carefully consider not only the opinion of supporters of each individual party towards their favourite party and other parties, but also the relative importance of each party in the party system. In fact, from the perspective of the political system, polarization driven by sizable parties is not the same if compared with polarization driven by small parties (Dalton, Citation2008). We also share Knudsen’s (Citation2021) recommendation to avoid reducing the number of parties into consideration or collapsing all opinions towards the out-group to an average distance towards all parties or two blocs, especially in a country as Belgium characterized by cross-cutting cleavages. This leads us to follow Reiljan’s (Citation2020) novel, two-step approach. First, in a party system with N relevant parties, we sum the difference between the score assigned by supporters of the n party to their favourite party (i.e., the in-party score) and the one they assign to other m parties (i.e., the out-party score), with and (
), weighted by vote share of each m-party. Second, we weight each of the n-scores by the vote share of n and we sum them up to get the affective polarization index at regional NUTS-3 level. Weights are assigned according to 2019 election results.
These choices translate in the following formula:
(1)
(1) where i indicates a region, n the in-party, m the out-parties and N the total number of relevant parties. The denominator
is intended to exclude the in-party share of votes from this part of the calculation. In this way, the combined vote share of the out-parties would equal 100. Since we expect
being positive or of 0, as people should evaluate the in-party at least as good as each out-party, the affective polarization index Affpoli
. Tables A3a and A3b in Appendix A in the supplemental data online confirm this conjecture (diagonals in both matrices, indicating the score that respondents assign to their favourite party, report values that are far higher than those in other cells, which report the out-group scores). We then construct our dependent variable (Affpolij) in dyadic form by using the Euclidian distance formula.Footnote5 In fact, in line with the notion of relative deprivation, we are interested in the differences in affective polarization levels between regions. As a result, our dependent variable measures how far apart two Belgian NUTS-3 regions are in terms of affective polarization.
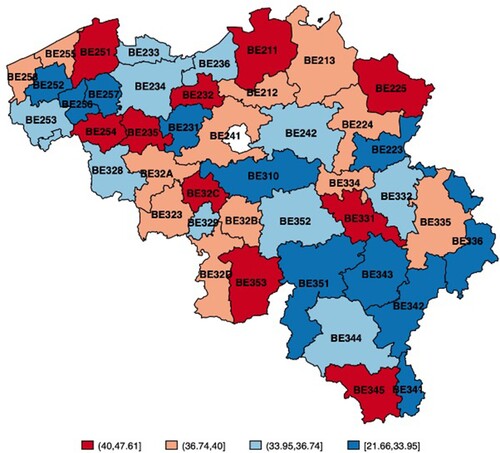
This original approach allows us to have a fine-grained view of affective polarization and its within-country variation (). It highlights how heterogeneous is the distribution of affective polarization across regions, ranging from a value of approximately 20 to close to 50. Lowest degrees of affective polarization are registered in Marche-en-Famenne in Wallonia and Tielt in Flanders (with scores of 21.7 and 25.6, respectively). On the contrary, Philippeville in Wallonia and Oudenaarde in Flanders are the regions registering the highest levels of affective polarization in the country (47.6 and 44.8, respectively). This variation corroborates the relevance of a within-country approach. Patterns confirm that polarization levels are somewhat higher in the various regions in Flanders compared with regions in Wallonia. It also confirms variations within Flanders and Wallonia, thus ensuring us about the validity of our fine-grained geographical account. Especially, levels are higher in former industrial basins that have faced decline and reconversion in last decades: coal mining and steel industries in the Hainaut and Liège provinces in Wallonia (Vandermotten & Vandeburie, Citation2011), and car industry (Antwerp), coal, glass, metals, petrochemicals (Limburg) and textile industries in West Flanders.
Figure 1. Levels of affective polarization in Belgium by NUTS-3 region.
4.3. Explanatory variables
Hypotheses 1 and 2 aim at exploring whether relative regional socio-economic deprivation – both to long-term and across regions – fuels affective polarization (Rodriguez-Pose, Citation2020; Walker & Pettigrew, Citation1984). Socio-economic disparities are commonly measured by a set of structural factors such as the level of income and/or unemployment, but also by the share of manufacturing industries to capture economic structures, and population density to measure human capital and urbanization (Dijkstra et al., Citation2020; Greve et al., Citation2021). In line with these practices, we measure current socio-economic performances of regions (Hypothesis 1) using three indicators, each measured at the regional NUTS-3 level: the gross domestic product per head (GDP), population density (POP), both measured in 2018 and retrieved from Eurostat, and a variable measuring the quality of regional public services (PUBSERV_QUAL), measured in 2017 and retrieved from Fazekas (Citation2017).Footnote6 We consider long-term socio-economic performances (Hypothesis 2) for the period 2000–18, using three indicators: the average annual percentage change of the GDP (GDP_TREND), the average annual change in population (POP_TREND), and the average annual change in level of industrial employment (INDUS_TREND). These variables allow us to investigate the effect of economic, demographic and industrial decline of regions (Dijkstra et al., Citation2020), to analyse the role of geographical proximity (Hypothesis 3), we measure the spatial distance in Km separating each pair of regions (DISTANCE) and we include two dummies equal to one if a region pair is composed of two NUTS-3 regions belonging to the same NUTS-2 and NUTS-1 regions, respectively (SAMENUTS2 and SAMENUTS1).
As the literature has emphasized the role of individual-level factors as drivers of affective polarization, our analyses control for these variables too, collected from the RepResent Voter Panel Survey 2019 (wave 1). We then aggregate individual-level variables at NUTS-3 level by computing the average score for each region, weighted by age, gender and education. First, we consider the average ideological position of voters on the left–right scale within each region (IDEO_DIVERGENCE).Footnote7 Additionally, we measure the perception of voters towards democracy and political institutions using three attitudinal items (satisfaction with democracy, trust in the European Union and trust in the federal parliament) combined into a single additive index (INSTIT_TRUST).Footnote8 Furthermore, we consider two ideological dimensions particularly sensitive to the supporters of extreme parties: the position of voters on redistributive policies (REDISTR)Footnote9 and migration (MIGR).Footnote10 The degree of social polarization is also accounted for by considering what Walloons think about people from Flanders, and vice versa, on a scale 0–100 (SOCIAL_POLAR).Footnote11
To account for our relative deprivation approach, all our explanatory variables are measured as differences among pairs of regions, using either the Manhattan distance formula or the Euclidian distance one, depending on the characteristics of the variable. In particular, we use the former when variables have been collected using thermometer ratings (IDEO_DIVERGENCE, REDISTR_POL, MIGR), since Manhattan distance sums over the absolute difference in shares of responses for multinomial variables (Head & Mayer, Citation2008).Footnote12 Euclidian distance is adopted if variables have a unique score for each region (i.e., GDP, DENSITY, PUBSERV_QUAL, ECON_TREND, INDUS_TREND, DEMOG_TREND, SOCIAL_POL, INSTIT_TRUST, DISTANCE).
presents the descriptive statistics for all variables included in the models, while Tables A1 and A2 in Appendix A in the supplemental data online report data sources and correlation matrix, respectively.Footnote13
Table 2. Descriptive statistics: explanatory and control variables.
4.4. Econometric strategy
Econometrically, we employ a political gravity approach. Originally exploited by scholars investigating bilateral trade flows (Krugman, Citation1995; Tinbergen, Citation1962), the gravity model has been extended to other fields, including cultural studies and political sociology (Anderson, Citation2011; Tubadji & Nijkamp, Citation2015). Even if our dyadic dependent variable does not refer to aspects intrinsically linking each region pair, as in the case of trade flows, we believe that the gravity approach provides several methodological and theoretical advantages over a traditional cross-sectional specification in our setting too (Grosjean, Citation2011).
Methodologically, it makes the estimates more robust, since it allows us to estimate a model with hundreds of observations, instead of limiting the analysis to 43 NUTS-3 regions. Moreover, the inclusion of fixed effects related to each region composing a pair relaxes potential issues of omitted variables, beyond controlling for the third-location effects on pairwise differences (Anderson, Citation1979; Anderson & van Wincoop, Citation2003; Fally, Citation2015; Rose & van Wincoop, Citation2001). From a theoretical perspective, the gravity approach directly controls for the spatial dependence between observations and offers an ideal strategy to test our relative, proximity-based approach to socio-economic deprivation. Further, the gravity approach accounts for what Manski (Citation1993) defines as the reflection problem. It is an issue arising when researchers identify the distribution of a socio-political behaviour in a population by looking at the behaviour of individuals within the population, and link it to several explanatory variables, as it is the case in our study. As noted by Manski (Citation1993), this may lead to identification issues. Suppose that individual i belongs to region A, and B is another region within the same space C under analysis (e.g., a country), such that A and . If we want to characterize region A in domain x by observing the behaviour of i in the same domain, two sources of endogeneity may emerge. First, the behaviour of i is affected by the overall distribution of x in i’s own reference group, that is, A. Second, the behaviour of i also depends on the distribution of x in region B. This effect would make A and B endogenously associated. As already noted by Head and Mayer (Citation2008) and Grosjean (Citation2011), the gravity approach absorbs the reflection problem by incorporating both A and B in the construction of the variable.
Econometrically, we consider the argument put forward by Santos Silva and Tenreyro (Citation2006) and we estimatethe gravity equation in its multiplicative from, through a Poisson pseudo-maximum likelihood (PPML) estimator. In fact, such model outperforms a linear-in-log one in presence of heteroskedasticity. Finally, we control for potential correlation among pairs that include the same region by using the multiway clustering method of standard errors (Cameron et al., Citation2010). Taking all these considerations into account, we end up estimating a series of models of the following general form, through a PPML estimator:
(2)
(2) where Affpolij indicates how far apart pairs of Belgian NUTS-3 regions are in terms of affective polarization,
is the gravitational constant, Dij is a vector of dyadic variables differentiating regions i and j in a number of domains,
and
are region fixed effects and
the error term.
To ease comparison between explanatory variables computed at different scales, we standardize them using the z-score (i.e., mean of 0 and SD of 1).
If the gravity model represents the most robust and reliable empirical approach in our setting, its main drawback may regard the interpretation of results. In fact, coefficients in our gravity model provide the same indications as in a standard regression framework in terms of magnitude and significance level of the correlation between dependent and independent variables. However, they do not inform us about the direction of the effect. By way of example, if we consider GDP_TREND, a positive and significant coefficient indicates that if regions i and j perform differently, they also show different levels of affective polarization, due to economic performance. However, we cannot assess if good performance leads to higher affective polarization, or the other way around. To solve this issue, we also run a standard ordinary least squares (OLS) model using 43 observations (our NUTS-3 regions) and the same set of variables presented in section 4, in monadic form. Such OLS model, even if not fully robust in terms of econometrics, will help us to interpret the results of the gravity model, providing information about the direction of the correlation between variables.
5. RESULTS
presents the results from a set of regressions based on equation (2), where different intensities of affective polarization among pairs of regions, our dependent variable, are regressed over socio-economic inequalities and geographical distance, as well as our individual-level control variables. Table A4 in Appendix A in the supplemental data online reports OLS results. Several interesting findings emerge.
Table 3. Structural and individual drivers of affective polarization (regions pairs), Belgium, 2019.
Column (1) in includes the three variables measuring socio-economic differences among pairs of regions today (GDP, POP, PUBSERV_QUAL), to test Hypothesis 1. The level of GDP per se does not play a major role in determining divergent patterns of affective polarization among regions. The same applies to the variable measuring the quality of public services, as its associated coefficient is not statistically significant at any conventional level, possibly due to the low variation across regions. What matters the most in driving divergent patterns of affective polarization across regions is the current population density level. The larger the difference in density levels between two regions, the more divergent the pattern of affective polarization among these regions. This result confirms the weight of the rural–urban divide. Moreover, Table A4 in Appendix A in the supplemental data online shows a negative relationship between density levels and affective polarization, thus indicating that result in is driven by the fact that low-density regions show higher levels of affective polarization if compared with high-density ones. This is in line with findings in the literature investigating drivers of populist vote (Rodriguez-Pose, Citation2020). People in low-density places may feel inequality represented compared with people in large cities (Dijkstra et al., Citation2020; Rodden, Citation2019). This effect may be also motivated by the cosmopolitan/traditional divide, according to which citizens in large cities are more cosmopolitan and open to different views (Essletzbichler et al., Citation2018).
In column (2), we introduce the differences in socio-economic long-term trends among regions (Hypothesis 2). Results show that the main predictor of our dependent variable is the change in GDP over time (GDP_TREND). Its coefficient is positive, statistically significant at 5% level, and large in magnitude. In fact, a 1 SD (standard deviation) increase in GDP_TREND, roughly corresponding to a 7% difference in the economic performance of two regions, leads to an increase in the dependent variable of about 8%, a value slightly larger than the unit elasticity. Table A4 in Appendix A in the supplemental data online confirms that low-performing regions show higher levels of affective polarization compared with high-performing ones, thus driving the above result. This result corroborates the idea that anti-system political behaviours and political resentment are rooted in economically declining territories (Rodriguez-Pose, Citation2020). The trend in industrial employment (INDUS_TREND) is also significantly correlated to affective polarization, while the demographic one (POP_TREND) shows a positive but not significant coefficient, possibly due to the absence of significant trends of depopulation in Belgian regions in last years (Meeus & De Decker, Citation2015).
Overall, these results neatly confirm a double dynamic at play to drive divergent patterns of affective polarization across regions. First, they show that human capital in the short term, in the form of population density, is a significant explanatory variable, thus confirming a rural–urban cleavage. They also show that what matters the most is the way regions have performed in the last years, rather than their performances today, which corroborates the economic relative deprivation hypothesis in the long term (Rodriguez-Pose, Citation2020).
In , column 3, we consider the spatial distance among pairs of regions to test Hypothesis 3a. We detect a strong and significant neighbouring effect: proximate regions display patterns of affective polarization that are more divergent than distant ones (Hypothesis 3a). In fact, if theoretically we move a region closer to another by 100 kilometres, then we should expect the difference in their degrees of affective polarization to increase by about 6%.
When we add the other two spatial variables (column 4), indicating if a pair is composed of two NUTS-3 regions belonging to the same NUTS-1 and NUTS-2 regions respectively (SAMENUTS1 and SAMENUTS2), we observe that coefficients are not statistically different from zero. This corroborates our spatially disaggregated empirical approach, since what matters in terms of geography is what happens at the lowest NUTS-3 level, rather than NUTS-2 or NUTS-1.
In column (5), we include the individual-level controls. In line with the literature, ideological polarization turns out to be the most relevant variable, with a 1 SD increase in the ideological distance between regions that increases the dependent variable of about the 6%. Note that the coefficient associated with political ideology in Table A4 in Appendix A in the supplemental data online (i.e., IDEO_POL) is not statistically significant at any conventional level. This indicates that the level of affective polarization is not linked to a particular political ideology (i.e., being right- or left-wing oriented per se). Contrarily, what matters is the ideological distance separating individuals/regions. People’s opinion about migration shows a positive and significant sign, as expected (Gidron et al., Citation2020), with migration being a topic often acknowledged as element of separation among supporters of different parties, especially radical ones. Conversely, what individuals think about redistributive policies does not affect affective polarization the same way, indicating that on average it does not represent a primary source of polarization in the Belgian society. The coefficient associated with trust in political institutions is positive and significant. Finally, the cross-opinion of survey respondents towards people from Flanders and Wallonia, that is, SOCIAL_POL, is not statistically significant, confirming that divergent patterns of affective polarization mostly depend on what happens at the very local level.
Even when controlling for these individual-level variables, our results confirm that the main driver of divergent patterns of affective polarization between two regions is their economic performances in the last years, whose coefficient remains slightly larger than the unit elasticity.Footnote14
In sum, what we can draw from this analysis is that (1) apart from typical individual-level drivers of political polarization, what matters the most in determining divergent patterns of affective polarization across two regions is their relative regional socio-economic performance in last years; and (2) an increase in the spatial distance separating two regions contributes to decreasing divergent patterns of affective polarization between these two regions, thus indicating that the relative position of each single region matters. However, it also indicates that proximate regions tend to confront each other to a greater extent than distant ones, with the spatial distance possibly operating as a significant moderating effect. In line with this view, poorly performing regions show divergent patterns of affective polarization compared with well-performing ones, and such differences may be exacerbated if the two regions are located next to each other rather than further apart.
To empirically investigate the mediating effect of spatial distance with respect to our main explanatory variable (Hypothesis 3b), we augment equation (2) with an interaction term involving the two variables of interest, namely DISTANCE and GDP_TREND. To make the interpretation of the coefficients easy, we re-parameterize the interaction term by ‘centring’ DISTANCE before multiplying it with GDP_TREND. In other words, we subtract specific values of interest from the variable DISTANCE itself before interacting it, the values of interest being the 10th, 25th, 50th, 75th and 90th percentiles along the DISTANCE distribution. Following this technique, we estimate five models that only differ for the interaction term, as each of them refers to the effect of GDP_TREND when distance between regions varies from low to high. In other words, this transformation of the interaction term allows us to directly interpret the coefficient of GDP_TREND as its partial effect on the dependent variable at specific values of DISTANCE, ranging from regions located next to each other (10th percentile) to regions located far from each other (90th percentile). As noted above, other non-interacted variables (i.e., our controls) do not vary across specifications. A key advantage of this re-parametrization strategy is that we immediately obtain the standard errors of the partial effects with the estimates (see Wooldridge, Citation2009 for more details).
presents the results of this exercise. We adopt the same specification as in , column (5). It corroborates our argument that distance operates as a relevant mediating element. The impact of GDP_TREND on the dependent variable is amplified if the region pair is composed of two regions located close to one another. In fact, the coefficient associated with GDP_TREND is almost double in column (1) (i.e., proximate regions) compared with column (5) (i.e., distant regions). This supports the argument put forward in Hypothesis 3b.
Table 4. Interaction effect between distance and economic performance on affective polarization (region pairs), Belgium, 2019.
6. CONCLUSIONS
This paper provided a novel approach over a topic that has recently gained increasing attention among scholars, that is, affective polarization. Affective polarization, or the resentment towards opposing parties and their partisans, has been shown as on the rise in bipartisan contexts such as the US, but also in European, multi-party systems. It has also been pointed as having negative effects on the political system, and beyond, on economic and social relationships. However, our understanding of the drivers of affective polarization is still rather limited. Studies on affective polarization at the national level have shown how affective polarization can lead to mobilization of these populations by radical actors and polarizing elites, with clear political consequences. However, the mechanisms of this exploitation were unclear. By showing a more fine-grained picture of affective polarization at the regional level, and by tying it to socio-economic factors, we shed light on some of the triggers of affective polarization and open perspectives as how to potentially reduce it.
In so doing, we investigated (1) whether we find empirical support for regional variations in levels of affective polarization, and (2) if so, what are the drivers of these divergent patterns of affective polarization across regions. Elaborating on the relative deprivation theory, we investigated the role of socio-economic inequalities between two regions – both current and long-term change – in driving divergent patterns of affective polarization. We also analysed whether geographical distance between two regions acts both as a direct and as a mediating factor, with proximity strengthening divergent patterns. Empirically, we looked at the case of Belgium, an ideal-typical case of multipartyism, using the novel, high-quality RepResent Panel Voter Survey 2019. Our descriptive analysis zoomed on within-country variations at NUTS-3 level. It confirmed that Belgium is characterized by large regional variations in levels of affective polarization. Our analysis of the drivers of divergent patterns of affective polarization across regions systematically compared pairs of NUTS-3 regions via a gravity model, to reflect our theoretical emphasis on relative deprivation.
Overall, our results provide original insights into the drivers of affective polarization across regions within a country. Diverging patterns of affective polarization across regions are best explained by how regions have performed economically in last years in terms of GDP, more so than their current performances. Second, we confirmed that differences in population density between regions drives diverging patterns of affective polarization, thus confirming a rural–urban divide. Third, we showed how diverging patterns are exacerbated by geographical proximity, through a direct and indirect effect: neighbouring regions display patterns of affective polarization that are more divergent than distant ones, and geographical proximity reinforces the link between diverging long-term economic performances and divergent patterns of affective polarization.
Our results contribute to the fast-growing literature on affective polarization, but also to studies that analyse the political consequences of regional economic disparities. We demonstrate that what matters the most is not only how regions are performing today in absolute terms, but how a region has performed in last years with respect to neighbouring regions. We show that affective polarization is entrenched in places that have been motors of regional/national economies for long time and that have been hit hard by economic and industrial decline in the last decades. Affective polarization is strengthened if these places are located close to other regions that perform better economically, following a relative deprivation mechanism. These results may provide useful indications in terms of policy. First, we show that affective polarization is mostly entrenched in declining areas, where people may feel frustrated due to the fraying of the economic and social fabric (McKay, Citation2019; Modica et al., Citation2021). If policymakers aim at reducing affective polarization and its negative social and political consequences, they should pay particular attention to these areas. Second, we demonstrated that geography matters in driving patterns of affective polarization, and characteristics of territories and territorial inequalities should be considered when developing policies to contrast drivers of polarization.
Our results should be extended to other contexts for validation, and further research may exploit additional data to conduct longitudinal analyses, to produce better models. It may also allow to investigate the confounding effect that specific shocks, occurred at a specific time, may have on the link between regional aspects and affective polarization. Finally, it points to the importance of investigating other sources of affective polarization than ideology and partisanship. In fact, in recent years, a number of salient political and cultural issues, such as climate change and vaccination, may pave the way for increased affective polarization trends.
Supplemental Material
Download MS Word (38.7 KB)DISCLOSURE STATEMENT
No potential conflict of interest was reported by the authors.
Additional information
Funding
Notes
1 We do not include Brussels in our analysis for reasons related to data availability. Due to the complexity of the party offer in Brussels, with parties from the two language groups competing in its territory, the survey we use to construct our dependent variable, and several explanatory variables, does not include the affective polarization question for respondents from Brussels (for details, see section 4.2).
2 For the data, see https://represent-project.be/.
3 The exact question wording was: ‘Could you use the scale below to indicate how you feel about the following groups?’. The proposed scale ranged from 0 to 100,where 0–49 = Not very favourable; 50 = Neutral; and 51–100 = Favourable. Each respondent located the same seven parties from their region (Flanders or Wallonia) on the scale.
4 The exact question wording was: ‘For which party did you vote for the Chamber during the national elections on the 26th of May 2019?’. The answer categories correspond to the party offer listed alphabetically, in Flanders (seven parties) and Wallonia (seven parties), respectively. Respondents who chose ‘Other’, ‘Blank or Invalid’, ‘I did not vote’, ‘I was not (yet) eligible to vote’ or ‘I do not remember’ were excluded from the analysis.
5 The Euclidian distance takes the following general form: .
6 Fazekas (Citation2017) analysed the quality of regional institutions in Europe over the period 2005–17 by means of public procurements data. Details about the way in which the author operationalized the quality of institutions’ dimensions are reported in his paper.
7 The exact question wording was: ‘In politics people often talk of “left” or “right”. Can you place your own convictions on a scale from 0 to 10, with 0 meaning “left”, 5 “in the centre”, and 10 “right”?’. The proposed scale ranged from 0 to 10, where 0 = Left; 5 = Centre; and 10 = Right.
8 The exact question wording of the three items was: ‘Overall, how satisfied are you with the way democracy is working in Belgium?’ (reversed five-point scale ranging from 1 ‘very unsatisfied’ to 5 ‘very satisfied’); ‘On a scale from 0 to 10, what is your level of trust in each of the following institutions?’: scale from 0 = Absolutely no trust to 10 = full trust, for the items ‘The federal parliament’ and ‘The European Union’. The Cronbach’s alpha test for the internal consistency of such items is 0.91.
9 The exact question wording was: ‘Some people think that the government must intervene as little as possible in the market. Other people think that the government must intervene as much as possible’. Respondents indicate their position on a scale 0–10, where 0 indicates ‘as little as possible’ and 10 ‘as much as possible’.
10 The exact question wording was: ‘Some people think that non-western immigrants must be able to live in Europe while preserving their own culture. Others think that those immigrants should adapt to the European culture’. Respondents indicate their position on a scale 0–10, where 0 indicates ‘preserve their own culture’ and 10 ‘completely adapt to the European culture’.
11 The exact question wording was: ‘Could you use the scale below to indicate how you feel about the following groups?’. The proposed scale ranged from 0 to 100, where 0–49 = Not very favourable; 50 = Neutral; 51–100 = Favourable. Each respondent located voters from the two regions on the same scale (Flemish/Walloons).
12 We define the Manhattan distance (MD) as: , where i and j indicate two NUTS-3 regions composing a pair; and
presents the share in location i(j) of responses allocated to each modality m of the M modalities characterizing each variable.
13 In order to ensure that our data well represent NUTS-3 regions, we have compared the RepResent survey dataset with official statistics from Eurostat. Results confirm that differences between survey data and official statistics are not larger at the regional level than at the national level. As a result, our regional analysis can be considered as robust as those at the country level. This exercise is not reported here for brevity, but it is available from the authors upon request.
14 We also check if the results in are robust to alternative specifications of equation (2) (see Table A5 in the supplemental data online). In particular, we exclude regions where the number of observations in the RepResent survey dataset is fewer than 50, that is, three regions (see Table A5, column 1). We then control for the presence of outliers by winsorizing the dependent variable at the 1–99 and 5–95 percentiles, respectively (see Table A5, columns 2 and 3). Finally, Table A5 (column 4) estimates equation (2) through an OLS estimator, with region fixed effects. Results are qualitatively similar across specifications and to those in , thus reassuring us of the validity of our analysis.
REFERENCES
- Abramowitz, A. I., & McCoy, J. (2019). United States: Racial resentment, negative partisanship, and polarization in trump’s America. The Annals of the American Academy of Political and Social Science, 681(1), 137–156. https://doi.org/10.1177/0002716218811309
- Abramowitz, A. I., & Saunders, K. L. (2008). Is polarization a myth? The Journal of Politics, 70(2), 542–555. https://doi.org/10.1017/S0022381608080493
- Algan, Y., Beasley, E., Cohen, D., Foucault, M., & Péron, M. (2019). Qui sont les gilets jaunes et leurs soutiens? Observatoire du Bien-être du CEPREMAP et CEVIPOF, 2019(3). https://doi.org/10.1371/journal.pone.0211586
- Anderson, J. (1979). A theoretical foundation for the gravity equation. The American Economic Review, 69(1), 106–116.
- Anderson, J. (2011). The gravity model. The Annual Review of Economics, 3(1), 133–160. https://doi.org/10.1146/annurev-economics-111809-125114
- Anderson, J., & van Wincoop, E. (2003). Gravity with gravitas: A solution to the border puzzle. The American Economic Review, 93(1), 170–192. https://doi.org/10.1257/000282803321455214
- Autor, D., Dorn, D., Hanson, G., & Majlesi, K. (2017). A note on the effect of rising trade exposure on the 2016 presidential election. Appendix to Importing Political Polarization.
- Autor, D. H., Dorn, D., & Hanson, G. H. (2016). The China shock: Learning from labor-market adjustment to large changes in trade. Annual Review of Economics, 8(1), 205–240. https://doi.org/10.1146/annurev-economics-080315-015041
- Becker, S. O., Fetzer, T., & Novy, D. (2017). Who voted for Brexit? A comprehensive district-level analysis. Economic Policy, 32(92), 601–650. https://doi.org/10.1093/epolic/eix012
- Bin Zaid, H., & Joshi, D. K. (2018). Where does right-wing populism succeed sub-nationally? Explaining regional variation within France. Populism, 1(2), 87–115. https://doi.org/10.1163/25888072-00001011
- Bolton, G., & Ockenfels, A. (2000). ERC: A theory of equity, reciprocity and competition. The American Economic Review, 90(1), 166–193. https://doi.org/10.1257/aer.90.1.166
- Bonikowski, B. (2017). Ethno-nationalist populism and the mobilization of collective resentment. The British Journal of Sociology, 68(S1), 181–213.
- Bourdin, S., & Tai1, J. (2021). Abstentionist voting–between disengagement and protestation in neglected areas: A spatial analysis of the Paris metropolis. International Regional Science Review. https://doi.org/10.1177/01600176211034131
- Boxell, L., Gentzkow, M., & Shapiro, J. M. (2020). Cross-country trends in affective polarization. Working Paper of the National Bureau of Economic Research, 26669.
- Boyer, P. C., Delemotte, T., Gauthier, G., Rollet, V., & Schmutz, B. (2019). Le territoire des gilets jaunes. halshs-02520737.
- Broz, J. L., Frieden, J., & Weymouth, S. (2021). Populism in place: The economic geography of the globalization backlash. International Organization, 9, 1–31. https://doi.org/10.1111/nph.17400
- Cameron, J. J., Stinson, D. A., Gaetz, R., & Balchen, S. (2010). Acceptance is in the eye of the beholder: Self-esteem and motivated perceptions of acceptance from the opposite sex. Journal of Personality and Social Psychology, 99(3), 513–529.
- Carlin, R. E., & Love, G. J. (2018). Political competition, partisanship and interpersonal trust in electoral democracies. British Journal of Political Science, 48(1), 115–139. https://doi.org/10.1017/S0007123415000526
- Colantone, I., & Stanig, P. (2018). The trade origins of economic nationalism: Import competition and voting behavior in Western Europe. American Journal of Political Science, 62(4), 936–953. https://doi.org/10.1111/ajps.12358
- Correira, S., Guimaraes, P., & Zylkin, T. (2020). Fast Poisson estimation with high-dimensional fixed effects. The Stata Journal: Promoting Communications on Statistics and Stata. http://doi.org/10.2139/ssrn.3561560
- Cox, G. (1997). Making votes count. Strategic coordination in the world’s electoral systems. Cambridge University Press.
- Cramer, K. J. (2016). The politics of resentment: Rural consciousness in Wisconsin and the rise of Scott Walker. University of Chicago Press.
- Dalton, R. J. (2008). The quantity and the quality of party systems: Party system polarization, its measurement, and Its consequences. Comparative Political Studies, 41(7), 899–920. https://doi.org/10.1177/0010414008315860
- Deaton, A. (2003). Health, inequality and economic development. Journal of Economic Literature, 41(1), 113–158. https://doi.org/10.1257/jel.41.1.113
- De Winter, L. (2019). Government coalitions as a reflection of national politics. The complex case of Belgium. In M. Evans (Ed.), Coalition government as a reflection of a nation’s politics and society. Routledge.
- Dijkstra, L., Peolman, H., & Rodriguez-Pose, A. (2020). The geography of EU discontent. Regional Studies, 54(6), 737–753. https://doi.org/10.1080/00343404.2019.1654603
- Di Matteo, D., Ferrara, A. R., & Mariotti, I. (2022). Place-based policies and political discontent: The mediating role of local spending programs. Italian Journal of Regional Science, forthcoming.
- Di Matteo, D., & Mariotti, I. (2020). Italian discontent and right-wing populism: Determinants, geographies, patterns. Regional Science Policy & Practice, 1–26. https://doi.org/10.3390/su14010550
- Druckman, J. N., & Levendusky, M. S. (2019). What Do We measure when We measure affective polarization? Public Opinion Quarterly, 83(1), 114–122. https://doi.org/10.1093/poq/nfz003
- Duesenberry, J. (1949). Income, saving and the theory of consumer behavior. Harvard University Press.
- Easterlin, R. (2003). Explaining happiness. Proceedings of the National Academy of Sciences, 100(19), 11176–11183. https://doi.org/10.1073/pnas.1633144100
- Essletzbichler, J., Disslbacher, F., & Moser, M. (2018). The victims of neoliberal globalisation and the rise of the populist vote: A comparative analysis of three recent electoral decisions. Cambridge Journal of Regions, Economy and Society, 11(1), 73–94. https://doi.org/10.1093/cjres/rsx025
- Fally, T. (2015). Structural gravity and fixed effects. Journal of International Economics, 97(1), 76–85. https://doi.org/10.1016/j.jinteco.2015.05.005
- Fazekas, M. (2017). Assessing the quality of government at the regional level using public procurement data. European Commission WP, 2017(12).
- Fenzi, M. (2018). Income inequality and party (de)polarisation. Western European Politics, 41(6), 1262–1281. https://doi.org/10.1080/01402382.2018.1436321
- Festinger, L. (1954). A theory of social comparison processes. Human Relations, 7(2), 117–140. https://doi.org/10.1177/001872675400700202
- Flavin, P., & Franko, W. W. (2020). Economic segregation and unequal policy responsiveness. Political Behavior, 42(3), 845–864. https://doi.org/10.1007/s11109-018-09522-9
- Ford, R., & Goodwin, M. (2014). Understanding UKIP: Identity, social change and the left behind. The Political Quarterly, 85(3), 277–284.
- Ford, R., & Jennings, W. (2020). The changing cleavage politics of Western Europe. Annual Review of Political Science, 23(1), 295–314. https://doi.org/10.1146/annurev-polisci-052217-104957
- Frey, B., & Stutzer, A. (2002). What Can economists learn from happiness research? Journal of Economic Literature, 40(2), 402–435. https://doi.org/10.1257/jel.40.2.402
- Garretsen, H., Stoker, J. I., Soudis, D., Martin, R. L., & Rentfrow, P. J. (2018). Brexit and the relevance of regional personality traits: More psychological openness could have swung the regional vote. Cambridge Journal of Regions, Economy and Society, 11(1), 165–175. https://doi.org/10.1093/cjres/rsx031
- Garrett, R. K., Gvirsman, S. D., Johnson, B. K., Tsfati, Y., Neo, R., & Dal, A. (2014). Implications of Pro- and counter attitudinal information exposure for affective polarization. Human Communication Research, 40(3), 309–332. https://doi.org/10.1111/hcre.12028
- Gidron, N., Adams, J., & Horne, W. (2020). American affective polarization in comparative perspective. Cambridge University Press.
- Gimpel, J. G., Lovin, N., Moy, B., & Reeves, A. (2020). The rural–urban gulf in American political behaviour. Political Behavior, Online First.
- Gravelle, H., & Sutton, M. (2009). Income, relative income, and self-reported health in Britain 1979–2000. Health Economics, 18(18), 125–145. https://doi.org/10.1002/hec.1354
- Gray, M., & Barford, A.. (2018). The depths of the cuts: the uneven geography of local government austerity. Cambridge Journal of Regions, Economy and Society, 11(3), 541–563.
- Greve, M., Fritsch, M., & Wyrwich, M. (2021). Long-term decline of regions and the rise of populism: The case of Germany. JENA Economic Research Papers, 006.
- Grosjean, P. (2011). The weight of history on European cultural integration: A gravity approach. American Economic Review: Papers & Proceedings, 101(3), 504–508. https://doi.org/10.1257/aer.101.3.504
- Guilluy, C. (2019). Fractures françaises. Flammarion.
- Gurr, T. R. (1970). Why men rebel. Princeton, NJ: Princeton University Press.
- Hansen, K. M., & Kosiara-Pedersen, K.. (2017). How campaigns polarize the electorate: Political polarization as an effect of the minimal effect theory within a multi-party system. Party Politics, 23(3), 181–192.
- Head, K., & Mayer, T. (2008). Detection of local interactions from the spatial pattern of names in France. Journal of Regional Science, 48(1), 67–95. https://doi.org/10.1111/j.1365-2966.2007.00548.x
- Hetherington, M. J., & Rudolph, T. J. (2015). Why Washington won’t work: Polarization, political trust, and the governing crisis. University of Chicago Press.
- Hitlin, S., & Harkness, S. K. (2017). Unequal foundations: Inequality, morality, and emotions across cultures. Oxford University Press.
- Hobolt, S. B., Leeper, T. J., & Tilley, J. (2021). Divided by the vote: Affective polarization in the wake of the Brexit referendum. British Journal of Political Science, 51(4), 1476–1493. https://doi.org/10.1017/S0007123420000125
- Huber, G. A., & Malhotra, N. (2017). Political homophily in social relationships: Evidence from online dating behavior. The Journal of Politics, 79(1), 269–283. https://doi.org/10.1086/687533
- Iammarino, S., Rodriguez-Pose, A., & Storper, M. (2019). Regional inequality in Europe: Evidence, theory and policy implications. Journal of Economic Geography, 19(2), 273–298. https://doi.org/10.1093/jeg/lby021
- Immerzeel, T., & Pickup, M. (2015). Populist radical right parties mobilizing “the people”? The role of populist radical right success in voter turnout. Electoral Studies, 40, 347–360. https://doi.org/10.1016/j.electstud.2015.10.007
- Ivaldi, G., & Mazzoleni, O. (2020). Economic populism and sovereigntism: The economic supply of European radical right-wing populist parties. European Politics and Society, 21(2), 202–218. https://doi.org/10.1080/23745118.2019.1632583
- Iyengar, S., Lelkes, Y., Levendusky, M., Malhotra, N., & Westwood, S. J. (2019). The origins and consequences of affective polarization in the United States. Annual Review of Political Science, 22(1), 129–146. https://doi.org/10.1146/annurev-polisci-051117-073034
- Iyengar, S., Sood, G., & Lelkes, Y. (2012). Affect, Not ideology. A social identity perspective on polarization. Public Opinion Quarterly, 76(3), 405–431. https://doi.org/10.1093/poq/nfs038
- Iyengar, S., & Westwood, S. J. (2015). Fear and loathing across party lines: New evidence on group polarization. American Journal of Political Science, 59(3), 690–707. https://doi.org/10.1111/ajps.12152
- Jennings, W., & Stoker, G. (2016). The bifurcation of politics: Two Englands. The Political Quarterly, 87(3), 372–382. https://doi.org/10.1111/1467-923X.12228
- Johnson, K. M., & Lichter, D. T. (2019). Rural depopulation: Growth and decline processes over the past century. Rural Sociology, 84(1), 3–27. https://doi.org/10.1111/ruso.12266
- Knudsen, E. (2021). Affective polarization in multiparty systems? Comparing affective polarization towards voters and parties in Norway and the United States. Scandinavian Political Studies, 44(1), 34–44. https://doi.org/10.1111/1467-9477.12186
- Krugman, P. (1995). Increasing returns, imperfect competition and the positive theory of international trade. Handbook of International Economics, 3, 1243–1277. https://doi.org/10.1016/S1573-4404(05)80004-8
- Lelkes, Y. (2016). Mass polarization: Manifestations and measurements. Public Opinion Quarterly, 80(1), 392–410. https://doi.org/10.1093/poq/nfw005
- Lelkes, Y., Sood, G., & Iyengar, S. (2017). The hostile audience: The effect of access to broadband internet on partisan affect. American Journal of Political Science, 61(1), 5–20. https://doi.org/10.1111/ajps.12237
- Levendusky, M. (2018). Americans, Not partisans: Can priming American national identity reduce affective polarization? The Journal of Politics, 80(1), 59–70. https://doi.org/10.1086/693987
- Lipset, S. M., & Rokkan, S. (1967). Cleavage structures, party systems and voter alignments: An introduction. In S. M. Lipset & S. Rokkan (Eds.), Party systems and voter alignments: Cross-national perspectives. Free Press.
- Los, B., McCann, P., Springford, J., & Thissen, M. (2017). The mismatch between local voting and the local economic consequences of Brexit. Regional Studies, 51(5), 786–799. https://doi.org/10.1080/00343404.2017.1287350
- Manski, C. F. (1993). Identification of endogenous social effects: The reflection problem. The Review of Economic Studies, 60(3), 531–542. https://doi.org/10.2307/2298123
- Margalit, Y. (2019). Economic insecurity and the causes of populism, reconsidered. Journal of Economic Perspectives, 33(4), 152–170. https://doi.org/10.1257/jep.33.4.152
- Martin, R., Tyler, P., Storper, M., Evenhuis, E., & Glasmeier, A. (2018). Globalisation at a critical conjuncture? Cambridge Journal of Regions, Economy and Society, 11(1), 3–16. https://doi.org/10.1093/cjres/rsy002
- Mason, L. (2016). A cross-cutting calm: How social sorting drives affective polarization. Public Opinion Quarterly, 80(S1), 351–377. https://doi.org/10.1093/poq/nfw001
- Maxwell, R. (2020). Geographic divides and cosmopolitanism: Evidence from Switzerland. Comparative Political Studies, 53(13), 2061–2090. https://doi.org/10.1177/0010414020912289
- McCann, P. (2020). Perceptions of regional inequality and the geography of discontent: Insights from the UK. Regional Studies, 54(2), 256–267. https://doi.org/10.1080/00343404.2019.1619928
- McConnell, C., Margalit, Y., Malhotra, N., & Levendusky, M. (2018). The economic consequences of partisanship in a polarized Era. American Journal of Political Science, 62(1), 5–18. https://doi.org/10.1111/ajps.12330
- McKay, L. (2019). ‘Left behind’ people, or places? The role of local economies in perceived community representation. Electoral Studies, 60, 102046. https://doi.org/10.1016/j.electstud.2019.04.010
- Meeus, B., & De Decker, P. (2015). Staying Put! A housing pathway analysis of residential stability in Belgium. Housing Studies, 30(7), 1116–1134. https://doi.org/10.1080/02673037.2015.1008424
- Modica, M., Urso, G., & Faggian, A. (2021). Do inner areas matter? Conceptualization, trends and strategies for their future development path. Scienze Regionali, 20(2), 237–265. https://doi.org/10.14650/99816
- Oscarsson, H., & Holmberg, S. (Eds.). (2020). Research handbook on political partisanship. Edward Elgar Publishing.
- Paul, S. (1991). An index of relative deprivation. Economics Letters, 36(3), 337–341. https://doi.org/10.1016/0165-1765(91)90043-K
- Paulis, E., Ognibene, M., & Brennan, A. E. (2021). Les partis politiques belges et l’utilisation des reseaux sociaux en ligne. In P. Delwit & E. van Haute (Eds.), Les partis politiques en belgique. Editions de l’Université de Bruxelles.
- Pettigrew, T. F. (2016). In pursuit of three theories: Authoritarianism, relative deprivation, and intergroup contact. Annual Review of Psychology, 67, 1–21.
- Pilet, J.-B., Baudewyns, P., Deschouwer, K., Kern, A., & Lefevere, J. (Eds.). (2020). Les belges haussent leur voix. Une analyse des comportements électoraux du 26 mai 2019. Presses Universitaires de Louvain.
- Pociūtė-Sereikienė Gintarė. (2019). Peripheral regions in Lithuania: The results of uneven development. Regional Studies, Regional Science, 6(1), 70–77. https://doi.org/10.1080/21681376.2019.1571437
- Reiljan, A. (2020). ‘Fear and loathing across party lines’ (also) in Europe: Affective polarization in European party systems. European Journal of Political Research, 59(2), 376–396. https://doi.org/10.1111/1475-6765.12351
- Reiljan, A., & Ryan, A. (2021). Ideological tripolarization, partisan tribalism and institutional trust: The foundations of affective polarization in the Swedish multiparty system. Scandinavian Political Studies, 44(2), 195–219. https://doi.org/10.1111/1467-9477.12194
- Rodden, J. A. (2019). Why cities lose: The deep roots of the urban–rural political divide. Basic Books.
- Rodriguez-Pose, A. (2020). The rise of populism and the revenge of places that don’t matter. LSE Public Policy Review, 1(1), 1–9. https://doi.org/10.31389/lseppr.4
- Rose, A. K., & van Wincoop, E. (2001). National money as a barrier to international trade: The real case for currency union. American Economic Review, 91(2), 386–390. https://doi.org/10.1257/aer.91.2.386
- Santos Silva, J., & Tenreyro, S. (2006). The log of gravity. The Review of Economics and Statistics, 88(4), 641–658. https://doi.org/10.1162/rest.88.4.641
- Smith, H. J., & Pettigrew, T. F. (2015). Advances in relative deprivation theory and research. Social Justice Research, 28(1), 1–6.
- Smith, H. J., Pettigrew, T. F., Pippin, G. M., & Bialosiewicz, S. (2012). Relative deprivation: A theoretical and meta-analytic review. Personality and Social Psychology Review, 16(3), 203–232.
- Sood, G., & Iyengar, S. (2016). Coming to dislike your opponents: The polarizing impact of political campaigns. SSRN Electronic Journal. http://doi.org/10.2139/ssrn.2840225
- Stockemer, D. (2017). The front national in France. Springer International Publishing.
- Tinbergen, J. (1962). Shaping the world economy: Suggestions for an international economic policy. Twentieth Century Fund.
- Tubadji, A., & Nijkamp, P. (2015). Cultural impact on regional development: application of a PLS-PM model to Greece, The Annals of Regional Science, Springer. Western Regional Science Association, 54(3), 687–720.
- Vandermotten, C., & Vandeburie, J. (2011). Le belgique, etat-nation failli. In C. Vandermotten & J. Vandeburie (Eds.), Territorialités et politique. Editions de l’Université de Bruxelles.
- Van Hauwaert, S. M., Schimpf, C. H., & Dandoy, R. (2019). Populist demand, economic development and regional identity across nine European countries: Exploring regional patterns of variance. European Societies, 21(2), 303–325. https://doi.org/10.1080/14616696.2019.1583355
- Wagner, M. (2020). Affective polarization in multiparty systems. OSF Preprints. https://doi.org/10.31219/osf.io/j7d4t
- Walgrave, S., van Erkel, P., Jennart, I., Celis, K., Deschouwer, K., Marien, S., Pilet, J.-B., Rihoux, B., Van Haute, E., Van Ingelgom, V., Baudewyns, P., Kern, A., & Lefevere, J. (2020). Represent longitudinal and cross-sectional electoral survey 2019. DANS. https://doi.org/10.17026/dans-xe8-7t78.
- Walker, I. (2002). Relative deprivation: Specification, development, and integration. Cambridge University Press.
- Walker, I., & Pettigrew, T. F. (1984). Relative deprivation theory: An overview and conceptual critique. British Journal of Social Psychology, 23, 301–310.
- Ward, D. C., & Tavits, M. (2019). How partisan affect shapes citizens’ perception of the political world. Electoral Studies, 60(4), 102045. https://doi.org/10.1016/j.electstud.2019.04.009
- Webster, S. W., & Abramowitz, A. I. (2017). The ideological foundations of affective polarization in the U.S. Electorate. American Politics Research, 45(4), 621–647. https://doi.org/10.1177/1532673X17703132
- Westwood, S. J., Iyengar, S., Walgrave, S., Leonisio, R., Miller, L., & Strijbis, O. (2018). The tie that divides: Cross-national evidence of the primacy of partyism. European Journal of Political Research, 57(2), 333–354. https://doi.org/10.1111/1475-6765.12228
- Wilkinson, W. (2019). The density divide: Urbanization, polarization and populist backlash. Niskanen Center Research Paper.
- Wooldridge, J. M. (2009). On estimating firm-level production functions using proxy variables to control for unobservables. Economics Letters, 104(3), 112–114.