
ABSTRACT
Neighbourhoods affect people’s livelihoods, and therefore drive and mediate intra-urban inequalities and transformations. While the neighbourhood has long been recognized as an important unit of analysis, there is surprisingly little systematic research on different neighbourhood types, especially in the fast-growing cities of the Global South. In this paper we employ k-means clustering, a common machine-learning algorithm, to develop a neighbourhood typology for South Africa’s eight largest cities. Using census data, we identify and describe eight neighbourhood types, each with distinct demographic, socio-economic, structural and infrastructural characteristics. This is followed by a relational comparison of the neighbourhood types along key variables, where we demonstrate the persistent and multi-dimensional nature of residential inequalities. In addition to shedding new light on the internal structure of South African cities, the paper makes an important contribution by applying an inductive, data-driven approach to developing neighbourhood typologies that advances a more sophisticated and nuanced understanding of cities in the Global South.
JEL classifications:
1. INTRODUCTION
The ‘urban age’ is marked by rising economic inequalities between and within cities.Footnote1 This impacts urban forms and the internal structure of cities. Evidence suggests that growing inequality has contributed to increasing residential segregation and other divisions within urban areas (Van Ham et al., Citation2021). Some of the consequences have been vividly exposed by the coronavirus pandemic. The type of neighbourhood people live in has shaped their experiences of and capacity to cope with COVID-19 and national lockdowns. While more affluent groups have continued to work, exercise and socialize from their homes, the less privileged have had to crowd into inadequate dwellings with deficient infrastructure, struggling to survive with little or no income. As a result, the pandemic has exacerbated historic inequalities between urban populations, which are reaching dangerous levels across the world. There is growing pressure on policymakers to pay more attention to these inequalities and develop ways of creating more inclusive cities. Urban scholars can help by providing a better understanding of the internal structure and changing socio-economic disparities within different cities (Acuto et al., Citation2020).
A large body of neighbourhood research has examined these internal patterns and dynamics. By focusing on the neighbourhood level, it has altered our conception of the city, depicting it as an agglomeration of different neighbourhoods that are constantly being changed by multi-scalar social, economic, political and environmental processes. Scholars have demonstrated how neighbourhoods influence people’s life circumstances, opportunities and trajectories (Chetty & Hendren, Citation2018; Sampson, Citation2019). They have also shown how structural inequalities in class, race and gender manifest themselves across neighbourhoods and how they influence the sustainability of cities. The argument that neighbourhoods matter is now widely accepted within urban studies and policy circles (Baffoe, Citation2019; Kearns & Parkinson, Citation2001).
Nevertheless, large knowledge gaps remain, specifically with regard to different neighbourhood types and how they affect socio-economic inequalities in different contexts. This is especially the case in the Global South, where rapid urbanization is creating larger, more complex and inequitable neighbourhood agglomerations. While many scholars have studied neighbourhoods in developing cities, their focus has been ethnographic, commonly examining the living conditions experienced by the poor in informal settlements or peripheral state-subsidised housing estates, social housing and the like. Although there is research into middle and higher income neighbourhoods in developing cities, specifically gated communities or inner-city areas, hardly any systematic analysis of neighbourhood types spanning the entire income spectrum exists. As a result, we know little about the different kinds of residential environments that exist, including the so-called in-between spaces and ‘grey’ areas. Advancing a more systematic analysis of the (changing) formation and characteristics of all neighbourhood types is therefore an important intellectual and policy agenda (Wang & Kintrea, Citation2019).
The aim of this paper is twofold: to develop a neighbourhood typology for South Africa’s eight largest cities, and to test the efficacy of an inductive, data-driven approach, which – to our knowledge – has not previously been applied research on neighbourhoods in the Global South. We contribute to the body of neighbourhood research: first, by identifying and mapping eight distinct neighbourhood types across South Africa’s eight metropolitan municipalities (metros), thus offering a baseline and units of analysis for future comparative research and longitudinal tracking of neighbourhood change over time; second, by demonstrating considerable variation among urban areas in South Africa commonly referred to simply as ‘poor’ or ‘low income’; and third, by providing new evidence of the stark inequalities between localities in South Africa, suggesting a shift from race- to class-based segregation post-apartheid.
The paper is structured as follows. First, we locate our approach within a broader conceptual discussion of neighbourhoods. Next, we provide background by giving a brief overview of the history of South African cities. This is followed by a description of out methodological approach. We then present our typology of neighbourhoods. This section also includes maps of the metros and descriptions of the eight neighbourhood types. We then take a step back and distil some higher level findings about internal differentiation and residential segregation. In the final section we draw conclusions.
2. MAKING SENSE OF NEIGHBOURHOODS
From ancient cities to the modern metropolis, neighbourhoods have been a fundamental organizing unit in urban life. Despite enormous transformations in the size, shape and functions of cities over the centuries, the persistence of internal differentiation and spatial divisions have been one of the few constants of urbanization (Sampson, Citation2019). Studying the production and effects of neighbourhoods is therefore an important way of making sense of cities. What is meant by ‘neighbourhood’ is a matter of longstanding debate in the literature (see Baffoe, Citation2019, for a review of the literature). Despite disagreements over definition, neighbourhoods are useful analytical units when we recognize them as ‘the flexible, contingent, social and political products that they are’ (Martin, Citation2003, p. 7).
Various approaches have been used to define neighbourhoods in urban research, focusing on the spatial boundaries of places, which share infrastructure, public space or shared sets of identities (Alkan & Maksudyan, Citation2020). As social constructs, perceptions and subjective factors shape the meaning of neighbourhood, which may be contested and negotiated by residents and stakeholders (Anderson, Citation2017). These subjective notions of neighbourhood depend on individuals’ historical background and positionality. They may encompass fluid, multiple and dynamic boundaries including both physical and emotional elements or neighbourhood intimacies (Alkan & Maksudyan, Citation2020).
While these subjective definitions of neighbourhoods are important to understand residents’ own perspectives, quantitative studies have tended to employ existing definitions or spatial units. They have often used administrative boundaries for which data are available. While this has enabled large-scale and statistically representative studies of neighbourhood typologies, effects and change, their unit of analysis does not necessarily correspond with the perceptual reality of individuals. In addition, there is a risk that this kind of ‘Westphalian neighbourhood imaginary’, which chops the city into ‘sharply demarcated, bounded neighbourhood units’ (Madden, Citation2014, p. 473), ultimately functions to depoliticize the administrative process of neighbourhood making. Even if unintended, these studies can serve to reify administrative definitions of neighbourhoods as given, natural and determinant to social life (Soja, Citation1980).
In this paper, we define neighbourhoods as bundles of spatially based attributes associated with clusters of residences (Galster, Citation2001, p. 2112). Concretely, we use official census tracts as proxies for neighbourhoods and study and compare their demographic, socio-economic, structural and infrastructural characteristics.Footnote2 Census tracts are legal–administrative constructs that may differ quite significantly from residents’ own perceptions of their neighbourhood. Also, they embody specific political and administrative objectives of the government and the national statistics office, Statistics South Africa (Stats SA). While we recognize these important critiques, we still believe in the value of studying neighbourhoods through census tracts. First, they are ‘widely used statistically convenient units’ (Delmelle, Citation2015, p. 3) that have been used as proxies for neighbourhoods in other research (Delmelle, Citation2015, Citation2017; Hincks, Citation2015, Citation2017). Second, and more importantly, they are the smallest geographical unit for which data are available in South Africa, allowing for the most sophisticated comparative analysis of neighbourhoods, both within and between South African cities.
3. HISTORY OF NEIGHBOURHOOD SEGREGATION IN SOUTH AFRICA
Before presenting our methodological approach, it is important to remind readers of the legacies of apartheid spatial planning. In the following, and throughout the paper, we use the race classification and nomenclature used by Stats SA and refer to race categories as ‘Black African’, ‘Coloured’, ‘Indian or Asian’ and ‘White’. While we fundamentally believe race categories are social constructs, it goes beyond the scope of this paper to problematize them. Apartheid spatial planning separated people of colour (Black African, Coloured, and Indian or Asian) both from each other, with slightly better services for Indian or Asian and Coloured areas, and from White suburbia. The apartheid government forcibly restructured cities by displacing people of colour from designated ‘white areas’ and directing different races into separate neighbourhoods. Natural (rivers, mine dumps, etc.) and constructed (motorways, light industrial plant, etc.) barriers separated ‘Black African’ and ‘White areas’. Neighbourhoods preserved for whites were well-located, had lower population densities and enjoyed considerable public investment in housing, infrastructure and social amenities. Neighbourhoods for people of colour were in outer areas or in-between spaces, with inferior access to opportunities, limited infrastructure and separate governing institutions. As urbanization increased, the government established more townships to contain black residents and eradicate informal settlements, with diminishing success over the years. These townships were deliberately construed as dormitory settlements with poor facilities and connectivity. Black populations were prohibited from owning property, starting most types of businesses and required an internal passport to move around (Maharaj, Citation2020; Strauss, Citation2019).
With the dawn of democracy in 1994 came a suite of institutional and legislative reforms, which signalled the need to restructure the entire country, including cities, into more integrated, inclusive and sustainable places. The 1996 constitution enshrined socio-economic rights, including to land and housing, and gave the state powers to expropriate land. However, in line with the wider political settlement, the state did little to redistribute urban land but followed market-oriented economic and spatial policies. To alleviate poverty, the state rolled out welfare programmes and invested in basic service provision. This included considerable public investment into low-income housing, which took the form of low-density, peripheral settlements that ironically perpetuated the apartheid patterns of segregation (Turok & Scheba, Citation2018). However, there was no strategic or integrated approach to transform the polarized and highly unequal geography of urban areas (Everatt & Ebrahim, Citation2020). The ruling African National Congress (ANC) appeared to be more concerned with rural development, clinging to notions of rural areas being ‘able to attract and retain skilled and knowledgeable people, who are equipped to contribute to growth and development’ (Government of South Africa, Citation2000). While there have been improvements in access to essential services for most residents, South African cities remain places of stark contrasts, which will be unpacked below.
4. METHODOLOGICAL APPROACH
In this section we describe our methodological approach. Clustering has been used to study neighbourhoods and develop neighbourhood typologies in the Global North (Delmelle, Citation2015; Mikelbank, Citation2011; Reibel, Citation2011).Footnote3 However, they have not previously been applied to neighbourhood research in the Global South; certainly not in Africa, where the type of fine-grained, multidimensional and georeferenced data that are required have historically been unavailable or unreliable (Jerven, Citation2013).
To develop our neighbourhood typology, we proceeded as follows. First, we compiled a dataset covering South Africa’s eight metros.Footnote4 Data were extracted from the 2011 Census, which is the most recent.Footnote5 We used the small area layer (SAL), which is the smallest geographical unit for which census data are available. The SAL is created by combining census tracts, known in South Africa as enumeration areas (EA), with a population of fewer than 500 people with adjacent EAs. The result is a dataset with information about 29,568 SAL places across the eight metros. The information covers basic demographic characteristics, including age, gender, race, language etc.; socio-economic characteristics, including citizenship, education, employment, assets, income etc.; structural characteristics, including housing type and size; and infrastructural characteristics, including public services. In total, the dataset contains 330 variables (including 13 basic identifiers), giving approximately 9.8 million data points. In the main analysis, we included all census variables. This deviates from the literature, where correlated variables are usually removed before the clustering to eliminate redundancy (Gale et al., Citation2016). We remove the correlated variables in the sensitivity analysis. The dataset is exhaustive and complete, meaning that all information was available for all SAL places. To eliminate bias stemming from SAL place size or variable range variation, all variables were standardized using z-score standardization: first, by converting the count values to proportions;Footnote6 second, by subtracting the mean of each variable from each value (centring); and third, by dividing the resulting value by the standard deviation of each variable (scaling). Z-score standardization is the most widely used approach to standardization (Gale et al., Citation2016), including in neighbourhood research (Delmelle, Citation2015, Citation2017). We change the standardization to range normalization in the sensitivity analysis.
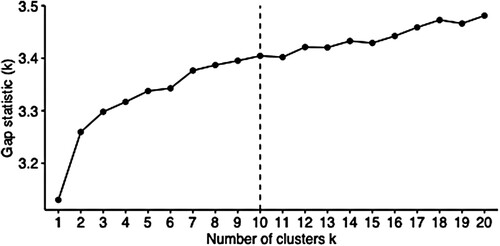
Second, we ran a k-means clustering (Hartigan & Wong, Citation1979). K-means is a one of the most common machine-learning algorithms and has been used to identify crime locations, profile cybercriminals, detect insurance fraud, segment markets, segment images, classify call records etc. (see Wu, Citation2012, for an overview). It aims to partition n observations into k clusters so that each observation belongs to the cluster with the nearest mean. It does so by randomly picking a set of centroids, which are used as the starting point for each cluster, and then performing iterative calculations to optimize the position of the centroids. K is preselected. Different methods for selecting k have been proposed in the literature. We used the ‘gap statistic’, as proposed by Tibshirani et al. (Citation2001). The gap statistic compares the within-cluster variation for different values of k with their expected value under a reference null distribution. The optimal number of clusters is where the gap statistic is maximized, meaning the cluster solution is furthest from a random, uniform distribution, within some specified parameter limits. The gap statistic outperforms many other methods, including the methods proposed by Caliński and Harabasz (Citation1974), Hartigan (Citation1975), Krzanowski and Lai (Citation1988) and Kaufman and Rousseeuw (Citation1990).Footnote7 Importantly, it addresses the subjectivity associated with some other methods (e.g., the ‘elbow’ and ‘average silhouette’ methods) and is one of the most widely used methods across multiple disciplines (Mohajer et al., Citation2011). plots the gap statistic for different values of k. Note that the number of Monte Carlo (‘bootstrap’) samples was restricted to 100. The vertical line indicates the optimal number of clusters, using the parameter limits originally suggested by Tibshirani et al. (Citation2001). It suggests that k = 10. We also changed the parameter limits, as suggested by Maechler (Citation2012), but it did not affect the results.
Figure 1. Selecting k using gap statistic.
Note: The number of Monte Carlo (‘bootstrap’) samples is restricted to 100.
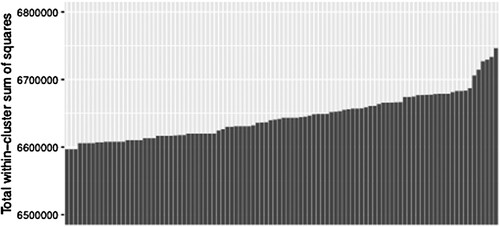
Third, we randomly reordered the SAL places in our dataset and reran the k-means clustering 100 times with k = 10. One of the limitations of k-means clustering is that the starting point can affect the solution (Celebi & Kingravi, Citation2015). To reduce this effect, we randomly reordered the SAL places in our dataset and reran the k-means clustering, which means the starting points were also randomized. For each of solution, we calculated the total within-cluster sum of squares and proceeded with the most compact solution (lowest total within-cluster sum of squares). plots the results. Note that the y-axis is limited to the range between 6.5 million and 6.8 million. The figure confirms that the starting point has an effect on the solution, and that some solutions are more compact than others. However, the variation is only around 2% and around 1% when outlier solutions are excluded.
Figure 2. Total within-cluster sum of squares for iterations of k-means clustering.
Source: Census 2011 Small Area Layer; authors’ own estimates.
Finally, we reviewed the 10 clusters to identify and differentiate neighbourhood types from other clusters. The algorithm maximizes variation between clusters and minimize variation within clusters. This means it will create outlier clusters or ‘bins’ in order not to contaminate other clusters. We identified two such bins: one in the centre of the space, where the outliers from other clusters converge (1); and another covering large institutions, such as hospitals and prisons, which are included in the census but using a different questionnaire (2). Combined the two bins make up 3% of the SAL places in our data. We include the bins in the maps and provide descriptive statistics in the supplemental data online. However, we do not treat them as neighbourhood types and therefore do not include them in our neighbourhood typology.
4.1. Sensitivity analysis
Before adopting the final cluster solution, we conducted a sensitivity analysis. First, we changed the standardization of variables from z-score standardization to range normalization. As already noted, z-score standardization is the most widely used. However, range normalization is less susceptible to outliers and skewed variables, which could affect the solution (Gale et al., Citation2016).Footnote8 Second, we changed the k-means initialization method from Hartigan and Wong (Citation1979) to Lloyd (Citation1981) and MacQueen (Citation1967). Lloyd (Citation1981) and MacQueen (Citation1967) are the most widely used initialization methods, although research has demonstrated that they often perform poorly and that there are better alternatives (Celebia et al., Citation2013).Footnote9 Third, we excluded correlated variables. We did so by creating a Pearson correlation matrix and removing variables with a correlation above and below a specified threshold. This approach follows Gale et al. (Citation2016). It reduced the number of variables from 315 to 245 (with a threshold of 0.8 and −0.8) and to 183 (with a threshold of 0.6 and −0.6). The results of the sensitivity analysis are reported in . In the right-hand column, we indicate the percent of SAL places that remain in the same cluster. Note that we reran each test 10 times and report the average percentage. confirms that the cluster solution is affected by the specifications, but the effect is less than 15%.
Table 1. Sensitivity test results.
5. A NEIGHBOURHOOD TYPOLOGY
We now turn to the description of our neighbourhood typology. As explained, the typology is the result of a k-means clustering, which produced eight distinct neighbourhood types, making up approximately 97% of South African metros. The remaining 3% consist of institutions and outliers with few common features. The purpose of the paper is not to provide an exhaustive description of each neighbourhood type but to propose the eight types as units of analysis for future comparative research and longitudinal tracking of neighbourhood change over time. While South Africa’s racist past has created demographic skews not necessarily found elsewhere, we believe the types will be relevant to other fast-growing cities in the Global South.
highlights some of the key features of the eight neighbourhood types. The ‘selected descriptors’ are derived from a heatmap of 75 variables, which is provided in the supplementary material. For ease of interpretation, we also provide a label for each of the neighbourhood types based on our interpretation. However, users of the typology are encouraged to review the full list of variables in considering how these neighbourhood types fit together. The neighbourhood types are ranked from first to last based on their average income status merely for purposes of ordering them.
Table 2. Neighbourhood types and selected descriptors.
show how the eight neighbourhood types (plus the two bins) are spread across the eight metros. Note that covers both Johannesburg and Ekurhuleni . The distinctive characteristics of each neighbourhood type combined with their spatial configuration make up the key components of the analysis.
Figure 3. Johannesburg (left) and Ekurhuleni (right).
Source: Census 2011 Small Area Layer; authors’ own estimates.
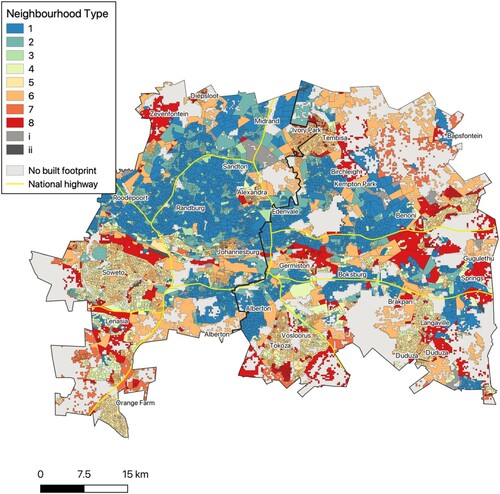
Figure 4. Tshwane.
Source: Census 2011 Small Area Layer; authors’ own estimates.
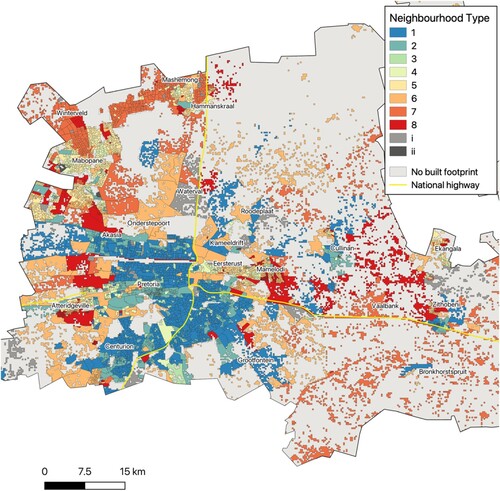
Figure 5. Cape Town.
Source: Census 2011 Small Area Layer; authors’ own estimates.
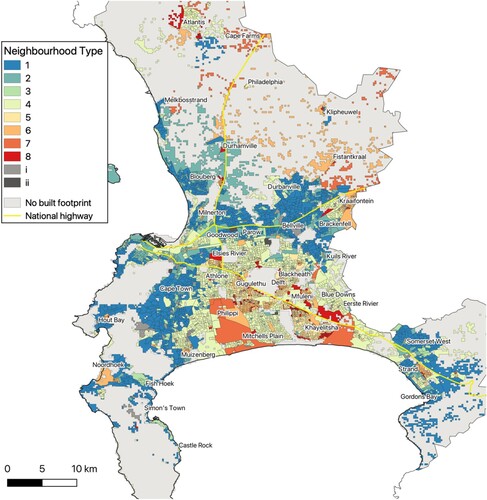
Figure 6. eThekwini.
Source: Census 2011 Small Area Layer; authors’ own estimates.
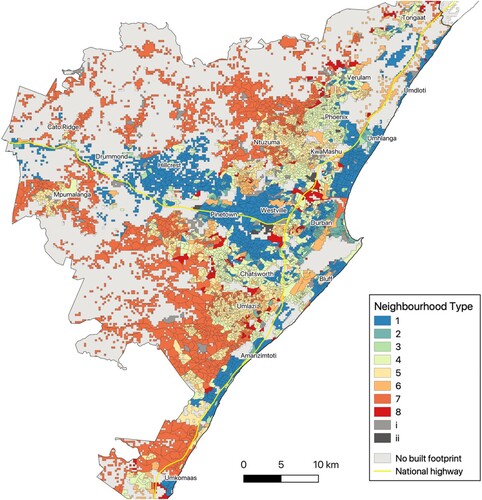
Figure 7. Nelson Mandela Bay.
Source: Census 2011 Small Area Layer; authors’ own estimates.
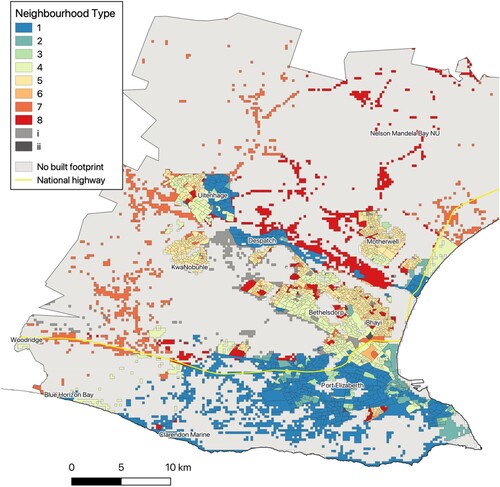
Figure 8. Buffalo City.
Source: Census 2011 Small Area Layer; authors’ own estimates.
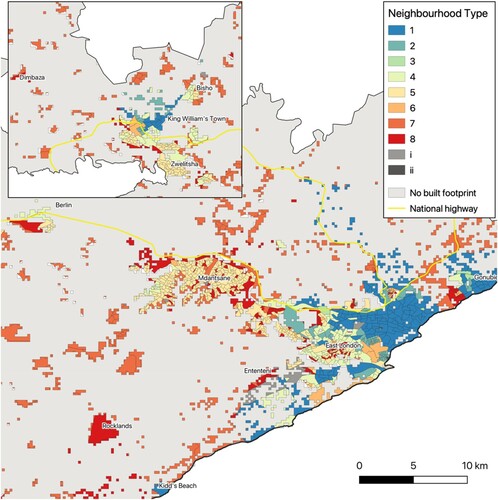
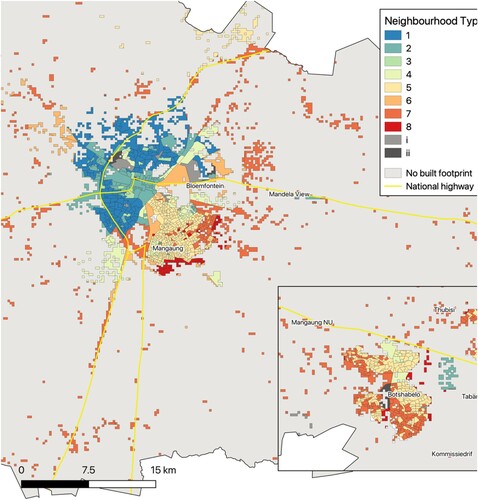
Figure 9. Mangaung.
Source: Census 2011 Small Area Layer; authors’ own estimates.
5.1. Type 1 neighbourhoods: places of wealth/white suburbia
Type 1 neighbourhoods are places of wealth. They have the highest average income of any neighbourhood type. The affluence of type 1 residents has clear implications for their lifestyle choices with higher levels of marriage and divorce, higher levels of asset ownership, and access to luxury goods. They can afford to live in large freestanding houses (81%) and are predominantly white (67%). Around one-third (35%) have tertiary education and 70% are employed: the highest employment rate for any neighbourhood type.
Type 1 neighbourhoods make up around 19% of the SAL places in our data. However, they comprise only 15% of the population. Many type 1 neighbourhoods are found within the gated communities that sprang up across South Africa in the 1990s and 2000s; or in lifestyle estates, eco-estates and similar enclosed and enclave spaces. In Johannesburg, type 1 neighbourhoods cover most of the northern suburbs (e.g., Randburg and Sandton), while in Cape Town there are concentrations in the southern suburbs (e.g., Rondebosch and Constantia) and along the Atlantic seaboard (e.g., Sea Point, Camps Bay, and Hout Bay).
5.2. Type 2 neighbourhoods: places of upward mobility/the emerging middle class
Type 2 neighbourhoods host the emerging middle class. Average incomes are relatively high, although lower than those in type 1 neighbourhoods. The residents are younger and more diverse (31% white and 53% Black/African). Combined, this suggests upward social and economic mobility, enabled by tertiary education (38%) and the opportunities given to young, previously disadvantaged South Africans after 1994.
Type 2 neighbourhoods make up 10% of the SAL places in our data. They are typically located on the margins of white suburbia, where residents can access smaller and cheaper quality housing. Type 2 neighbourhoods have the highest concentration of apartments (35%) and the second lowest concentration of freestanding houses (35%). In Johannesburg, type 2 neighbourhoods are found in the northwest (e.g., Northriding, Randpark Ridge, and Roodepoort), while in both Cape Town and eThekwini, there are large concentrations in the city centre.
5.3. Type 3 neighbourhoods: places of withdrawal/affluent pensioners
Type 3 neighbourhoods are places of withdrawal, hosting affluent pensioners. They have the clearest demographic profile of any neighbourhood type. Average incomes are relatively high, although still lower than those of type 1 and 2 neighbourhoods. The residents are older (48% are aged 60+) and predominantly white (74%), and they are more likely to be taking chronic medication or to report problems with walking, seeing, moving generally, etc. Many (45%) live in single person households and one-fifth (20%) are widowed. Along with type 1 residents, type 3 residents are the most likely to say they have witnessed no major changes in their community, reminding us of the service levels white areas enjoyed under apartheid.
Type 3 neighbourhoods are the rarest type that emerged from our clustering, accounting for only 1% of the SAL places in our data. They typically appear as pockets within larger patches of type 1 neighbourhoods. This pattern is visible in all the larger metros, including Cape Town (e.g., Constantia), eThekwini (e.g., Durban North and Westville) and Johannesburg (e.g., Randburg and Sandton).
5.4. Type 4 neighbourhoods: racial enclaves/the township middle class
Type 4 neighbourhoods are among the most iconic townships in South Africa. Their formation dates back to the 1950s, where they were designated as ‘group areas’. Their most distinctive feature is the racialized character of their residents, who are Coloured (42%), Black African (34%), or Indian or Asian (18%). Most type 4 households can be described as middle class, with moderately higher incomes than the average. Employment rates are relatively high (60%), although less than half (40%) of type 4 resident have secondary education. Type 4 neighbourhoods are highly serviced, and most dwellings are freestanding (76%) and owned (69%), while some (9%) are semi-detached, a particular feature of densified ‘group area’ townships. Type 4 neighbourhoods are quite stable, with 81% of homes likely to have remained in the family for decades.
Type 4 neighbourhoods make up 15% of the SAL places in our data. In Johannesburg, they are mainly located in the south (e.g., Lenasia and Eldorado Park); in Cape Town notably in the Cape Flats (e.g., Athlone and Mitchells Plain); and in eThekwini in clearly defined areas to the north and southwest of city centre (e.g., Phoenix and Chatsworth). Type 4 neighbourhoods are located relatively far from the city centre and economic opportunities, and even further from the predominantly white neighbourhoods described above.
5.5. Type 5 neighbourhoods: places of unemployment/large established townships
Type 5 neighbourhoods are the large established townships. Like the racial enclaves described above, they are a product of South Africa’s history. They are predominantly Black/African (94%), with a large number of youth (20%). Average incomes range from low to lower middle. Type 5 neighbourhoods have the second lowest employment rate (36%) of any neighbourhood type. Households are generally asset poor, and many (45%) are headed by women. Although type 5 neighbourhoods tend to be well serviced, the dwelling type tends to be informal. This model of urban settlement servicing falls on the spectrum of urban residential provision and is typical of other large urban informal areas which are classified as ‘upgraded’.
Type 5 neighbourhoods make up 24% of the SAL places in our data. This is the most common type of neighbourhood across all metros, covering large parts of Cape Town (e.g., Gugulethu and Khayelitsha), Ekurhuleni (e.g., Duduza), eThekwini (e.g., Umlazi) and Johannesburg (e.g., Soweto and Orange Farm). They are generally located far from the city centre, often separated by natural and constructed barriers. The peripheral location of type 5 neighbourhoods, coupled with their fixity in the urban landscape, means that the residents are confined to spaces with limited access to educational and economic opportunities.
5.6. Type 6 neighbourhoods: places of transition/poor neighbourhoods with backyard dwellings
Type 6 neighbourhoods are in many ways similar to the large established townships described above. They are predominantly Black/African (95%), poor, and located mostly in outer urban areas. However, there are also some notable differences. First, there are more domestic and foreign migrants. Second, homes are smaller, more people live in rental units, and there are more backyard dwellings (15%) without basic services. Finally, their location is more diverse, including some older, inner-city neighbourhoods and some lower density, outlying settlements. Consequently, these communities tend to be less stable and more fluid than many established townships.
Type 6 neighbourhoods make up 12% of the SAL places in our data. It is the dominant neighbourhood type in Johannesburg’s inner city and some of the larger townships in Gauteng (e.g., Alexandra, Ivory Park, Tembisa, and parts of Soweto). They are also apparent in Tshwane’s inner city and the townships east and west of the city (e.g., Mamelodi and Atteridgeville). They are less common in Cape Town, although there are concentrations in the Cape Flats (e.g., Browns Farm and Nyanga). They are unusual in eThekwini, apart from selected locations in the inner-city and northwest of the city centre (e.g., Clermont).
5.7. Type 7 neighbourhoods: places of entrenched poverty/peri-urban traditional settlements
Type 7 neighbourhoods are very distinctive in terms of their peripheral location, low population density, and limited access to basic services. The population is almost entirely Black/African (96%). Average incomes are low and employment rates extremely low (50%). The deprivation is apparent in the lack of household assets, poor health, and poor education. Type 7 residents are relatively immobile. Many households lack a formal residential address as they occupy areas under traditional land ownership, many of which were former homelands under apartheid. They are essentially rural communities engaged in subsistence farming.
Type 7 neighbourhoods make up 8% of the SAL places in our data. The highest concentration of these neighbourhoods is in eThekwini, which has a large hinterland of traditional areas, many of which were in the former homeland of KwaZulu. They pose many dilemmas for municipal service delivery because of their peripheral location and low densities. Yet social needs are high and public health is poor.
5.8. Type 8 neighbourhoods: places of extreme poverty and vulnerability/informal settlements
Type 8 neighbourhoods are places of extreme poverty and vulnerability. Unemployment rates are very high (over 40%) and average incomes are very low. Households lack durable assets such as fridges and televisions. Type 8 neighbourhoods are almost entirely Black/African (97%) and education levels are low. Most households (85%) live in shack structures and lack a residential address as they occupy areas that have not been formally designated for residential use. Their informal status also explains their poor access to basic services.
Type 8 neighbourhoods make up 12% of the SAL places in our data. The largest concentration is in Ekurhuleni and Johannesburg, where they essentially take two forms: either surrounding existing townships (e.g., Lenasia, Tembisa, and Tokoza) or occupying unused land (e.g., mine dumps), which is often dolomitic and hazardous. These neighbourhoods are also reasonably common in Buffalo City and Tshwane, where they occupy similar kinds of location.
6. INTERNAL DIFFERENTIATION AND RESIDENTIAL SEGREGATION
This section extends the description of the eight neighbourhood types and distils some higher level findings about the internal differentiation and residential segregation of South African metros.
6.1. Multidimensional segregation
The k-means clustering reveals the multi-dimensional and inter-generational character of urban segregation.Footnote10 Consistent with the idea of a ‘vicious circle of inequality and segregation’ (OECD, Citation2018), it is apparent that neighbourhood inequality is transmitted through a complex interplay of physical, social, demographic, and economic dynamics (see also van Ham et al., Citation2014). In particular, there is a strong two-way relationship between people and place. Economic and social inequalities, specifically related to education and the professionalization of the workplace, compound each other in neighbourhoods, and in a manner that reinforces local advantage or disadvantage. For example, while few residents have tertiary education in neighbourhood types 4–8, a university degree is common in neighbourhood types 1–3. This variation is mirrored in unemployment rates, which are only 7.5% for residents in type 1–3 neighbourhoods, compared with 40% and above for residents in types 4–8 neighbourhoods. Neighbourhood types with higher unemployment rates also tend to be located further from prime economic nodes. A general lack of economic dynamism means that sorting effects have brutal spatial outcomes since there are few opportunities for advancement and limited churn (Budlender & Royston, Citation2016; Zoch, Citation2017).
The state has a critical role to play in breaking this ‘vicious circle’, by realizing its constitutional mandate to provide access to housing, land, health, water, education, and food. In theory, poorer and richer neighbourhoods should score similarly in their level of access to core public services. However, our findings demonstrate that provision varies significantly across neighbourhood types, with poorer communities often experiencing only partial access to basic services. Rapid densification, informality, and limited public–private investments put poorer communities under intense pressure and compromise the quality of life. Meanwhile, affluent households can buy their way into neighbourhoods that are safer, better planned, and have higher levels of public and private service provision. They can opt out of public services by paying for private schooling, healthcare and security, which accentuates the socio-economic divides even further.
6.2. The enduring salience of race
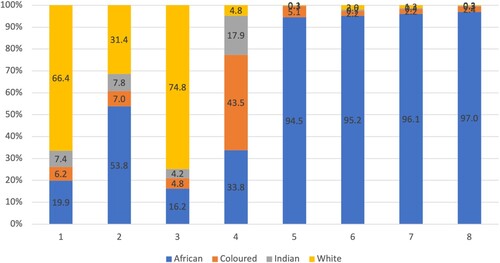
More than 20 years after the end of apartheid, the role of race in urban segregation remains pertinent. Our inductive, data-driven approach offers new evidence of the enduring salience of race in South African cities. Race covers only 10 of the 330 variables in our data, which means there is no reason to expect race to be the primary partitioning factor. However, as demonstrates, race remains highly significant in characterizing neighbourhood types. In the wealthiest neighbourhoods (type 1), close to two-thirds (66%) of the residents are white, while only one-fifth (20%) are Black/African. For the entire metro population, it is the other way round. In poorer neighbourhoods, racial segregation is even more extreme. Types 5–8 neighbourhoods are almost exclusively Black/African (more than 95%), which means the residents experience ‘hypersegregation’ at the neighbourhood level (Geyer & Mohammed, Citation2016).
Figure 10. Racial breakdown by neighbourhood type.
Source: Census 2011; authors’ own estimates.
It would be wrong to conclude that these patterns of racial segregation are evidence of continuing apartheid-style discrimination. Rather, the lack of transformation highlights the limited success of post-apartheid urban policy to promote racial integration (Maharaj, Citation2020). Yet, in every city there are some areas that have become more permeable with black elites moving into historically white neighbourhoods. Type 2 neighbourhoods are the most obvious example. Acknowledging and studying these disruptions is important in developing a more nuanced understanding of urban change (Schensul & Heller, Citation2011). One area of significant racial transformation has been the inner-cities, where capital flight since the 1990s has enabled a large influx of low to middle income black households (Turok et al., Citation2021). However, this is a consequence of urban decay rather than any proactive attempt at integrating previously exclusive neighbourhoods.
6.3. Inequality and spatial segregation
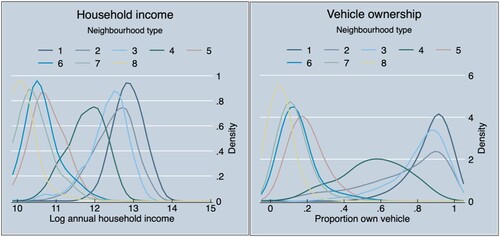
South African cities have not broken away from the past, even if some neighbourhoods have become more racially diverse. This is a salutary reminder to policymakers of the power of market forces and place-based inertia, despite a progressive vision for integration (Maharaj, Citation2020). The continuous social polarization at the neighbourhood level is related to South Africa’s stubbornly high level of income and wealth inequalities.Footnote11 As illustrates, the relationship between neighbourhood types and household income is polarized with a set of relatively affluent neighbourhoods (types 1–4) grouped together to the right and a group of relatively poorer neighbourhoods (types 5–8) concentrated to the left.Footnote12 The separation between rich and poor is even more pronounced when considering vehicle ownership as an alternative measure of social status.
Figure 11. Social status and neighbourhood clusters.
Note: Kernel density distributions.
Source: Census 2011; authors’ own estimates.
These socio-economic inequalities imprint themselves in the urban landscapes. As elsewhere in the world, high income neighbourhoods concentrate in attractive coastal regions, enclaves, or well-located areas of the city (Caldeira, Citation2000). We see the same pattern in South Africa, where the best-served (and most temperate) land is overwhelmingly occupied by richer neighbourhoods (types 1–4). By contrast, lower income neighbourhood types are overwhelmingly found in areas previously kept separate for non-whites; and is snaking its way into major urban conurbations often by informal channels and strategies (Katumba & Everatt, Citation2021). Apartment buildings in the inner-city of Johannesburg, for example, have the highest densities in South Africa, and some even rent bed spaces by 12-hour shifts, maintaining a 24-hour income for the landlord. The fringes of cities are spaces for poor people to try find a toehold, whether in formal or informal dwellings.
6.4. A baseline for future comparative research
As already pointed, our methodological approach is inspired by Delmelle (Citation2015) and others. A strength of this approach is the ability to compare and contrast neighbourhood types, both within and between cities, in a quantifiable manner. shows the distribution of neighbourhood types across the eight metros (weighted according to their population shares). The three Gauteng metros (Johannesburg, Ekurhuleni and Tshwane) together with Cape Town have more households and residents in types 1 and 2 neighbourhoods, which are the wealthiest. This points to the relative economic size and strength of Gauteng and to a lesser extent Cape Town. The higher share of type 2 neighbourhoods in Johannesburg and Tshwane suggests these are the metros where racial integration is gradually happening and where younger South Africans from previously disadvantaged groups go to climb the social ladder.
Figure 12. Population distribution of neighbourhood types across metros.
Note: JHB, Johannesburg; EKU, Ekurhuleni; TSH, Tshwane; CPT, Cape Town; ETH, eThekwini; NMB, Nelson Mandela Bay; BC, Buffalo City; and MAN, Mangaung.
Source: Census 2011; authors’ own estimates.
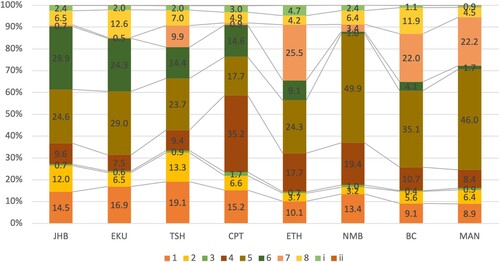
The distinctive racial character of each of the metros comes through in the size variation of type 4 neighbourhoods (racial enclaves/the township middle class). Cape Town has a large Coloured community, with many type 4 neighbourhoods in and around the Cape Flats, whilst eThekwini has a large Indian population, with a concentration of type 4 neighbourhoods in Phoenix and Chatsworth. Another important difference is the prevalence of peri-urban settlements (type 8 neighbourhoods). Official city boundaries in metros such as eThekwini, Tshwane, Buffalo City and Mangaung incorporate vast segments of former tribal land. These poorer communities are located on the urban fringe at low population densities and often on communal land which represents a unique governance challenge for local authorities.
Larger metros (Johannesburg, Ekurhuleni, Tshwane and Cape Town) stand in contrast to smaller metros (Nelson Mandela Bay, Buffalo City and Mangaung) with regard to type 7 neighbourhoods. Informal backyard dwellings have mushroomed in Cape Town and metros in Gauteng, attracting growing interest from scholars and policy makers (Hamann et al., Citation2018; Scheba & Turok, Citation2020). Interestingly, the largest metros are not necessarily associated with a higher proportion of people living in informal settlements (type 8 neighbourhoods). Land occupations have been fairly tightly controlled by local authorities in South Africa although there is evidence of a spike in new occupations since the onset of the COVID-19 induced economic crisis (Paton, Citation2021).
7. CONCLUSIONS
This paper tests the efficacy of a data-driven approach to developing neighbourhood typologies for cities in the Global South. It uses k-means clustering to identify neighbourhood types based on a wide array of variables. Neighbourhood types are formed inductively, without theoretical priors, allowing the algorithm to identify factors that hold places most strongly together. We employed this methodology specifically in the context of South Africa, drawing on census data, and identified eight distinct neighbourhood types that are common across the eight largest cities. Each has distinct demographic, socio-economic, structural and infrastructural characteristics, but together they cover the entire socio-economic and spatial spectrum of the eight metros.
This approach generates new insights into the material and social fabric of South African cities, producing a more nuanced picture of different neighbourhood types, extending our knowledge beyond simple yet commonly used categories of ‘poor’, ‘low-income’ or ‘wealthy’ settlements. By comparing neighbourhood types along key variables – income, race, education, location – we demonstrate the multi-dimensional and persistent nature of socio-economic inequalities and residential segregation. We show that neighbourhood inequality is transmitted through a complex interplay of physical, social, demographic and economic dynamics, supporting other arguments that disrupting the ‘vicious circle of inequality and segregation’ requires extraordinary policy and political measures. While we identify important spaces of change, our analysis confirms the enduring salience of race within the post-apartheid transition to class-based segregation.
We use South Africa to illustrate the methodological contribution of the paper. While most quantitative studies use one-dimensional variables to understand neighbourhood differentiation and change – usually based on income, class, or the built environment – our methodology offers a more sophisticated and multi-dimensional approach to identifying and comparing neighbourhood types across and within cities. We believe this approach has significant potential to advance a more systematic and nuanced analysis of the (changing) internal formation and characteristics of cities. This could also help to devise better policies to reduce inter- and intra-urban inequalities and promote more sustainable urban development.
Supplemental Material
Download MS Word (56.9 KB)DISCLOSURE STATEMENT
No potential conflict of interest was reported by the authors.
Additional information
Funding
Notes
1 For an overview of the ‘urban age’ literature, see Brenner and Schmid (Citation2014).
2 Galster (Citation2001) lists environmental, political, social–interactive and sentimental characteristics as other spatially based attributes that define neighbourhoods. Including such attributes would require additional public opinion data, which unfortunately were not available.
3 The literature can be traced back to Shevky and Bell (Citation1955). See Delmelle (Citation2022) for a recent overview of the literature.
4 Summary statistics are provided in the supplemental data online.
5 A new census will be completed in 2022. However, census data are expected to be released only in 2023.
6 Individual-level variables, such as gender, race and education, were divided by the total population of the SAL place. Household-level variables, such as electricity source and dwelling type, were divided by the total number of households.
7 See Tibshirani et al. (Citation2001) for a comparison.
8 A series of histograms and Shapiro–Wilk tests (Shapiro & Wilk, Citation1965) revealed a large number of outliers and varying degrees of skew.
9 Hartigan and Wong (Citation1979) is now the default initialization method in many k-means clustering packages.
10 If neighbourhoods are more or less homogenous, or if their distinctive features tend to be diluted when selecting across variables, we could then anticipate little variety in z-scores or at least only a handful of significant variables. Instead, the supplemental data online presents an extensive matrix of strongly correlated factors which suggests that local diversity tends to be compounded rather than thinned out when sorting between neighbourhoods.
11 The census of 2011 collects fairly crude data about total household income based upon a one-shot question of all sources of income which is recorded in income bands. Ownership of a motor vehicle is reported as a complementary measure of socio-economic status.
12 The exception is type 5 with a relatively flat distribution, which suggests that neighbourhoods in this cluster are not clearly differentiated by income. This neighbourhood type makes up less than 3% of all households.
REFERENCES
- Acuto, M., Larcom, S., Keil, R., & Ghojeh, M. (2020). Seeing COVID-19 through an urban lens. Nature Sustainability, 3(12), 977–978. https://doi.org/10.1038/s41893-020-00620-3
- Alkan, H., & Maksudyan, N. (2020). Introduction. In H. Alkan, & N. Maksudyan (Eds.), Urban neighbourhood formations, boundaries, narrations and intimacies (pp. 1–14). Routledge.
- Anderson, M. B. (2017). Neighbourhood. In D. Richardson, N. Castree, & M. F. Goodchild (Eds.), The international encyclopaedia of geography. John Wiley and Sons.
- Baffoe, G. (2019). Understanding the neighbourhood concept and its evolution: A review. Environment and Urbanization Asia, 10(2), 393–402. https://doi.org/10.1177/0975425319859115
- Brenner, N., & Schmid, C. (2014). The ‘urban age’ in question. International Journal of Urban and Regional Research, 38(3), 731–755. https://doi.org/10.1111/1468-2427.12115
- Budlender, J., & Royston, L. (2016). Edged out: Spatial mismatch and spatial justice in South Africa’s main urban areas. Socio Economic Rights Institute of South Africa.
- Caldeira, T. P. R. (2000). City of walls: Crime, segregation and citizenship in Sao Paulo. University of California Press.
- Caliński, T., & Harabasz, J. (1974). A dendrite method for cluster analysis. Communications in Statistics – Theory and Methods, 3(1), 1–27. https://doi.org/10.1080/03610927408827101
- Celebi, M. E., & Kingravi, H. A. (2015). Linear, deterministic, and order-invariant initialization methods for the K-means clustering algorithm. In M. E. Celebi (Ed.), Partitional clustering algorithms (pp. 79–98). Springer.
- Celebia, M. E., Kingravi, H. A., & Vela, P. A. (2013). A comparative study of efficient initialization methods for the k-means clustering algorithm. Expert Systems with Applications, 40(1), 200–210. https://doi.org/10.1016/j.eswa.2012.07.021
- Chetty, R., & Hendren, N. (2018). The impacts of neighbourhoods on intergenerational mobility II: Country-level estimates. The Quarterly Journal of Economics, 133(3), 1163–1228. https://doi.org/10.1093/qje/qjy006
- Delmelle, E. C. (2015). Five decades of neighborhood classifications and their transitions: A comparison of four US cities, 1970–2010. Applied Geography, 57, 1–11. https://doi.org/10.1016/j.apgeog.2014.12.002
- Delmelle, E. C. (2017). Differentiating pathways of neighborhood change in 50 U.S. metropolitan areas. Environment and Planning A: Economy and Space A, 49(10), 2402–2424. https://doi.org/10.1177/0308518X17722564
- Delmelle, E. C. (2022). No GIScience and neighborhood change: Toward an understanding of processes of change. Transactions in GIS, 26(2), 567–584. https://doi.org/10.1111/tgis.12871
- Everatt, D., & Ebrahim, Z. (2020). Urban policy in South Africa. In D. Kundu, R. Sietchiping, & M. Kinyanjui (Eds.), Developing national urban policies: Ways forward to green and smart cities (pp. 281–298). Springer.
- Gale, C. G., Singleton, A. D., & Bates, A. G. (2016). Creating the 2011 area classification for output areas (2011 OAC). Journal of Spatial Information Science, 12, 1–27. https://doi.org/10.5311/JOSIS.2016.12.232
- Galster, G. C. (2001). On the nature of neighbourhood. Urban Studies, 38(12), 2111–2124. https://doi.org/10.1080/00420980120087072
- Geyer, H. S., & Mohammed, F. (2016). Hypersegregation and class-based segregation processes in Cape Town 2001–2011. Urban Forum, 27(1), 35–38. https://doi.org/10.1007/s12132-015-9264-6
- Government of South Africa. (2000). The integrated sustainable rural development strategy. Retrieved July 21, 2021, from https://www.gov.za/sites/default/files/gcis_document/201409/isrds0.pdf
- Hamann, C., Mkhize, T., & Gotz, G. (2018). Backyard and informal dwellings 2001–2016. Retrieved July 21, 2021, from https://www.gcro.ac.za/outputs/map-of-the-month/detail/backyard-and-informal-dwellings-2001-2016/
- Hartigan, J. (1975). Clustering algorithms. Wiley.
- Hartigan, J. A., & Wong, M. A. (1979). Algorithm AS 136: A K-means clustering algorithm. Applied Statistics, 28(1), 100–108. https://doi.org/10.2307/2346830
- Hincks, S. (2015). Neighbourhood change and deprivation in the Greater Manchester city-region. Environment and Planning A: Economy and Space, 47(2), 430–449. https://doi.org/10.1068/a130013p
- Hincks, S. (2017). Deprived neighbourhoods in transition: Divergent pathways of change in the Greater Manchester city-region. Urban Studies, 54(4), 1038–1061. https://doi.org/10.1177/0042098015619142
- Jerven, M. (2013). Poor numbers. Cornell University Press.
- Katumba, S., & Everatt, D. (2021). Urban Sprawl and Land Cover in Post-apartheid Johannesburg and the Gauteng City-Region, 1990–2018. Environment and Urbanization ASIA, 12(1 suppl), S147–S164. https://doi.org/10.1177/0975425321997973.
- Kaufman, L., & Rousseeuw, P. (1990). Finding groups in data: An introduction to cluster analysis. Wiley.
- Kearns, A., & Parkinson, M. (2001). The significance of neighbourhood. Urban Studies, 38(12), 2103–2110. https://doi.org/10.1080/00420980120087063
- Krzanowski, W., & Lai, Y. (1988). A criterion for determining the number of groups in a data set using sum-of-squares clustering. Biometrics, 44(1), 23–34. https://doi.org/10.2307/2531893
- Lloyd, S. P. (1981). Least squares quantization in PCM. EEE Transactions on Information Theory, 28(2), 129–137. https://doi.org/10.1109/TIT.1982.1056489
- MacQueen, J. (1967). Some methods for classification and analysis of multivariate observations. Berkeley Symposium on Mathematical Statistics and Probability, 5(1), 281–297.
- Madden, D. J. (2014). Neighborhood as spatial project: Making the urban order on the downtown Brooklyn waterfront. International Journal of Urban and Regional Research, 38(2), 471–497. https://doi.org/10.1111/1468-2427.12068
- Maechler, M. (2012). firstSEmax. Retrieved July 20, 2022, from https://www.rdocumentation.org/packages/cluster/versions/2.1.3/topics/clusGap
- Maharaj, B. (2020). The apartheid city. In R. Massey, & A. Gunter (Eds.), Urban geography in South Africa: Perspectives and theory (pp. 39–54). Springer.
- Martin, D. G. (2003). Enacting neighbourhood. Urban Geography, 24(5), 361–385. https://doi.org/10.2747/0272-3638.24.5.361
- Mikelbank, B. A. (2011). Neighborhood déjà vu: Classification in metropolitan Cleveland, 1970–2000. Urban Geography, 32(3), 317–333. https://doi.org/10.2747/0272-3638.32.3.317
- Mohajer, M., Englmeier, K.-H., & Schmid, V. J. (2011). A comparison of Gap statistic definitions with and without logarithm function. arXiv preprint arXiv:1103.4767.
- OECD. (2018). A multi-level model of vicious circles of socio-economic segregation. In Divided cities: Understanding intra-urban inequalities. Paris: OECD Publishing.
- Paton, C. (2021, May 12). Government to spend R45m to move people off railway lines, says Mbalula. Business Day.
- Reibel, M. (2011). Classification approaches in neighborhood research: Introduction and review. Urban Geography, 32(3), 305–316. https://doi.org/10.2747/0272-3638.32.3.305
- Sampson, R. J. (2019). Neighbourhood effects and beyond: Explaining the paradoxes of inequality in the changing American metropolis. Annual lecture paper. Urban Studies, 56(1), 3–32. https://doi.org/10.1177/0042098018795363
- Scheba, A., & Turok, I. (2020). Informal rental housing in the south: Dynamic but neglected. Environment and Urbanization, 32(1), 109–132. https://doi.org/10.1177/0956247819895958
- Schensul, D., & Heller, P. (2011). Legacies, change and transformation in the post-apartheid city: Towards an urban sociological cartography. International Journal of Urban and Regional Research, 35(1), 78–109. https://doi.org/10.1111/j.1468-2427.2010.00980.x
- Shapiro, S. S., & Wilk, M. B. (1965). An analysis of variance test for normality (complete samples). Biometrika, 52(3–4), 591–611. https://doi.org/10.1093/biomet/52.3-4.591
- Shevky, E., & Bell, W. (1955). Social area analysis: Theory, illustrative application and computational procedures. Stanford University Press.
- Soja, E. W. (1980). The socio-spatial dialectic. Annals of the Association of American Geographers, 70(2), 207–225. https://doi.org/10.1111/j.1467-8306.1980.tb01308.x
- Strauss, M. (2019). A historical exposition of spatial injustice and segregated urban settlement in South Africa. Fundamina, 25(2), 135–168. https://doi.org/10.17159/2411-7870/2019/v25n2a6
- Tibshirani, R., Walther, G., & Hastie, T. (2001). Estimating the number of data clusters via the gap statistic. Journal of the Royal Statistical Society B, 63(2), 411–423. https://doi.org/10.1111/1467-9868.00293
- Turok, I., & Scheba, A. (2018). ‘Right to the city’ and the New Urban Agenda: Learning from the right to housing. Territory, Politics, Governance, 7(4), 494–510. https://doi.org/10.1080/21622671.2018.1499549
- Turok, I., Seeliger, L., & Visagie, J. (2021). Restoring the core? Central city decline and transformation in the South. Progress in Planning, 144, 1–35. https://doi.org/10.1016/j.progress.2019.100434
- van Ham, M., Hedman, L., & Manley, D. (2014). Intergenerational transmission of neighbourhood poverty: An analysis of neighbourhood histories of individuals. Transactions of the Institute of Geographers, 39(3), 402–417. https://doi.org/10.1111/tran.12040
- Van Ham, M., Tammaru, T., Ubareviciene, R., & Janssen, H. (Eds.). (2021). Urban socio-economic segregation and income inequality: A global perspective. Springer.
- Wang, Y. P., & Kintrea, K. (2019). Sustainable, healthy and learning cities and neighbourhoods. Environment and Urbanization Asia, 10(2), 146–150. https://doi.org/10.1177/0975425319859129
- Wu, J. (2012). Advances in K-means clustering. Springer.
- Zoch, A. (2017). The effect of neighbourhoods and school quality on education and labour market outcomes in South Africa. Stellenbosch Economic Working Papers WP08/2017.