
 ?Mathematical formulae have been encoded as MathML and are displayed in this HTML version using MathJax in order to improve their display. Uncheck the box to turn MathJax off. This feature requires Javascript. Click on a formula to zoom.
ABSTRACT
Although the coronavirus disease of 2019 arguably changed citizens’ transportation mode choices, how these choices changed and what factors influenced them, especially during the soft intervention period, remains ambiguous. To clarify this phenomenon, this study examined how citizens’ socio-demographic and psychological factors contributed to their transportation mode changes (public transportation, active transportation: walking and cycling, and cars) between 2019 and 2020. We employed the extended theory of the norm activation model and the value–attitude–behaviour hierarchy, surveyed 973 citizens in Toyama City, Japan, and applied a confirmatory factor analysis and a multinomial logistic regression model. Regarding psychological characteristics, the findings showed that those with positive attitudes toward public transportation tended to shift to public transportation; those with high personal norms for car use tended to shift to public transportation; those with perceived behavioural control over car use tended not to change to public transportation; and those with positive attitudes toward car use tended not to shift to active transportation. Socio-demographically, respondents who were female, highly educated and/or whose income decreased from the previous year tended to shift to active transportation. Age was not significantly associated with transportation mode changes. No significant variable was found between respondents’ shift to cars and socio-demographic and psychological factors. Our study provides implications, suggesting that policymakers focus on adopting measures to retain female or highly educated individuals in the active transportation mode use even beyond the pandemic period, while raising awareness among men, informing them of the health benefits of the active transportation mode and establishing active transportation mode-friendly infrastructure.
JEL:
1. INTRODUCTION
The coronavirus disease 2019 (COVID-19) pandemic considerably impacted transportation mode choices (Das et al., Citation2021a; Tarasi et al., Citation2021). As the virus is highly contagious, governments worldwide adopted various preventive measures to reduce social contact (Rasca et al., Citation2021). Some countries, including China, Italy and Spain, imposed hard lockdowns, whereas other countries, including Japan, the Netherlands and Sweden, adopted ‘intelligent lockdowns’ (Shakibaei et al., Citation2021), or soft behavioural interventions, such as communication campaigns to reduce non-essential travel (Hara & Yamaguchi, Citation2021) and implementing social distancing, that is, maintaining 1.5–2 m physical distance from others (Gkiotsalitis & Cats, Citation2021). Both hard and soft measures reduced human mobility and changed travel patterns (Borkowski et al., Citation2021). Notably, public transportation (PublicT) use was considered unsafe and PublicT ridership typically decreased by 80–95% globally in the early stages of interventions (Eisenmann et al., Citation2021; Rothengatter et al., Citation2021; Schmidt et al., Citation2021; Tiikkaja & Viri, Citation2021).
In the UK, for example, the use of rail services dropped to below 5% and that of bus services declined to 11–12% of pre-pandemic levels (Vickerman, Citation2021). Car use in many cities also reduced during the initial period because individuals were urged to work from home, although car travel soon increased again to the pre-lockdown level, whereas PublicT use remained low (van der Drift et al., Citation2021). If this trend continues, cars might become an even more dominant transportation mode, thereby worsening traffic congestion and air pollution (Shakibaei et al., Citation2021), which may exacerbate the adverse effects of respiratory and pulmonary diseases (Travaglio et al., Citation2021).
The reduced PublicT use and increased car use were accompanied by a relative increase in the utilization of active transportation (ActiveT) modes such as walking and cycling (Monterde-i-Bort et al., Citation2022; Nikiforiadis et al., Citation2022; Schmidt et al., Citation2021; van der Drift et al., Citation2021). Citing data sourced from Eco-Counter, which provides pedestrian and bicycle counting solutions, Buehler and Pucher (Citation2021) calculated, on average, 8%, 16% and 3% increases in cycling levels in the European Union (EU), the United States and Canada, respectively, compared with the pre-pandemic levels. Thus, citizens’ transportation modes evidently changed because of preventive measures during the pandemic. However, to the best of our knowledge, no study has examined how these changes have come into effect and what factors influenced them, especially during the soft preventive intervention period.
Our study addresses this deficit by answering the following questions: What transportation mode did citizens choose to use during the period of soft pandemic interventions (Tarasi et al., Citation2021)? Were there any significant differences in transportation mode changes according to socio-demographic (Borkowski et al., Citation2021) and psychological factors (Das et al., Citation2021b)? The answers to these questions are important for policymakers to prepare, manage and develop transportation strategies amid the COVID-19 pandemic. With respect to future pandemics, the findings may inform policy decision-making regarding different transportation modes and encourage the adoption of healthier and more sustainable lifestyles for citizens (Rasca et al., Citation2021; Zhang & Fricker, Citation2021) because population subgroups defined by differences in socio-demographics and psychological aspects may have resorted to different degrees of transportation mode changes (Iio et al., Citation2021).
This study is distinct from previous studies, which primarily investigated the pandemic’s impact using location data from smart phones and ignored socio-demographic and psychological data, especially those of the elderly population, because smart phone use is not universal (Borkowski et al., Citation2021). In contrast, this study focuses how citizens’ transportation mode changes are related to socio-demographic and psychological factors. It is also novel that this study analyses the association between transportation mode changes and income changes before and during the pandemic. The research location is Toyama City, Japan, which adopted soft preventive measures during the pandemic.
The remainder of this article is structured as follows. Section 2 describes the current study’s context. Section 3 reviews the roles of socio-demographic factors in transportation mode choices. To help examine psychological factors in the context of transportation mode use, section 4 explains our theoretical framework, which is based on the extended theory of the norm activation model (NAM) and value–attitude–behaviour (VAB) hierarchy. Section 5 describes the research methodology. Section 6 presents the results. The theoretical and practical implications are discussed in section 7. The study concludes in section 8.
2. STUDY CONTEXTS
Japan has experienced several peaks in COVID-19 infections since March 2020. The country has relied on soft restrictions, such as the declaration of a state of emergency and requests for the population to engage in social distancing measures, without penalties for non-compliance (Rothengatter et al., Citation2021). Nevertheless, the impact of these soft measures on PublicT use has been marked. When a state of emergency was declared in April and May 2020 amid the first COVID-19 wave, the use of PublicT plummeted to less than 20% of the pre-pandemic level (Kanda, Citation2021).
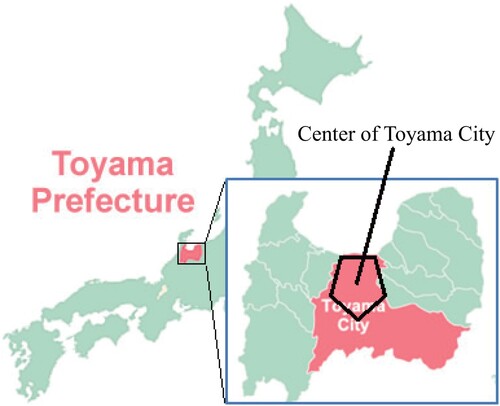
Toyama City presents an interesting case through which to elaborate on transportation policy strategies during the pandemic and in a post-pandemic world. Although Toyama is a moderately sized regional city in the central north of Japan (), with a population of 414,705 (Toyama City, Citation2021), its efforts to establish a compact city-based integrated PublicT systems have been recognized both nationally and internationally. The Japanese government selected it as one of its eco-model cities in 2008, eco-future cities in 2011 and sustainable development goals’ future cities in 2018 (Arai et al., Citation2020). In 2014, it was selected as one of the model cities for the United Nations Sustainable Energy for All initiative and for Rockefeller’s 100 Resilient Cities programme (Arai et al., Citation2020). In 2016, the city signed a Memorandum of Understanding Partnership Agreement with the World Bank for its compact city partnership programme (World Bank, Citation2017). Thus, Toyama’s compact city strategies, rooted in well-established PublicT systems, have been highly commended.
Figure 1. Map of Toyama, Japan.
Source: Ministry of the Environment (Citation2022).
In regional cities such as Toyama, the PublicT financial situation had long been difficult, even before the pandemic. Reduced PublicT market share and high car dependence render offsetting the operational costs difficult for PublicT providers in non-major cities (Rasca et al., Citation2021; Vickerman, Citation2021). The pandemic aggravated this situation. For instance, the number of the city’s train users decreased by approximately 21% from 3.32 million in fiscal year 2019 (April 2019–March 2020) to 2.63 million in fiscal year 2020 (April 2020–March 2021), and the number of bus users decreased by 25% from 6.14 million in 2019 to 4.61 million in 2020 (Toyama City, Citation2022). The daily average number of rental bicycle users decreased from 74,222 in 2019 to 59,526 in 2020. The daily average number of pedestrians in the city centre decreased from 46,638 in 2019 to 34,005 in 2020 (Toyama City, Citation2022). The number of car users also seems to have decreased. According to a study by Japan’s Ministry of Land, Infrastructure, Transport, and Tourism (Citation2022), car use in Toyama City decreased by 12.7% from 74,000 in 2019 to 64,600 in 2020 during the study period; however, this is a lower percentage than that observed for other transportation modes. The decreased transportation use can in part be explained by citizens’ refraining from going out unnecessarily to avoid spreading the infection, the closing of commercial facilities, and decreasing numbers of tourists (Toyama City, Citation2022). Although the city’s decreased use of PublicT is lower than the national average owing to the city government’s support for PublicT systems, there has been increasing concern that the potential shift to car use may encourage urban populations to move to the countryside and promote urban sprawl, which may hinder the promotion of compact city policies.
3. SOCIO-DEMOGRAPHIC FACTORS IN TRANSPORTATION MODE CHOICES
Socio-demographic characteristics including sex, age, income and education level are significant factors that influence transportation mode choices (Arroyo et al., Citation2020; Das et al., Citation2021a; Downey et al., Citation2022; Politis et al., Citation2021; Shakibaei et al., Citation2021; Zhang et al., Citation2021a). However, previous studies found conflicting results regarding their influence. For instance, Abdullah et al. (Citation2021) reported that women were more likely to shift to cars and/or ActiveT from PublicT than men during the pandemic, partly because women tended to be more concerned about the hygiene level in PublicT systems. However, Ding and Zhang (Citation2021) illustrated that car use declined among young women, while Eisenmann et al. (Citation2021) indicated that the decline in PublicT use was more notable among men during lockdown periods.
Neuburger and Egger’s (Citation2021) study in Germany reported that older people tended to have higher perceived risks concerning COVID-19 than did younger cohorts, implying that elderly people avoided using PublicT. However, Eisenmann et al. (Citation2021) documented that young adults tended to miss car use more than did older adults during the lockdown. Examining age factors in transportation use is particularly difficult during the pandemic in Japan because school-age children and young adults did not travel much during the first wave in March–May 2020 as schools were closed or online. This was the case in Greece, which had a mobility drop among young people during the COVID-19 outbreak (Politis et al., Citation2021). In addition, given the perceived risks of infection, elderly people (over the age of 65 years) did not travel much either during the same period. Furthermore, the transportation mode changes in the working-age population may vary depending on whether they can telework.
Zhang et al. (Citation2021b) reported that human mobility declined considerably among less-educated individuals during lockdowns in Hong Kong. By contrast, Molloy et al. (Citation2021) reported that in Switzerland those with tertiary education experienced a larger decrease in daily travel distances than did those with less education. The authors argued that toward the end of and after the lockdown, travel intensity increased among the less educated because they returned to work in service and manufacturing industries, whereas professionals with higher degrees tended to telework.
Although those with higher incomes are more likely to own a car (Dargay, Citation2001), Basu and Ferreira (Citation2021) documented that low-income households tended to purchase or use cars during the pandemic, partly because they were forced to depend on cars due to PublicT suspensions or frequency reduction. Many individuals experienced income losses or decreases owing to restricted human mobility and activities during the pandemic (Almeida et al., Citation2021; Qian & Fan, Citation2020). This income contraction may have direct or indirect effects on travel behaviours. Despite the need for mobility research across different income groups, few studies have examined the relationship between income changes and transportation mode changes during the pandemic (Iio et al., Citation2021).
4 . THEORETICAL FRAMEWORK
The theoretical framework employed in this study is an extended theory of the NAM and VAB. This theory was used because the prediction power of the combination of both was demonstrated to be high (Han et al., Citation2019). NAM assumes that the awareness of consequences and ascribed responsibility form personal norms that may influence transportation mode choices (Han et al., Citation2019; Nordfjærn & Rundmo, Citation2019). Personal norms are defined as personalized feelings of moral responsibility, as well as an awareness of the consequences of a certain behaviour (Bamberg & Schmidt, Citation2003). According to Steg et al. (Citation2001), awareness of the problems caused by car use is associated with actual car use. However, individuals tend to deny their responsibility when an action is inconvenient or difficult, as it is considered beyond their control (Wall et al., Citation2008). For instance, individuals relinquish responsibility regarding car use and blame their car driving practice on having no or few PublicT means available. That is, personal/moral norms alone are insufficient to explain certain behaviours without addressing perceived behavioural control (PBC). Given that personal norms are derived from internalized values and influenced by beliefs, which are in turn related to internal values (Steg & de Groot, Citation2010), VAB was applied to extend the NAM in which personal norms play a principal role (Kim et al., Citation2020).
VAB assumes that values have significant effects on attitudes toward travel behaviour (Arroyo et al., Citation2020). Values refer to a cognitive belief that facilitates one’s decisions to take action (Homer & Kahle, Citation1988). Values can be related to risky situations, including a pandemic (Aven & Renn, Citation2009). Attitudes are defined as feelings or evaluations of an individual’s behaviour (Ajzen, Citation1991). For instance, Steg (Citation2003) found that drivers evaluate car use as attractive ‘because of its convenience, independence, flexibility, comfort, speed, [and] reliability’ (p. 31). Thus, attitudinal changes potentially play a crucial role in transportation mode choices (Eisenmann et al., Citation2021; Shakibaei et al., Citation2021). Furthermore, Møller et al. (Citation2018) argued that for attitudes to be mediated into behaviour, individuals must perceive the ability to control their behaviour. PBC consists of perceived self-efficacy and controllability (Ajzen, Citation2002). Therefore, individuals with a locus of control tend to miss owning a car if they do not own one (Eisenmann et al., Citation2021). To summarize, values influence one’s decision to take action, mediating attitudes toward and/or behavioural control over a certain behaviour.
5. METHODOLOGY
5.1. Methods, sampling and variables
We employed self-administered online questionnaires through a research agency called Intage (https://www.intage.co.jp/english/) to examine socio-demographic and psychological factors that may explain transportation mode use during the pandemic. Toyama City’s population in September 2020 was 414,705, including a population of 311,450 in the central areas. Initially, we received responses from a sample of 1520 respondents living in the city regarding their transportation mode choices between September 2019 and September 2020, 1232 of whom were living in central areas of the city. A total of 11 responses were deleted from the sample because of data deficits or because the participant was under 20 years old. We then had 642 men and 579 women; 1221 total respondents aged 20–84 (all adult respondents from the survey after adjustment). The city centre comprises eight residential areas. We adjusted the socio-demographic proportion of the samples according to that of the area’s population to obtain geographically and socio-demographically representative samples from each area. The adjustment resulted in a total of 973 responses (See Appendix I in the supplemental data online for the sample selection process). We asked respondents about their September 2019 transportation mode use, retrospectively. We selected September 2019 for comparison because the use of some transportation modes, notably ActiveT, can be seasonal; citizens may change their transportation modes not because of pandemic-related travel restrictions but because of the season. Therefore, we chose the same months in 2019 and 2020 for comparison.
We considered transportation mode changes (i.e., PublicT, ActiveT, cars) as a dependent variable. Independent variables included socio-demographic factors (i.e., age, sex, education level and income changes between September 2019 and September 2020) and psychological factors (i.e., attitudes, PBC and personal norms). To examine behaviour, one item on the questionnaire inquired about respondents’ transportation mode use.
Attitudes were assessed using two questions probing the extent of respondents’ preferences for the use of the respective transportation mode (Q1) and their perceptions regarding its use (Q2), as has been used in several studies (Cats et al., Citation2017; Heath & Gifford, Citation2002). These variables were measured on a seven-point Likert scale (−3 = extremely dislike/bad to +3 = extremely like/good), with higher scores denoting a more favourable evaluation of a transportation mode. PBC was evaluated using two questions that queried the distance between the respondents’ homes, PublicT stops (Q3), and the perceived difficulty or ease of use of a specific transportation mode (Q4), as done by some previous studies (e.g., Bamberg et al., Citation2003; Wall et al., Citation2008). Distance was measured on a five-point Likert scale (1: 2 km; 2: 1.5–2 km; 3: 1–1.5 km; 4: 0.5–1 km; 5: 0–0.5 km) by asking respondents how far their home was from a PublicT stop. Perceived difficulty or ease of using a transportation mode was evaluated on a seven-point Likert scale (−3 = extremely difficult to +3 = extremely easy) by asking the respondents to rate the difficulty in using a transportation mode.
Personal norms were determined using two questions probing awareness of consequences (Q5) and personalized feelings of responsibility for the problems caused by car use (Q6), as in prior studies (Bamberg et al., Citation2007; Donald & Cooper, Citation2001; Heath & Gifford, Citation2002). Awareness of the problems caused by car use was assessed on a seven-point Likert scale (−3 = totally disagree to +3 = totally agree) by asking respondents to rate the extent to which they agreed with the statement about various problems caused by car use. Finally, perceived personal responsibility was measured on a seven-point Likert scale (−3 = totally disagree to +3 = totally agree) by asking the respondents to rate how responsible they felt for the problems caused by car use.
5.2. Models and data analysis
As in previous transportation studies (Bamberg et al., Citation2003; Hamidi & Zhao, Citation2020; Long et al., Citation2011), we used structural equation modelling. Response scores were analysed using confirmatory factor analysis and logistic regression. The formula for the factor analysis is:
(1.1)
(1.1)
(1.2)
(1.2) where xi1 and xi2 represent responses related to a latent factor fi, ai1 and ai2 denote factor loadings, and ei1 and ei2 are error terms. We have seven latent factors: attitude (ATTx, where x is PublicT, ActiveT and car), PBCx (where x is PublicT, ActiveT and car), and personal norm for a car (PNcar); here, active means bicycle. Each latent factor has two response variables illustrated in . For example, in the factor analysis of the latent attitude for PublicT, the factor ATTpublicT is estimated using the following two equations:
(1.3)
(1.3)
(1.4)
(1.4) where Q1publicT denotes the extent of the respondents’ preferences for the use of PublicT and Q2publicT represents respondents’ perception of PublicT (See Appendix II in the supplemental data online).
Figure 2. Variables in the theoretical framework for transportation mode changes.
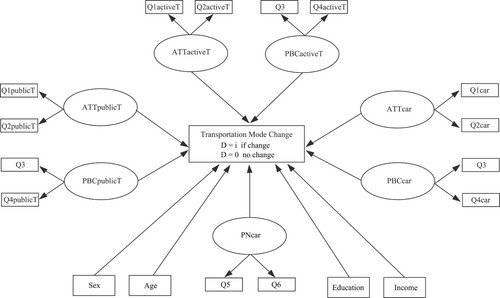
Based on the variables estimated by confirmatory factor analyses, we have a multinomial logistic regression model as follows. The objective variable D in the logistic regression takes four values of 0, 1, 2 and 3. A formula Pr (D = i | X) means a conditional probability of D = i under the condition that X = x, where X = (X1, X2, … , Xk) and x = (x1, x2, … , xk). The multinomial logistic regression model is defined as in the following formulas:
(1.5)
(1.5) where i = 1, 2 or 3; D = 0 implies no transportation mode change between 2019 and 2020; D = 1 implies its change to PublicT mode; D = 2 to ActiveT mode; and D = 3 to car mode (Kleinbaum & Klein, Citation2010).
The Likelihood ratio test for the model’s appropriateness was conducted, and its p-value was less than 0.001. The Nagelkerke statistic is used as a pseudo-R2 statistic, similar to the R2 statistic in logistic regressions. Its value was 0.166. All data analyses were conducted using SPSS version 28 (IBM, Citation2021, https://www.ibm.com/products/spss-statistics):
Q1. Approval (or disapproval) of the respective transportation mode (train, light rail transits (LRTs), buses, cars, motorcycles, bicycles, and walking).
Q2. Perceptions of transportation modes.
Q3. Distance between home and the closest public transportation catchment point.
Q4. Difficulty in utilizing transportation modes.
Q5. Awareness of the consequences of car use.
Q6. Personal perceived responsibility.
ATT: Attitudes; PBC: perceived behavioural control; and PN: personal norms.
6. RESULTS
The descriptive statistics of respondents’ socio-demographics are illustrated in . Transportation mode and its changes in 2019 and 2020 are depicted in . The multinomial logistic regression model is depicted in . Transportation mode changes through factor analysis and multinomial logistic regression are described in .
Figure 3. Changes in respondents’ main transportation mode between 2019 and 2020.
Note: PublicT, public transportation comprising trains, light rail transit and buses; ActiveT, cycling and walking; and Car, cars or motorcycles.
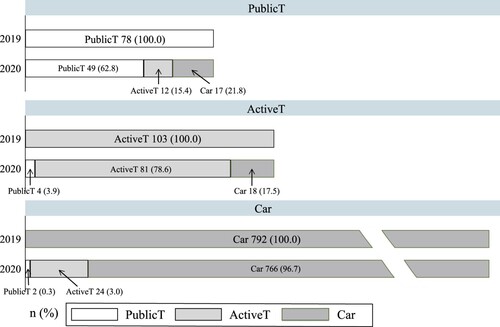
Table 1. Respondents’ descriptive statistics in 2020.
Table 2. Main transportation mode in 2020 and 2019, and its mode change in 2020.
Table 3. Transportation mode change through factor analysis and multinomial logistic regressiona.
The number of PublicT users decreased from 78 in 2019 to 55 in 2020, including those from the other transportation modes, whereas the number of ActiveT and car users increased slightly from 103 to 117 and from 792 to 801, respectively, during the same period. The largest loss in the number of users was for PublicT, by 37.2% between 2019 and 2020. Four ActiveT users and two car users shifted to PublicT in 2020 from 2019, which made the PublicT ridership above 70% of the pre-pandemic level. While ActiveT users decreased by 21.4%, some PublicT and car users, 12 and 24, respectively, joined this cohort to increase the overall figure from 2019. Similarly, the number of 2019 car users decreased by 3.3%, while 17 PublicT users and 18 ActiveT users switched to car use to increase the total number.
Regarding psychological characteristics, the findings showed that those with positive attitudes toward PublicT tended to shift to PublicT; those with high PN for car use tended to shift to PublicT; those with PBC over car use tended not to change to PublicT; and those with positive attitudes toward car use tended not to shift to ActiveT. Socio-demographically, women tended to shift to ActiveT compared with men; those with 15 years or more of education tended to choose ActiveT; those whose income decreased from the previous year tended to change ActiveT. In the next section, we will analyse these findings and determine their implications.
7. DISCUSSION
Regarding the respondents who changed to PublicT, those with positive attitudes toward PublicT tended to shift to PublicT. This finding is supported by the NAM–VAB theoretical model; the more favourable the individuals’ attitudes are toward a certain transportation mode, the higher their intention to use it is (de Oña & de Oña, Citation2021). Furthermore, those with high PN for car use tended to shift to PublicT as they were more aware of and/or felt responsible for the consequences of car use. This finding is also supported by the NAM–VAB theoretical model. As Steg et al. (Citation2001) note, for example, higher awareness of problems caused by car use is associated with less car use. Those with PBC over car use tended not to change to PublicT. Potentially, some respondents perceived themselves to be in control only over cars, as they feared virus infection or were discouraged from using PublicT by the government; this may be true for those who were located farther away from their destinations and could not shift to ActiveT. Therefore, if respondents during the COVID-19 restriction were unable to continue using ActiveT modes for reasons such as changed workplaces during the pandemic, they had no option but to use a car because of perceived insecurity about PublicT use or the government’s request to refrain from using PublicT modes. This finding coincides with those from a study by Monterde-i-Bort et al. (Citation2022); PBC over cars had negative correlations with PublicT use during the COVID-19 restrictions.
We now examine the respondents who changed to ActiveT. Those with positive attitudes toward car use tended not to change to ActiveT. This finding is also supported by the NAM–VAB theoretical model (de Oña & de Oña, Citation2021). In this study, respondents’ change to ActiveT was the only category that was significantly associated with socio-demographic factors such as sex, education level, and income changes, but not age.
Compared with men, women tended to shift to ActiveT. This could be related to other study findings that women care more about health (Bertakis et al., Citation2000) while taking more preventive measures than do men (Borkowski et al., Citation2021). Women may also have fewer alternative transportation modes compared with men, who ‘were not affected at the same extent as women [by COVID-19 restriction] since they typically travel by car, while women use public transport more than men’ (Politis et al., Citation2021, p. 13). Respondents with 15 years or more of education also tended to choose ActiveT. This may be because those with higher educational qualifications likely possessed more knowledge about the virus contagion and avoided PublicT use (Molloy et al., Citation2021).
If women care more about health, and the highly educated are more knowledgeable about health, it is unsurprising that they prefer ActiveT modes to motorized modes. In Japan, exercise and fitness have become quite popular, and most Japanese women aim to lose weight and remain healthy (Andreasson & Johansson, Citation2017). In addition, educated Japanese people tend to avoid behaviours that pose health risks (Fukuda et al., Citation2005) and the use of the ActiveT mode helps them achieve this objective.
Respondents whose income decreased from the previous year tended to change to ActiveT. As far as the authors know, no existing literature has examined associations between income changes and transportation mode changes during the pandemic. Therefore, we cannot compare this result with those from other studies. One possible, albeit improbable, explanation is that the respondents could no longer afford car maintenance due to their income reduction. However, even after the income decrease from the previous year, the citizens’ incomes on average appear to have remained high enough to maintain cars. According to Lifullhomes (Citation2020), for example, the average household incomes in Toyama City were 5.47 million yen (equivalent to US$42,000), 6.8% higher than the national average. Another possible explanation for the shift to ActiveT mode is Toyama City’s infrastructural attributes: namely a compact city whose functions are concentrated in the city centre. As Nikiforiadis et al. (Citation2022, p. 1) argue, ‘the changes in walking frequency [due to the COVID-19 restriction] are closely linked to the city’s attributes’. Even though Toyama’s compact city strategy has been developed around the PublicT, as Nikifortadis et al. note, the development of the PublicT systems itself enhances ActiveT mode such as walking and cycling. Therefore, the pandemic restrictions and subsequent income decreases may have encouraged those who had already been considering using ActiveT mode before the pandemic.
Age was not found to be significantly associated with changes in any transportation mode choice, which aligns with the findings of Abdullah et al. (Citation2021), who demonstrated that age was insignificant in predicting transportation mode changes during the pandemic. As mentioned in section 2, defining the significance of age factors in transportation mode changes during the pandemic is difficult as they cannot be simply described as ‘The older/younger tend to … ’ because the mobility of young students and elderly alike was drastically limited. Further, the working-age population was divided into those who could telework and those who were forced to commute (Downey et al., Citation2022).
No statistically significant variable was found between respondents’ shift to cars and their socio-demographic and psychological characteristics. This may be because the majority of the respondents had already used cars, and they continued using cars even after COVID-19 broke out, as cars provide ‘a protected space for the occupants, and there is no need to fear virus infection from unwanted interaction with other people’ (Downey et al., Citation2022, p. 347).
The findings from this study do not appear to be unique to Toyama. The significant associations identified between respondents’ changes to a different transportation mode and psychological and socio-demographic factors can be explained by the NAM-VAB theoretical model and coincide with findings from other studies in different cities and countries, including China and several European countries including Greece and Scotland during the pandemic (Arroyo et al., Citation2020; de Oña & de Oña, Citation2021; Borkowski et al., Citation2021; Ding & Zhang, Citation2021; Eisenmann et al., Citation2021; Molloy et al., Citation2021; Politis et al., Citation2021; Shakibaei et al., Citation2021). As is the case with many other studies, this research also indicates that some PublicT passengers shifted to ActiveT mode or cars during the pandemic (e.g., Monterde-i-Bort et al., Citation2022; Nikiforiadis et al., Citation2022; Schmidt et al., Citation2021). However, the number of PublicT users was maintained at over 70% of the pre-pandemic level, while that of the PublicT users worldwide decreased by 80–95% (Eisenmann et al., Citation2021; Rothengatter et al., Citation2021; van der Drift et al., Citation2021). This may be attributed to Toyama City’s characteristics as a compact city entailing a walkable infrastructure, bike lanes, and well-coordinated PublicT systems with concentrated city functions in the city centre (Ito & Kawazoe, Citation2022), which may suggest how the built environment contributes to PublicT ridership (Nikiforiadis et al., Citation2022). Further, unlike mega cities such as Tokyo and Osaka, Toyama’s PublicT mode, notably the light rail transit, is spacious inside and not crowded, and thus can be considered relatively safe from virus contagion. This fact and perception may have helped passengers to regain confidence and trust in PublicT.
7.1. Implications
Several researchers have noted that PublicT providers need to regain users’ confidence and trust in PublicT to bring back PublicT passengers (Downey, 2022; Das et al., Citation2021b; Tarasi et al., Citation2021). This also applies in Japan, where more than 60% of Japanese people perceived PublicT use as risky (Zhang et al., Citation2021a). For instance, Dong et al. (Citation2021) suggested that PublicT service providers should increase service frequency to enable physical distancing among passengers and help avoid congestion. Although this suggestion is ideal, it is infeasible. Low PublicT ridership because of the COVID-19 pandemic has generally led to financial difficulties for PublicT service providers, resulting in diminishing the frequency of services (Echaniz et al., Citation2021; Tiikkaja & Viri, Citation2021). In turn, lower frequency of PublicT services subsequently reduced PublicT ridership (Basu & Ferreira, Citation2021). This is a vicious circle. Furthermore, confronted with relatively high fiscal deficits caused by pandemic-related interventions, governments are unlikely to be able to bail out PublicT systems (Downey, 2022; Vickerman, Citation2021).
As the government and even PublicT service providers announced that individuals should refrain from traveling in PublicT and passengers are concerned about infection, citizens’ PBC over PublicT arguably reduced. In situations such as this, policymakers should promote ActiveT modes (Shakibaei et al., Citation2021), for example, by providing walking pathways and establishing bike lanes separated from motorized traffic to enhance PBC over ActiveT use; and unlike PublicT, building infrastructure for ActiveT modes requires less investment (Garrard et al., Citation2008). For instance, Athens introduced a project called ‘Great Walk’ in June 2020 that included the creation of public spaces, cycle lanes, and pedestrian zones and appears to have contributed to promoting Active-T (Nikiforiadis et al., Citation2022). This is similar to what Toyama City has long been doing in the context of its compact city strategies.
Our findings largely suggest two potential strategies to promote ActiveT modes. First, as highly educated and/or female respondents tended to shift to ActiveT modes partly owing to their high awareness and knowledge about health and COVID-19, policymakers must focus on adopting measures to retain them in this transportation mode use even beyond the pandemic period (e.g., by providing safe bike lanes and adequate lighting at night; Carver & Veitch, Citation2020). Alternatively, policymakers could focus on addressing men, who tended not to change their travel patterns in response to COVID-19 (Ding & Zhang, Citation2021). Policymakers should raise awareness among men about the health benefits of ActiveT modes, for example, through health campaigns (Thombre & Agarwal, Citation2021).
Generally, car use leads to physical inactivity, which is associated with health issues including diabetes, heart disease, cancer, and depression (Koehl, Citation2020). Olabarria et al. (Citation2014) contended that active mobility, especially among men, could reduce the likelihood of being overweight or obese, which can consequently reduce negative health outcomes. For example, men who walked 30 min or more daily were less likely to be overweight or obese than those who did not (Olabarria et al., Citation2014). Wen and Rissel (Citation2008) also echoed this finding – men who cycled to work were significantly less likely to be overweight and obese. Further, Andreasson and Johansson (Citation2017) reported that, as is true for women, most Japanese men also aim to lose weight and stay healthy. Policymakers should emphasize that daily active commuting could help men achieve this goal without additional exercising. In particular, when a crisis such as COVID-19 occurs, individuals increase their use of social media; as such, policymakers could leverage this to facilitate public communication about the health benefits of ActiveT modes (Dong et al., Citation2021; see also Korda & Itani, Citation2013, for social media use to enhance exercise or modify health behaviour).
Now that the pandemic is considered to be less threatening than before in part due to the emergence of vaccinations and medicine, negative perception of PublicT must be reduced to increase ridership. Downey et al. (Citation2022, p. 349) state that governments and the PublicT industry must adequately address public perceptions of health risks associated with PublicT to ensure customer retention and the long-term viability of the PublicT sector such as with online campaigns aiming at increasing public confidence in the PublicT service. These campaigns can be even more effective if targeted at populations with specific characteristics (Downey et al., Citation2022, p. 350). This study is expected to contribute to helping policy makers elaborate strategies to promote PublicT and ActiveT in this respect.
8. CONCLUSIONS
In this study, we examined transportation mode changes and possible factors that influenced these changes during the pandemic interventions between 2019 and 2020, focusing on socio-demographic and psychological factors. The findings revealed that the ActiveT mode gained the most new users, followed by car users. While the PublicT mode lost the most users, it maintained a ridership above 70% of the pre-pandemic level, which may be attributed to Toyama City’s compact city strategies rooted in transportation policies. Regarding psychological characteristics, the findings showed that those with positive attitudes toward PublicT tended to shift to PublicT; those with high PN for car use tended to shift to PublicT; those with PBC over car use tended not to change to PublicT; and those with positive attitudes toward car use tended not to shift to ActiveT. Socio-demographically, respondents who were female, highly educated, and/or whose income decreased from the previous year tended to shift to Active-T, perhaps in part because respondents who are female and highly educated were generally more aware of health, particularly the threat of COVID-19. Age was not significantly associated with transportation mode changes. We suggest that policymakers must promote ActiveT modes by raising individuals’ awareness about health benefits and establishing an ActiveT mode-friendly infrastructure. However, because this is a new study that examined an association between transportation mode changes and income changes, we have no reference for comparison, and thus this remains an issue to be addressed in future research.
This study entails some limitations. First, citizens’ use of transportation modes might have changed more than once during the research period (Monterde-i-Bort et al., Citation2022), partly because the government adopted different measures to counter the COVID-19 outbreak. Longitudinal studies are thus needed to examine how individuals’ transportation mode uses have changed and are likely to change over time. In addition, ActiveT modes are seasonal (Wang & Noland, Citation2021). If the study was conducted in summer or winter instead of fall, we might have obtained different results; that is why, we compared the modes in fall of two different years. As mentioned in the methodology section, we used a research agency to collect data, which were not randomly sampled. As the proportion of samples in these residential areas was disproportionate to the area’s population, we randomly selected collected samples in proportion to the area’s total population as of June 2020. We also adjusted the socio-demographic proportion of the samples according to that of the area’s population to obtain geographically and socio-demographically representative samples from each area. Finally, this study investigated the specific context of Toyama City. Given specific city attributes with specific socio-demographic and transportation characteristics (Nikiforiadis et al., Citation2022), citizens’ transportation mode use may not reflect that of the entire Japanese population. Future research should be conducted on a larger scale to further generalize our findings.
Supplemental Material
Download MS Word (36.5 KB)DATA AVAILABILITY
The data that support the findings of this study are available from the corresponding author on request. The data are not publicly available because they contain information that can compromise the privacy of the research participants.
DISCLOSURE STATEMENT
No potential conflict of interest was reported by the authors.
Additional information
Funding
REFERENCES
- Abdullah, M., Ali, N., Javid, M. A., Dias, C., & Campisi, T. (2021). Public transport versus solo travel mode choices during the COVID-19 pandemic: Self-reported evidence from a developing country. Transportation Engineering, 5, 1–8. https://doi.org/10.1016/j.treng.2021.100078
- Ajzen, I. (1991). The theory of planned behavior. Organizational Behavior Organizational Behavior and Human Decision Processes, 50(2), 179–211. https://doi.org/10.1016/0749-5978(91)90020-T
- Ajzen, I. (2002). Perceived behavioral control, self-efficacy, locus of control, and the theory of planned behavior. Journal of Applied Social Psychology, 32(4), 665–683. https://doi.org/10.1111/j.1559-1816.2002.tb00236.x
- Almeida, V., Barrios, S., Christl, M., De Poli, S., Tumino, A., & van der Wielen, W. (2021). The impact of COVID-19 on households’ income in the EU. The Journal of Economic Inequality, 19(3), 413–431. https://doi.org/10.1007/s10888-021-09485-8
- Andreasson, J., & Johansson, T. (2017). The new fitness geography: The globalization of Japanese gym and fitness culture. Leisure Studies, 36(3), 383–394. https://doi.org/10.1080/02614367.2015.1105858
- Arai, Y., Levine, D., Mikimoto, H., & Yamazaki, M. (2020). The development story of Toyama: Reshaping compact and livable cities. World Bank.
- Arroyo, R., Ruiz, T., Mars, L., Rasouli, S., & Timmermans, H. (2020). Influence of values, attitudes towards transport modes and companions on travel behavior. Transportation Research Part F, 71, 8–22. https://doi.org/10.1016/j.trf.2020.04.002
- Aven, T., & Renn, O. (2009). On risk defined as an event where the outcome is uncertain. Journal of Risk Research, 12(1), 1–11. https://doi.org/10.1080/13669870802488883
- Bamberg, S., Ajzen, I., & Schmidt, P. (2003). Choice of travel mode in the theory of planned behavior: The role of past behavior, habit, and reasoned action. Basic and Applied Social Psychology, 25(3), 175–187. https://doi.org/10.1207/S15324834BASP2503_01
- Bamberg, S., Hunecke, M., & Blöbaum, A. (2007). Social context, personal norm and the use of public transportation: Two field studies. Journal of Environmental Psychology, 27(3), 190–203. https://doi.org/10.1016/j.jenvp.2007.04.001
- Bamberg, S., & Schmidt, P. (2003). Incentives, morality, or habit? Predicting students’ car use for university routes with the models of Ajzen, Schwartz, and Triandis. Environment and Behavior, 35(2), 264–285. https://doi.org/10.1177/0013916502250134
- Basu, R., & Ferreira, J. (2021). Sustainable mobility in auto-dominated Metro Boston: Challenges and opportunities post-COVID-19. Transport Policy, 103, 197–210. https://doi.org/10.1016/j.tranpol.2021.01.006
- Bertakis, K. D., Azari, R., Helms, L. J., Callahan, E. J., & Robbins, J. A. (2000). Gender differences in the utilization of health care services. Journal of Family Practice, 49(2), 147–152. https://pubmed.ncbi.nlm.nih.gov/10718692/
- Borkowski, P., Jazdzewska-Gutta, M., & Szmelter-Jarosz, A. (2021). Lockdowned: Everyday mobility changes in response to COVID-19. Journal of Transport Geography, 90, 1–13. https://doi.org/10.1016/j.jtrangeo.2020.102906
- Buehler, R., & Pucher, J. (2021). COVID-19 impacts on cycling, 2019–2020. Transport Reviews, 41(4), 393–400. https://doi.org/10.1080/01441647.2021.1914900
- Carver, A., & Veitch, J. (2020). Perceptions and patronage of public transport – are women different from men? Journal of Transport & Health, 19, 1–7. https://doi.org/10.1016/j.jth.2020.100955
- Cats, O., Susilo, Y. O., & Reimal, T. (2017). The prospects of fare-free public transport: Evidence from Tallinn. Transportation, 44(5), 1083–1104. https://doi.org/10.1007/s11116-016-9695-5
- Dargay, J. M. (2001). The effect of income on car ownership: Evidence of asymmetry. Transportation Research Part A: Policy and Practice, 35(9), 807–821. https://doi.org/10.1016/S0965-8564(00)00018-5
- Das, A. K., Jilani, M. M. A. K., Uddin, M. S., Uddin, M. A., & Ghosh, A. K. (2021b). Fighting ahead: Adoption of social distancing in COVID-19 outbreak through the lens of theory of planned behavior. Journal of Human Behavior in the Social Environment, 31(1–4), 373–393. https://doi.org/10.1080/10911359.2020.1833804
- Das, S., Boruah, A., Benerjee, A., Raoniar, R., Nama, S., & Maurya, A. K. (2021a). Impact of COVID-19: A radical modal shift from public to private transport mode. Transport Policy, 109, 1–11. https://doi.org/10.1016/j.tranpol.2021.05.005
- de Oña, E. E., & de Oña, R. (2021). Public transport users versus private vehicle users: Differences about quality of service, satisfaction and attitudes toward public transport in Madrid (Spain). Travel Behaviour and Society, 23, 76–85. https://doi.org/10.1016/j.tbs.2020.11.003
- Ding, H., & Zhang, J. (2021). Dynamic associations between temporal behavior changes caused by the COVID-19 pandemic and subjective assessments of policymaking: A case study in Japan. Transport Policy, 110, 58–70.
- Donald, I., & Cooper, S. R. (2001). A facet approach to extending the normative component of the theory of reasoned action. British Journal of Social Psychology, 40(4), 599–621. https://doi.org/10.1348/014466601165000
- Dong, H., Ma, S., Jia, N., & Tian, J. (2021). Understanding public transport satisfaction in post COVID-19 pandemic. Transport Policy, 101, 81–88. https://doi.org/10.1016/j.tranpol.2020.12.004
- Downey, L., Fonzone, A., Fountas, G., & Semple, T. (2022). The impact of COVID-19 on future public transport use in Scotland. Transportation Research Part A, 163, 338–352. https://doi.org/10.1016/j.tra.2022.06.005
- Echaniz, E., Rodríguez, A., Cordera, R., Benavente, J., & Alonso, B. (2021). Behavioral changes in transport and future repercussions of the COVID-19 outbreak in Spain. Transport Policy, 111, 38–52. https://doi.org/10.1016/j.tranpol.2021.07.011
- Eisenmann, C., Nobis, C., Kolarova, V., Lenz, B., & Winkler, C. (2021). Transport mode use during the COVID-19 lockdown period in Germany: The car became more important, public transport lost ground. Transport Policy, 103, 60–67. https://doi.org/10.1016/j.tranpol.2021.01.012
- Fukuda, Y., Nakamura, K., & Takano, T. (2005). Accumulation of health risk behaviors is associated with lower socioeconomic status and women’s urban residence: A multilevel analysis in Japan. BMC Public Health, 5(53), 1–10. https://doi.org/10.1186/1471-2458-5-53
- Garrard, J., Rose, G., & Lo, S. K. (2008). Promoting transportation cycling for women: The role of bicycle infrastructure. Preventive Medicine, 46(1), 55–59. https://doi.org/10.1016/j.ypmed.2007.07.010
- Gkiotsalitis, K., & Cats, O. (2021). Public transport planning adaption under the COVID-19 pandemic crisis: Literature review of research needs and directions. Transport Reviews, 41(3), 374–392. https://doi.org/10.1080/01441647.2020.1857886
- Hamidi, Z., & Zhao, C. (2020). Shaping sustainable travel behaviour: Attitude, skills, and access all matter. Transportation Research Part D, 88, 1–18. https://doi.org/10.1016/j.trd.2020.102566
- Han, H., Hwang, J., Lee, M. J., & Kim, J. (2019). Word-of-mouth, buying, and sacrifice intentions for eco-cruises: Exploring the function of norm activation and value–attitude–behavior. Tourism Management, 70, 430–443. https://doi.org/10.1016/j.tourman.2018.09.006
- Hara, Y., & Yamaguchi, H. (2021). Japanese travel behavior trends and change under COVID-19 state-of-emergency declaration: Nation observation by mobile phone location data. Transportation Research Interdisciplinary Perspectives, 9, 1–12. https://doi.org/10.1016/j.trip.2020.100288
- Heath, Y., & Gifford, R. (2002). Extending the theory of planned behavior: Predicting the use of public transportation. Journal of Applied Social Psychology, 32(10), 2154–2189. https://doi.org/10.1111/j.1559-1816.2002.tb02068.x
- Homer, P. M., & Kahle, L. R. (1988). A structural equation test of the value–attitude–behavior hierarchy. Journal of Personality and Social Psychology, 54(4), 638–646. https://doi.org/10.1037/0022-3514.54.4.638
- IBM. (2021). SPSS statistics. https://www.ibm.com/products/spss-statistics.
- Iio, K., Guo, X., Kong, X., Rees, K., & Wang, X. B. (2021). COVID-19 and social distancing: Disparities in mobility adaptation between income groups. Transportation Research Interdisciplinary Perspectives, 10, 1–10. https://doi.org/10.1016/j.trip.2021.100333
- Ito, H., & Kawazoe, N. (2022). Promoting transportation policies in the context of compact city strategies: The case of Toyama City, Japan. The Annals of Regional Science. Latest Article.
- Kanda, Y. (2021). Koronaka to koukyou koutsu: koukyou koutsu e no eikyou to fukkatsu no Houkousei (COVID-19 and public transport: An examination of the coronavirus’ impacts and steps toward revival in the post-pandemic-world). Journal of the International Association of Traffic and Safety Sciences, 46(1), 40–48.
- Kim, M. J., Hall, C. M., & Kim, D.-K. (2020). Predicting environmentally friendly eating out behavior by value–attitude–behavior theory: Does being vegetarian reduce food waste? Journal of Sustainable Tourism, 28(6), 797–815. https://doi.org/10.1080/09669582.2019.1705461
- Kleinbaum, D. G., & Klein, M. (2010). Logistic regression. Springer.
- Koehl, A. (2020). Urban transport and COVID-19: Challenges and prospects in low- and middle-income countries. Cities & Health, 5(1), 5185–5190. https://doi.org/10.1080/23748834.2020.1791410
- Korda, H., & Itani, Z. (2013). Harnessing social media for health promotion and behavioral change. Health Promotion Practice, 14(1), 15–23. https://doi.org/10.1177/1524839911405850
- Lifullhomes. (2020). Statistics of Toyama. https://lifullhomes-index.jp/info/money-data/household/address/toyama-pref/.
- Long, B., Choocharukul, K., & Nakatsuji, T. (2011). Psychological factors influencing behavioral intention toward future sky train usage in Phnom Penh, Cambodia. Transportation Research Record: Journal of the Transportation Research Board, 2217(1), 63–70. https://doi.org/10.3141/2217-08
- Ministry of Land, Infrastructure, Transport, and Tourism. (2022). Toyama no koutsujyoukyou ni tsuite (Traffic volume in Toyama). http://www.hrr.mlit.go.jp/press/2021/1/220105toyama.pdf.
- Ministry of the Environment. (2022). General information. https://www.env.go.jp/earth/g7toyama_emm/english/about_toyama.html.
- Møller, M., Haustein, S., & Bohlbro, M. (2018). Adolescents’ associations between travel behavior and environmental impact: A qualitative study based on the norm-activation model. Travel Behaviour and Society, 11, 69–77. https://doi.org/10.1016/j.tbs.2017.12.005
- Molloy, J., Schatzmann, T., Schoeman, B., Tchervenkov, C., Hintermann, B., & Axhausen, K. W. (2021). Observed impacts of the COVID-19 first wave on travel behaviour in Switzerland based on a large GPS panel. Transport Policy, 104, 43–51. https://doi.org/10.1016/j.tranpol.2021.01.009
- Monterde-i-Bort, H., Sucha, M., Risser, R., & Kochetova, T. (2022). Mobility patterns and mode choice preferences during the COVID-19 situation. Sustainability, 14(2), 1–13. https://doi.org/10.3390/su14020768
- Neuburger, L., & Egger, R. (2021). Travel risk perception and travel behaviour during the COVID-19 pandemic 2020: A case study of the DACH region. Current Issues in Tourism, 24(7), 1003–1016. https://doi.org/10.1080/13683500.2020.1803807
- Nikiforiadis, A., Miltropoulos, L., Kopelias, P., Basbas, S., Stamatiadis, N., & Kroustali, S. (2022). Exploring mobility pattern changes between before, during and after COVID-19 lockdown periods for young adults. Cities, 125, 1–12. https://doi.org/10.1016/j.cities.2022.103662
- Nordfjærn, T., & Rundmo, T. (2019). Acceptance of disincentives to driving and pro-environmental transport intentions: The role of value structure, environmental beliefs and norm activation. Transportation, 46(6), 2381–2396. https://doi.org/10.1007/s11116-018-9950-z
- Olabarria, M., Pérez, K., Santamariña-Rubio, E., & Novoa, A. M. (2014). Daily mobility patterns of an urban population and their relationship to overweight and obesity. Transport Policy, 32, 165–171. https://doi.org/10.1016/j.tranpol.2014.01.012
- Politis, I., Georgiadis, G., Nikolaidou, A., Kopsacheilis, A., Fyrogenis, I., Sdoukopoulos, A., Verani, E., & Papadopoulos, E. (2021). Mapping travel behavior changes during the COVID-19 lock-down: A socioeconomic analysis in Greece. European Transport Research, 13(21), 1–19. https://doi.org/10.1016/j.trip.2021.100345
- Qian, Y., & Fan, W. (2020). Who loses income during the COVID-19 outbreak? Evidence from China. Research in Social Stratification and Mobility, 68, 1–5. https://doi.org/10.1016/j.rssm.2020.100522
- Rasca, S., Markvica, K., & Ivanschitz, B. P. (2021). Impacts of COVID-19 and pandemic control measures on public transport ridership in European urban areas: The case of Vienna, Innsbruck, Oslo, and Agder. Transportation Research Interdisciplinary Perspectives, 10, 1–15. https://doi.org/10.1016/j.trip.2021.100376
- Rothengatter, W., Zhang, J., Hayashi, Y., Nosach, A., Wang, K., & Oum, T. H. (2021). Pandemic waves and the time after COVID-19: Consequences for the transport sector. Transport Policy, 110, 225–237. https://doi.org/10.1016/j.tranpol.2021.06.003
- Schmidt, K., Sieverding, T., Wallis, H., & Matties, E. (2021). COVID-19: A window of opportunity for the transition toward sustainable mobility? Transportation Research Interdisciplinary Perspectives, 10, 1–14. https://doi.org/10.1016/j.trip.2021.100374
- Shakibaei, S., de Jong, G. C., Alpkökin, P., & Rashidi, T. H. (2021). Impact of the COVID-19 pandemic on travel behavior in Istanbul: A panel data analysis. Sustainable Cities and Society, 65, 1–18. https://doi.org/10.1016/j.scs.2020.102619
- Steg, L. (2003). Can public transport compete with the private car? IATSS Research, 27(2), 27–35. https://doi.org/10.1016/S0386-1112(14)60141-2
- Steg, L., & de Groot (2010). Explaining prosocial intentions: Testing causal relationships in the norm activation model. British Journal of Social Psychology, 49(4), 725–743. https://doi.org/10.1348/014466609X477745
- Steg, L., Geurs, K., & Ras, M. (2001). The effects of motivational factors on car use: A multidisciplinary modelling approach. Transportation Research Part A Policy and Practice, 35(9), 789–806. https://doi.org/10.1016/S0965-8564(00)00017-3
- Tarasi, D., Daras, T., Tournaki, S., & Tsoutsos, T. (2021). Transportation in the Mediterranean during the COVID-19 pandemic era. Global Transitions, 3, 55–71. https://doi.org/10.1016/j.glt.2020.12.003
- Thombre, A., & Agarwal, A. (2021). A paradigm shift in urban mobility: Policy insights from travel before and after COVID-19 to seize the opportunity. Transport Policy, 110, 335–353. https://doi.org/10.1016/j.tranpol.2021.06.010
- Tiikkaja, H., & Viri, R. (2021). The effects of COVID-19 epidemic on public transport ridership and frequencies: A case study from Tampere, Finland. Transportation Research Interdisciplinary Perspectives, 10, 1–7. https://doi.org/10.1016/j.trip.2021.100348
- Toyama City. (2021). Toyama-shi toukei syo (Toyama City’s statistics report). https://www.city.toyama.toyama.jp/kikakukanribu/kikakuchoseika/tokei/tokeisho/tokeisho.html.
- Toyama City. (2022). Measures to revitalize public transportation. https://www.city.toyama.toyama.jp/katsuryokutoshisouzoubu/kotsuseisakuka/toyama_koukyokoutu.html.
- Travaglio, M., Yu, R., Popovic, R., Selley, L., Leal, N. S., & Martins, L. M. (2021). Links between air pollution and COVID-19 in England. Environmental Pollution, 268, 1–10. https://doi.org/10.1016/j.envpol.2020.115859
- van der Drift, S., Wismans, L., & Kalter, M.-J. O. (2021). Changing mobility patterns in The Netherlands during COVID-19 outbreak. Journal of Location Based Services, 16(1), 1–24. https://doi.org/10.1080/17489725.2021.1876259
- Vickerman, R. (2021). Will COVID-19 put the public back in public transport? A UK perspective. Transport Policy, 103, 95–102. https://doi.org/10.1016/j.tranpol.2021.01.005
- Wall, R., Devine-Wright, P., & Mill, G. A. (2008). Interactions between perceived behavioral control and personal–normative motives. Journal of Mixed Methods Research, 2(1), 63–86. https://doi.org/10.1177/1558689807309967
- Wang, H., & Noland, R. B. (2021). Bikeshare and subway ridership changes during the COVID-19 pandemic in New York city. Transport Policy, 106, 262–270. https://doi.org/10.1016/j.tranpol.2021.04.004
- Wen, L. M., & Rissel, C. (2008). Inverse associations between cycling to work, public transport, and overweight and obesity: Findings from a population-based study in Australia. Preventive Medicine, 46(1), 29–32. https://doi.org/10.1016/j.ypmed.2007.08.009
- World Bank. (2017). City partnership program. http://www.worldbank.org/en/news/feature/2017/01/12/city-partnership-program-addressing-complex-development-challenges-together.
- Zhang, J., Zhang, E., Ding, H., Li, S., Li, S., Liu, R., Ma, S., Zhai, B., Kashima, S., & Hayashi, Y. (2021a). Effects of transport-related COVID-19 policy measures: A case study of six developed countries. Transport Policy, 110, 37–57. https://doi.org/10.1016/j.tranpol.2021.05.013
- Zhang, N., Jia, W., Wang, P., Dung, C.-H., Zhao, P., Leung, K., Su, B., Cheng, R., & Li, Y. (2021b). Changes in local travel behaviour before and during the COVID-19 pandemic in Hong Kong. Cities, 112, 1–9. https://doi.org/10.1016/j.cities.2021.103139
- Zhang, Y., & Fricker, J. D. (2021). Quantifying the impact of COVID-19 on non-motorized transportation: A Bayesian structural time series model. Transport Policy, 103, 11–20. https://doi.org/10.1016/j.tranpol.2021.01.013