
 ?Mathematical formulae have been encoded as MathML and are displayed in this HTML version using MathJax in order to improve their display. Uncheck the box to turn MathJax off. This feature requires Javascript. Click on a formula to zoom.
ABSTRACT
This paper assesses the relationship between economic resilience in English regions and the allocation of the UK government’s Community Renewal Fund (CRF). The CRF is part of the government’s ‘Levelling Up’ agenda to address place-based inequalities. Economic resilience is measured using a composite index comprising productivity, skills, unemployment, population density and household income. Data were obtained for the five indicators at local authority (LA) level in England. Regional resilience scores were produced by calculating the weighted mean score of the constituent LAs. Regional resilience values were used to generate an ‘expected share’ funding allocation, which was compared with the actual allocation using differences and correlation. Regional resilience scores ranged from 28.5 (North East) to 66.6 (London). A total of £125.56 million was allocated in the first round of the CRF. All regions in the North received less than their expected share allocation of the CRF, with the least resilient region in England (North East) receiving £13.4 million less. The South West received £9.9 million more than their expected share. All regions in the North of England received less than their expected share allocation of the CRF. There was no significant correlation between resilience values and CRF allocations (r = −0.16, p = 0.68). The current method for CRF allocation may therefore widen existing inequalities rather than ‘level up’.
INTRODUCTION
There are deep-rooted regional inequalities in health and wealth across England (Dorling, Citation2010). People living in the North of England, defined here as living in the three most northerly regions (North East, North West, and Yorkshire and the Humber) have an average life expectancy two years lower than the rest of the country and a £4 per person per hour gap in economic productivity (Bambra et al., Citation2018). These inequalities are persistent and have widened during recent decades (Buchan et al., Citation2017). Existing geographical divides were exacerbated by austerity and feelings of being ‘left behind’ are considered to have contributed to the 2016 BrexitFootnote1 vote and spurred the Conservative Party to propose a regional development policy of ‘Levelling Up’ as a centrepiece of their successful 2019 election manifesto.
The COVID-19 pandemic laid bare existing inequalities, with the North experiencing 17% higher mortality rate compared with the rest of England (Munford et al., Citation2021). In March 2021, the UK government announced a £220 million Community Renewal Fund (CRF) to support national recovery following the COVID-19 pandemic (Department for Levelling Up, Housing and Communities (DLUHC), Citation2021d). The CRF is a precursor to the £1.5 billion Shared Prosperity Fund (SPF), and forms part of the government’s ‘Levelling Up’ agenda to address place-based inequalities.
To support CRF allocation, the government developed a composite index to measure economic resilience (UKERI) (DLUHC, Citation2021c). Resilience is a longstanding concept in multiple fields (Manyena, Citation2006; Windle, Citation2011). In the context of regional economic resilience, a suggested definition is: ‘the ability of a region to anticipate, prepare for, respond to, and recover from a disturbance’ (Foster, Citation2007, p. 14). The stated purpose of the UKERI is to identify places less able to resist and recover from shocks; it was used in the CRF allocation process to identify 100 places that warranted prioritisation and that would consequently receive capacity funding for bid development (DLUHC, Citation2021a). In November 2021, the DLUHC announced the outcome of the first round of CRF bids (DLUHC, Citation2021e).
The aim of this study is to use the UK government’s methodology to construct an economic resilience index (ERI) for English regions and to assess the relationship between economic resilience and the allocation of the first round of CRF.
MATERIALS AND METHODS
Geography
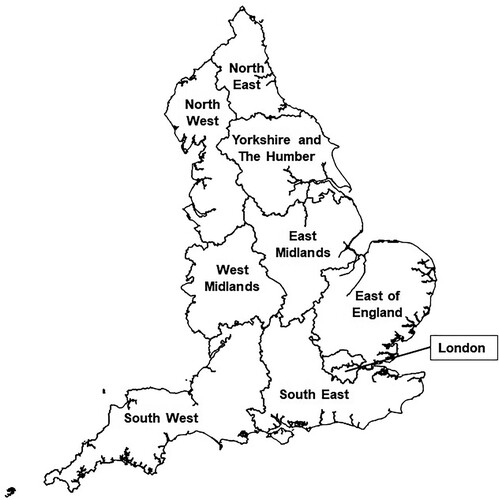
There are nine regions in England, within which sit London boroughs, local authority (LA) districts and unitary authorities (Office for National Statistics (ONS), Citation2021f) (). In some areas, a two-tier structure exists with both districts, or lower tier local authorities (LTLA), and unitary authorities, or upper tier local authorities (UTLA). In this analysis, data were obtained at LTLA and UTLA levels for England. UTLAs that are already covered by composite LTLAs were removed from the dataset so there was no geographical duplication. The resulting dataset had 317 LA areas, with a median population size of 139,968 (interquartile range (IQR) = 101,462–216,374). As the indicator data were from 2019, corresponding Shapefiles were used for mapping (ONS, Citation2020).
Figure 1. The nine regions of England.
Indicators
The UKERI is comprised of five indicators covering productivity, skills, unemployment, population density and household income (). Indicators were selected to identify places with poor economic performance, and likely less able to resist and recover from shocks (DLUHC, Citation2021c). Communities in this context are defined as places consistent with existing administrative boundaries, for example, upper and lower tier LAs in England.
Table 1. Description of indicators, adapted from UK government website (DLUHC, Citation2021c).
Income is a commonly used indicator of economic resilience and gives a measure of the economic vitality of a place. In the UKERI, gross disposable household income (GDHI) per head at 2019 prices is the measure that is used (ONS, Citation2021d). GDHI was chosen instead of wages to reflect the income that residents have available to spend. Gross value added (GVA) per hour worked was used to assess the productivity of businesses in a place (ONS, Citation2021e). As this is a workplace-based measure, it offers a different way of measuring the strength of the local economy. The rationale for including this measure in the UKERI is that the CRF could support inventions to strengthen businesses.
Model-based unemployment rates for the population aged 16 years and over were used to measure the labour market efficiency (ONS, Citation2021c). This measure does not include people who are economically inactive (e.g., long-term sick, retired, students), as the focus is on employment opportunities for the economically active population and the potential for removing barriers to the labour market. The skills gap in a population is measured by the proportion of persons aged 16–64 with no qualifications (ONS, Citation2021a). A measure of the lack of qualifications was chosen to identify places where there are challenges in accessing the labour market. Higher unemployment and lower skills are assumed to make a place less economically resilient.
Population density is measured as the number of people aged 16–64 per km2 of land area (ONS, Citation2021b). Higher population density is assumed to contribute to economic resilience through stronger and more diverse labour markets. As this assumption is linked to labour markets, only the working age population is included in the density calculation.
Missing data
Where variables were missing for LTLA, but present for UTLA, the UTLA value was used for constituent LTLAs (Buckinghamshire and Northamptonshire). Following initial collation, data on qualifications were missing for Hart (Hampshire), Craven (North Yorkshire), the City of London and the Isles of Scilly. Unemployment data was also missing for the City of London and the Isles of Scilly. Isles of Scilly were excluded from the analysis as no alternative data sources were available. Data from relevant National On-line Manpower Information System (NOMIS) LA profiles were used to populate the other missing data fields (ONS, Citation2019).
Index construction
The productivity (GVA), household income (GDHI) and population density indicators were transformed using natural logarithm as the relative differences between communities were deemed to be more important than the absolute differences. Percentile ranks were used to normalise the data and to improve comparability across different units of measurement (Nardo et al., Citation2005). A Spearman’s rank matrix was used to test the correlation of variables.
The weighting scheme employed in developing the official UKERI was skills (20%), employment (20%), population density (20%), productivity (30%) and household income (10%). The rationale for these weightings was that the productivity indicator was considered a stronger predictor of local economy resilience than household income. This weighting scheme is reproduced for the ERI. The ranked scores were accordingly weighted and summed to generate an economic index score for each area (maximum score = 100). A higher index score indicates greater economic resilience, so the rankings for unemployment and skills that are negatively associated with resilience were reversed. The ERI score for each region (ERIreg) was calculated using a population-weighted mean ERI score for its component LA areas.
Expected-share allocations
A list of successful CRI bids published by the UK government was used to compile the total funding allocation for each English region (DLUHC, Citation2021e). The inverse standardised resilience ratio (InvSRRreg) of each region was then calculated by dividing the regional resilience score (ERIreg) by the mean resilience score in England (ERIeng). This figure was inverted because areas with lower resilience should receive higher funding (1):
(1)
(1) A regional weighting factor (WFreg) was calculated from the standardised resilience ratio (2). This weighting factor was applied to the total spending to date on the CRF (CRFtot) (3) and the Shared Prosperity Fund (SPFtot) to calculate a ‘fair share’ (FSreg) allocation based on regional resilience (4). Finally, a linear extrapolation of first round CRF allocation was used to project SPF allocation.
(2)
(2)
(3)
(3)
(4)
(4)
RESULTS
Correlation analysis showed that r < 0.7 for all indicator comparisons, so all five indicators were retained in the index. The mean resilience score in England was 46.0, ranging from 28.5 (North East) to 65.6 (London). Total spending in the first round of the CRF in England was £125.56 million. London and all regions in the North received less than their expected share allocation of the CRF, with the least resilient region in England (North East) receiving £13.4 million less (). There was no significant correlation between regional ERI and CRF allocations (r = −0.16, p = 0.68) ().
Figure 2. Relationship between Community Renewal Fund (CRF) allocation and economic resilience in English regions.
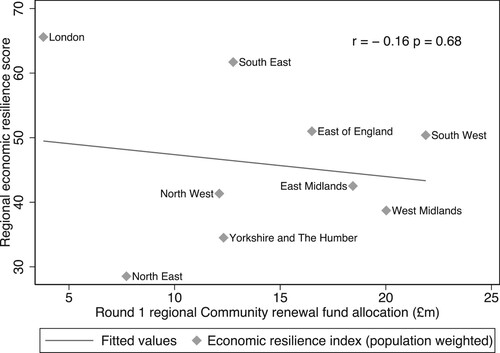
Table 2. Regional economic resilience index (ERI) scores, actual and expected Community Renewal Fund (CRF) allocations for English regions.
The stated value of the SPF is £1.5 billion. If this fund was allocated according the expected-share calculation (4) then regional funding allocation would range from £109.7 million for London to £252.1 million for the North East (). The projections for SPF allocation based on the first round of CRF bids show that the North could receive £250.6 million less than their expected share based on economic resilience scores.
Table 3. Shared prosperity fund (SPF) projections and expected share allocations for English regions.
DISCUSSION
The North of England is comprised of the three regions with the lowest economic resilience in England. Expected share funding allocations for the CRF and SPF were calculated based on regional economic resilience scores. Northern regions received £21 million less than their expected share of first round CRF funding. There was no significant correlation between regional economic resilience and CRF allocations. If a similar allocation methodology were used for the SPF, Northern regions could be underfunded by £250 million.
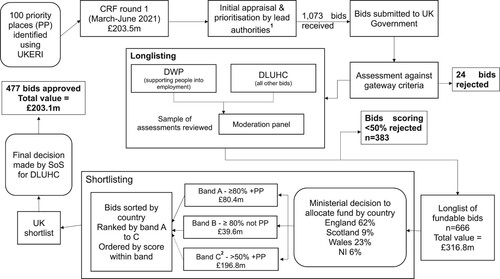
The CRF allocation process involved multiple stages, with the UKERI being used at the outset to identify 100 priority places (). The stated purpose of the UKERI was to ensure that CRF funding reached places with the greatest economic need (DLUHC, Citation2021c). Of the total funding allocation for England, £96.4 million (76.8%) went to lead authorities in which a priority place was identified. The majority of longlisted projects were from priority places which scored over 50%, but less than the 80% threshold for guaranteed shortlisting (band C). Band C projects were only progressed to the shortlist if there was sufficient funding within the national budget allocation. A ministerial decision was taken to allocate funding between the UK countries to create these national budgets. The rationale for this was not explained, but it does not appear to be based on the distribution of priority places (England, 73%; Scotland, 13%; Wales 14%). In Wales, which received 23% of the CRF funding allocation, projects from non-priority areas scoring less than 80% were shortlisted in order to fill their national allocation (DLUHC, Citation2021b).
Figure 3. Community Renewal Fund (CRF) allocation process based on an explanatory note from the Department for Levelling up, Housing and Communities (DLUHC) (Citation2021b).
The UKERI is an example of a composite indicator, a mathematical combination of a set of indicators used to summarise complex or multidimensional issues (Saisana & Tarantola, Citation2002). Composite indicators can be used to support decision making and the allocation of funding (Zamboni & Martin, Citation2020). The use of an index in the allocation of levelling up funding, despite its limitations, has been recognised as a positive development (Fransham et al., Citation2023). Furthermore, given how the UKERI was deployed, a key limitation of the index is that it pertains only to economic resilience.
The Levelling Up White Paper refers to six ‘capitals’ (physical, human, intangible, financial, social and institutional) which act in combination as drivers of spatial disparities (UK Government, Citation2022). These capitals are similar to frameworks of community resilience, which has been measured using composite indicators (Cutter et al., Citation2010; Malik, Citation2018; Sherrieb et al., Citation2010). Levelling up is a highly complex concept that requires a comprehensive understanding of the interactions between capitals, which lead to some places being left behind (Martin et al., Citation2022). The funding allocation process could be strengthened by using a multidimensional composite indicator to assess place-based resilience (Folmer & Heijman, Citation2005).
The Levelling Up agenda offers an opportunity to address longstanding inequalities. However, concerns have been raised that funding allocation is insufficient (Lacobucci, Citation2022; Marmot, Citation2022) and not being distributed according to need (Ungoed-Thomas, Citation2022). Austerity measures have unequally impacted LAs, meaning those most in need of levelling up funding may lack resources to engage in a competitive bidding process (Fransham et al., Citation2023). This paper presents a transparent approach for allocating levelling up funding to English regions based on economic resilience scores derived from a methodology published by the UK government. The current methodology for CRF allocation runs the risk of widening existing inequalities rather than ‘levelling up’. Allocation of funding at a regional level based on an objective measure of need and involving local leaders in decision making could help in mitigating this risk.
AUTHOR CONTRIBUTIONS
Christine Camacho: conceptualisation, methodology, data curation, formal analysis, visualisation, writing – original draft preparation; Roger Webb: conceptualisation, writing – review and editing, supervision; Peter Bower: conceptualisation, writing – review and editing, supervision; Luke Munford: conceptualisation, methodology, writing – review and editing, supervision.
ETHICAL APPROVAL
No ethical approval was required for this secondary analysis of data.
DATA AVAILABILITY
The data used in this manuscript are publicly available and data sources are referenced
DISCLOSURE STATEMENT
No potential conflict of interest was reported by the authors.
Additional information
Funding
Notes
1 Brexit is shorthand for ‘British Exit’ and refers to the withdrawal of the UK from the European Union in January 2020.
REFERENCES
- Bambra, C. L., Munford, L., Brown, H., Wilding, A., Robinson, T., Holland, P., Barr, B., Hill, H., Regan, M., & Rice, N. (2018). Health for wealth: Building a healthier Northern Powerhouse for UK productivity. Northern Health Sciences Alliance. https://eprints.whiterose.ac.uk/146595/.
- Buchan, I. E., Kontopantelis, E., Sperrin, M., Chandola, T., & Doran, T. (2017). North–South disparities in English mortality, 1965–2015: Longitudinal population study. Journal of Epidemiology and Community Health, 71(9), 928–936. https://doi.org/10.1136/jech-2017-209195
- Cutter, S. L., Burton, C. G., & Emrich, C. T. (2010). Disaster resilience indicators for benchmarking baseline conditions. Journal of Homeland Security and Emergency Management, 7(1), Article 51. https://doi.org/10.2202/1547-7355.1732.
- Department for Levelling Up, Housing and Communities (DLUHC). (2021a). List of 100 priority places. https://assets.publishing.service.gov.uk/government/uploads/system/uploads/attachment_data/file/966987/List_of_Places__A-Z_pdf.
- Department for Levelling Up, Housing and Communities (DLUHC). (2021b). UK community renewal fund: Explanatory note on the assessment and decision-making process. https://www.gov.uk/guidance/uk-community-renewal-fund-explanatory-note-on-the-assessment-and-decision-making-process.
- Department for Levelling Up, Housing and Communities (DLUHC). (2021c). UK community renewal fund: prioritisation of places methodology note. https://www.gov.uk/government/publications/uk-community-renewal-fund-prospectus/uk-community-renewal-fund-prioritisation-of-places-methodology-note.
- Department for Levelling Up, Housing and Communities (DLUHC). (2021d). UK community renewal fund: Prospectus 2021–22. https://www.gov.uk/government/publications/uk-community-renewal-fund-prospectus/uk-community-renewal-fund-prospectus-2021-22.
- Department for Levelling Up, Housing and Communities (DLUHC). (2021e). UK community renewal fund: Successful and unsuccessful bids. https://www.gov.uk/government/publications/uk-community-renewal-fund-successful-bids.
- Dorling, D. (2010). Persistent north-south divides. In The economic geography of the UK (pp. 12–28). Sage Publications. https://doi.org/10.4135/9781446269374.n2.
- Folmer, H., & Heijman, W. (2005). Multi-dimensional regional inequality as an alternative allocation mechanism For EU structural funds remittances: The case of Spain and Hungary. The Annals of Regional Science, 39(2), 337–352. https://doi.org/10.1007/s00168-004-0222-9
- Foster. (2007). A case study approach to understanding regional resilience. Institute of Urban and Regional Development. https://escholarship.org/uc/item/8tt02163.
- Fransham, M., Herbertson, M., Pop, M., Bandeira Morais, M., & Lee, N. (2023). Level best? The levelling up agenda and UK regional inequality. Regional Studies, 0(0), 1–14. https://doi.org/10.1080/00343404.2022.2159356
- Lacobucci, G. (2022). ‘Levelling up’ plan needs more funding and a focus on health inequalities, say experts. BMJ, 376, o303. https://doi.org/10.1136/bmj.o303
- Malik, A. (2018). A tale of two cities quantifying & validating the localized resilience capacity of New York & Houston through data-driven measures of community robustness & recovery. Dissertation Abstracts International: Section B: The Sciences and Engineering [Doctoral dissertation], 80(5-B(E)). New York University Tandon School of Engineering.
- Manyena, S. B. (2006). The concept of resilience revisited. Disasters, 30(4), 434–450. https://doi.org/10.1111/j.0361-3666.2006.00331.x
- Marmot, M. (2022). The government’s levelling up plan: A missed opportunity. BMJ, 376, o356. https://doi.org/10.1136/bmj.o356
- Martin, R., Pike, A., Sunley, P., Tyler, P., & Gardiner, B. (2022). ‘Levelling up’ the UK: Reinforcing the policy agenda. Regional Studies, Regional Science, 9(1), 794–817. https://doi.org/10.1080/21681376.2022.2150562
- Munford, L., Khavandi, S., Bambra, C., Barr, B., Davies, H., Doran, T., Kontopantelis, E., Norman, P., Pickett, K., & Sutton, M. (2021). A year of COVID-19 in the North: Regional inequalities in health and economic outcomes.
- Nardo, M., Saisana, M., Saltelli, A., & Tarantola, S. (2005). Tools for composite indicators building. European Commission, Ispra, 15(1), 19–20. https://www.researchgate.net/profile/Michaela-Saisana/publication/277294848_Tools_for_Composite_Indicators_Building/links/55c4894b08aeca747d607ce2/Tools-for-Composite-Indicators-Building.pdf
- Office for National Statistics (ONS). (2019). Local Authority Profile—Nomis—Official Census and Labour Market Statistics. https://www.nomisweb.co.uk/reports/lmp/la/contents.aspx.
- Office for National Statistics (ONS). (2020). Local Authority Districts (December 2019) Boundaries UK BGC. https://data.gov.uk/dataset/51878530-7dd4-45df-b36b-9a0b01f3c136/local-authority-districts-december-2019-boundaries-uk-bgc.
- Office for National Statistics (ONS). (2021a). Annual population survey—Nomis—Official Census and Labour Market Statistics. https://www.nomisweb.co.uk/datasets/apsnew.
- Office for National Statistics (ONS). (2021b). Estimates of the population for the UK, England and Wales, Scotland and Northern Ireland. https://www.ons.gov.uk/peoplepopulationandcommunity/populationandmigration/populationestimates/datasets/populationestimatesforukenglandandwalesscotlandandnorthernireland.
- Office for National Statistics (ONS). (2021c). M01 Regional labour market: Modelled unemployment for local and unitary authorities. https://www.ons.gov.uk/employmentandlabourmarket/peoplenotinwork/unemployment/datasets/modelledunemploymentforlocalandunitaryauthoritiesm01.
- Office for National Statistics (ONS). (2021d). Regional gross disposable household income: Local authorities by ITL1 region. https://www.ons.gov.uk/economy/regionalaccounts/grossdisposablehouseholdincome/datasets/regionalgrossdisposablehouseholdincomelocalauthoritiesbyitl1region.
- Office for National Statistics (ONS). (2021e). Subregional productivity: Labour productivity indices by local authority district. https://www.ons.gov.uk/employmentandlabourmarket/peopleinwork/labourproductivity/datasets/subregionalproductivitylabourproductivityindicesbylocalauthoritydistrict.
- Office for National Statistics (ONS). (2021f). England—Detailed information on the administrative structure within England. https://www.ons.gov.uk/methodology/geography/ukgeographies/administrativegeography/england.
- Saisana, M., & Tarantola, S. (2002). State-of-the-art report on current methodologies and practices for composite indicator development (Vol. 214). Citeseer.
- Sherrieb, K., Norris, F. H., & Galea, S. (2010). Measuring capacities for community resilience. Social Indicators Research, 99(2), 227–247. https://doi.org/10.1007/s11205-010-9576-9
- UK Government. (2022). Levelling up the United Kingdom: Presented to parliament by the secretary of state for levelling up, housing and communities by command of Her Majesty. UK Government. https://assets.publishing.service.gov.uk/government/uploads/system/uploads/attachment_data/file/1052064/Levelling_Up_White_Paper_HR.pdf.
- Ungoed-Thomas, J. (2022, September). Revealed: Levelling up fund allocated south-east twice as much as north-east. The Observer. https://www.theguardian.com/politics/2022/sep/04/revealed-levelling-up-fund-allocated-south-east-twice-as-much-as-north-east.
- Windle, G. (2011). What is resilience? A review and concept analysis. Reviews in Clinical Gerontology, 21(2), 152–169. https://doi.org/10.1017/S0959259810000420
- Zamboni, L., & Martin, E. (2020). Distributing local resources for public health preparedness grants: A data-driven approach. Journal of Public Health Management And Practice, 26(4), 349–356. https://doi.org/10.1097/PHH.0000000000000824