
 ?Mathematical formulae have been encoded as MathML and are displayed in this HTML version using MathJax in order to improve their display. Uncheck the box to turn MathJax off. This feature requires Javascript. Click on a formula to zoom.
ABSTRACT
Firms may grow and decline, and their impact on the regional economy can be attributed not only to each firm but also to their inter-firm networks in the region. Therefore, firms and their connectivity should be understood within the context of the regional industrial ecosystem. To empirically show the role of inter-firm networks for the sustainability of the regional industrial ecosystem, this study analyses the automotive industry in South Korea. The Automobile Parts Yearbook, the main data source for the study, provides the addresses of 892 firms and the connectivity between five major automakers and their subcontractors. A network-based approach is chosen to untangle the complex production network and compare the network structure by region. Specifically, the number of nodes, links and connections, as well as density and modularity measures, are analytically compared across six sub-regions in the country. There are more links within the groups than between the groups, which suggests preferential attachment in the network structure. Multiple centralised structures are observed to exist around the five major automakers in sub-regions in South Korea. The empirical results of the paper imply that firms with multiple trading networks in the regional industrial ecosystem tend to recover from an industrial crisis or employment shock crisis more successfully than companies with a single trading network. Overall, these findings highlight the importance of understanding the role of inter-firm networks in regional industrial ecosystems for promoting sustainability and resilience.
1. INTRODUCTION
The growth and decline of firms affect regional economy. Although firms can enter and exit a regional economy, sustaining existing industries is as important as creating new industries in one region. However, there are cities that no longer sustain their traditional manufacturing industry. Gunsan, one of the automotive industry regions in South Korea, is a representative case.
Firms that are major components of the industrial ecosystem may leave a region because of economic crises and shocks. However, the regional industrial ecosystem can be maintained through the entry of new firms and industries into the production network. Vulnerability and resilience to shocks depend on the network structure embedded in an industrial ecosystem in regions. Therefore, understanding the industrial network is an important step in the decision-making process for anticipating future crises and preparing for them. To suggest an example of this step, this study empirically analyses inter-firm transactions in the South Korean automotive industry.
Considering the importance of the network structure of the industrial ecosystem, this study takes a network approach and investigates inter-firm transaction networks. While a firm minimises transaction costs by internalising searching, bargaining and decision-making (Coase, Citation1937), maximising profit in an industry is affected by transactions with other firms. If companies possess multiple transaction networks in the regional industrial ecosystem, they are more likely to recover from an industrial or employment shock crisis than companies with a single transaction network. If there are many companies with multiple trading networks in a region, the regional industrial ecosystem will be healthy, subsequently making the regional economy more sustainable when economic shocks and structural changes affect the industry and regional economy.
While the conceptual framework of industrial commons and ecosystems (Moore, Citation1997; Pisano & Shih, Citation2012) has been used in many empirical studies, a network-based analysis of regional industrial ecosystems (Boschma, Citation2015; Crespo et al., Citation2016) and regional economic resilience (Evenhuis, Citation2017; Fröhlich & Hassink, Citation2018; Martin, Citation2012) has been overlooked in previous literature. This study attempts to fill this gap by incorporating a social network analysis into the inter-firm transaction network of the automotive industry in South Korea.
This study empirically analyses the inter-firm networks of regional industrial ecosystems by asking the following two research questions:
Which regional industrial ecosystems experience less impact and recover faster during economic shocks?
What conditions are needed for the extinction of a firm, not resulting in the extinction of the region?
2. INDUSTRIAL ECOSYSTEMS IN REGIONS
The major developmental factor of industrial ecosystems is the role of linkages within the entire industrial ecosystem (Iansiti & Levien, Citation2004a). In particular, the role of a keystone company is essential in the system industry, where an extensive network of partners, such as automobiles, shipbuilding, semiconductors and displays, intervenes in the production of final goods. Pisano and Shih (Citation2012) stated that every industry has a series of technical and operational capabilities, some of which are shared between companies or industries. The technology, know-how and capabilities that underpin the industrial commons accumulate over time. Porter and Stern (Citation2001) argued that creating quality jobs in a region requires developing the regional economic commons or the regional industrial ecosystem. However, a rigid hierarchical structure can hinder innovation in the region (Galaso, Citation2018). Crespo et al. (Citation2014) attempted to typify knowledge networks by using the concepts of hierarchy and heterogeneity. Even in a hierarchical network, the rigidity characteristic of hierarchical networks can be resolved, and openness to new knowledge can be maintained if the heterogeneous exchange between the centre and periphery can be actively maintained (Crespo et al., Citation2016).
The lifecycle of an industrial ecosystem is closely related to the resilience of the regional economy. The concept of resilience began with the capability to respond to changes and shocks from phenomena like natural disasters. If the concept is applied to the regional economy, it refers to the capability to respond to unpredictable external shocks stemming from economic crises or technological changes (Martin, Citation2012). Recently, economic geographers have turned to regional resilience to answer the question of recovery or demolition of regional economies (Evenhuis, Citation2017; Fröhlich & Hassink, Citation2018). From an evolutionary perspective, regional resilience has been redefined in terms of adaptation and adaptability. While adaptation has been closely associated with path dependency, resilience literature defines adaptability as a move away from path dependency (Boschma, Citation2015). If the regional industrial structure is too specialised and concentrated in a few industries, it may lead to instability in the regional economy by inhibiting the effect of risk dispersion (Nahm, Citation2016).
Transactions between firms with a linkage of technology and knowledge can mitigate this instability. The more partner companies, the more abundant the industrial ecosystem, and the greater the likelihood that future leading companies will rise. Rong et al. (Citation2021) emphasised that the continuous exchange of technology and knowledge contributes to the establishment of a regional industrial technology innovation ecosystem. Regional productivity, robustness and innovativeness are the major developmental factors of industrial ecosystems (Iansiti & Levien, Citation2004b). The keystone or leading company takes the role of linking the entire industrial ecosystem. For example, the South Korean automobile industry is dominated by a few leading companies, including Hyundai and Kia. The entire system can only be maintained if partner companies support the leading company. In the last decade, however, the economy entered an era of industrial convergence which combines hardware, software, services and infrastructure. The expansion effect of ecosystems, in which competition and cooperation between industries of the same or different types frequently occur, is intensifying (Iansiti & Levien, Citation2004a). In this respect, it is important to analyse how sensitively the regional industrial ecosystem reacts to and recovers from a regional economic crisis or shock.
3. CASE STUDY INTRODUCTION
The South Korean automotive industry was chosen as a case study for the following reasons. First, the automotive industry consists of a wide range of companies, subsidiaries, organisations and institutions; thus, it is an ideal case for applying the concept of the industrial ecosystem. Second, some cities and regions in the country are highly dependent on industry; thus, regional economies are vulnerable to the crisis of the industry. For instance, the closure of the GM plant in Gunsan led to the collapse of the regional economy.
The automotive industry in South Korea is geographically concentrated in two regions: the Seoul Capital Area and Southeast Region. Beginning in Incheon, one of the first modern cities in the late 19th century, Seoul and its surrounding areas hosted manufacturing factories in diverse industrial sectors. The second one around Busan and Ulsan has historically formed a hub of heavy industries, such as the chemical and shipbuilding industries, with the advantage of accessibility to ports. Following the two main regions, there are small regional clusters of the automotive industry in the Chungcheong and Honam regions where Gunsan is located.
Gunsan is adjacent to the national and regional industrial complex, which houses relatively many component makers established in the 1990s and used to be the site of Daewoo Motors (now GM Korea). The site has served as a major component maker complex and developed into an automobile industrial complex with advantages such as low logistics costs and technology information sharing. According to Statistics Korea, however, the closure of GM Korea’s Gunsan plant led to a decrease in the employment rate in Gunsan from 55.6% in 2013 to 53.1% in 2018. The unemployment rate rose from 1.9% to 4.1% in the same period. As the Gunsan case implies, a crisis in a specific industry could have a significant impact on the regional economy and industrial ecosystem.
This study analyses the network among automotive firms using the 2018 Automobile Parts Yearbook data of the Korea Automobile Association. The Automobile Parts Yearbook contains data and addresses related to the transactions of automakers and parts suppliers, thus enabling a regional analysis of the network between automakers and suppliers. The scope of this study is nationwide, with 17 regions, including 892 parts suppliers and five major automakers (Hyundai, Kia, GM Korea, Renault Samsung and SsangYong).
4. METHODOLOGY
This empirical study applies a network-based approach to the automotive industry in South Korea. Network-based analysis focuses on the structure and quality of social relations (Uzzi, Citation1996). Social network analysis is widely used in the previous literature to show the structural connectivity and centrality of the network and visualise the relationships between actors in the form of nodes and links (Wasserman & Faust, Citation1994). Since the automotive industry consists not only assembly companies but also numerous subsidiaries and subcontractors, the complex relations of firms and the network structure embedded in the industry can be effectively revealed by a social network analysis. It can also visually and quantitatively show both important and marginalised participants in the automotive industrial ecosystem. In the following sections, the derived characteristics of the network structure show the characteristics of the industrial ecosystem in terms of interconnectivity between the firms constituting the system.
The dataset used for the empirical study provides information for directional networks; that is, when firm i provides products to firm j, the relationship between the firms can be transformed into a directional adjacency matrix. Each value in the matrix represents the relationship between firms i and j as 0 and 1. Since a transaction relationship is directional, the in-degree of the node is the number of links coming into the node, whereas the out-degree is the number of links going out from the node. Three measures were calculated to understand the characteristics of the network by region. First, the average connection degree is the total number of connections in the network divided by the total number of nodes in the network. A higher than average degree of connection indicates that each company is more interconnected than others.
A higher average degree of connection indicates that each company is more interconnected than others. Second, density is an indicator of how tightly the nodes are connected in a network. It numerically expresses the degree to which interactions between actors. Network density is defined as the ratio of the total number of possible relationships to the number of relationships actually formed.
Third, modularity is defined as the number of links in the current group minus the number of links in the other groups in the network. It is used as an indicator to measure the level of clustering, with values closer to one indicating a higher level of clustering.
is the adjacency matrix with a value of 0 or 1; and
= 1 if group
to which node i belongs is the same as group
to which j belongs, and 0 otherwise.
5. RESULTS
Beginning with the construction of industrial complexes in the 1970s, parts suppliers began to locate in regions all over the country. According to an analysis of 892 automobile parts suppliers nationwide based on 2018, they were concentrated in three regions: Gyeonggi, Gyeongnam and Chungnam (). The regions with the highest connectivity were Gyeonggi, Seoul, Incheon and Chungnam where the assembly plants of the major automakers are located. A total of 412 (46.2%) suppliers were located in the top three regions: Gyeonggi (197, 22.1%), Gyeongnam (128, 14.3%) and Chungnam (87, 9.8%) (). According to the analysis by city/county/district, major regions by the number of locations were Gimhae-si in Gyeongnam, Hwaseong-si in Gyeonggi, Ansan-si in Gyeonggi, Asan-si in Chungnam and Changwon-si in Gyeongnam. Around 2.2% of automobile parts suppliers were located in Gunsan-si, Jeonbuk, where the Gunsan plant of GM Korea is located.
Figure 1. Firms in the automotive industry by region in South Korea.
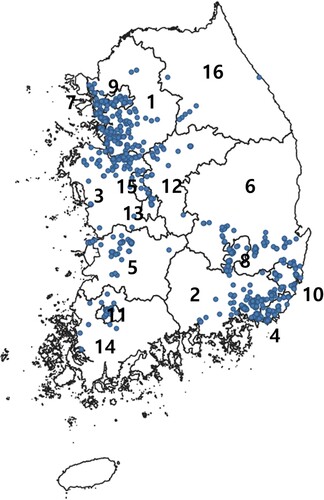
Table 1. Firms in the automotive industry by region in South Korea.
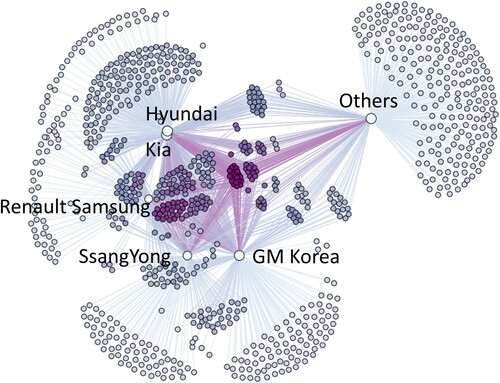
The network structure of the industry derived from the inter-firm transaction data is shown in . The graph’s layout of the analytical results was obtained using Yifan Hu analysis (Khokhar, Citation2015). The nodes were set such that, as the number of links increases, the circle grows in size. The larger the node, the more transactional relationships a company has. This signifies that the company is highly interconnected. There are more links in the groups than between the groups, in other words, the network structure also shows preferential attachment. The network graph of the production network indicates the local interconnection process of suppliers centred around automakers such as Hyundai, Kia and GM Korea. The other nodes indicate companies other than Hyundai, Kia, Renault, SsangYong and GM Korea and also companies connected to secondary vendors. Darker node groups indicate nodes with a higher out-degree value, that is, a company group with multiple trading networks.
Figure 2. Structure of the production network in the South Korean automotive industry.
shows the results of analysing company networks by region. The Seoul Capital Area, Chungcheong region and Southeast region showed a similar structure to the nationwide network. The regions with the most nodes were those with the most automobile parts manufacturers, which are the Seoul Capital Area, Southeast region and Chungcheong region. The average number of company transactions was 3.9 nationwide, 4.1 in the Seoul Capital Area and 4.2 in the Chungcheong region. Meanwhile, those of the Gangwon, Honam and Daegyeong regions were lower than the nationwide averages. The results for the Seoul Capital Area and the Chungcheong region indicate that the trading network of one company comprises at least four companies.
Figure 3. Structure of the production network by region. First row: 3-1. Seoul Capital Area: Seoul, Gyeonggi, Incheon; 3-2. Gangwon region; 3-3. Chungcheong region: Daejeon, Chungnam, Chungbuk. Second Row: 3-4. Daegyeong region: Daegu, Gyeongbuk; 3-5. Honam region: Gwangju, Jeonnam, Jeonbuk; 3-6. Southeast region: Busan, Ulsan, Gyeongnam.
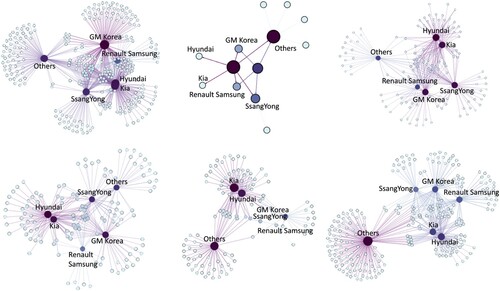
By region, the nodes with the largest degree values in the Seoul Capital Area were GM Korea, Hyundai and Kia, in that order. This result is attributed to GM Korea’s automobile assembly plant, research and development (R&D) team and headquarters in Incheon. The nodes with the largest degrees in the Chungcheong region were Hyundai, Kia and GM Korea. The Hyundai Motors Asan plant is located in Asan, Chungnam, which confirms that it is interconnected with multiple suppliers in Chungnam. However, even though GM Korea’s Gunsan plant is located in the Honam region, the connectivity between companies was low. The average degree was 1.5, which is lower than the nationwide average of 1.9. Kia had the highest degree in the Honam region and its high connectivity is attributed to Kia’s plant in Gwangju.
presents the analysis results for the basic properties of the network. Of the 898 nodes in South Korea, 297 were in the Seoul Capital Area, 244 in the Southeast region and 136 in the Chungcheong region. As the nodes represent each company, the Seoul Capital Area and the Southeast region were determined to be the locations housing the most companies. The number of links, which indicates the status of each company, was 1759 nationwide, with 611 in the Seoul Capital Area and 411 in the Southeast region. Thus, the number of connections was high in regions with many nodes, suggesting that many companies are located in the regions.
Table 2. Results of inter-company networks by region.
The average degree of connection was 1.957 nationwide, 2.132 in the Chungcheong region and 2.016 in the Daegyeong region. The average degree of connection in the Chungcheong region was high, indicating that many firms with multiple trading networks are located in the Chungcheong region compared with the Seoul Capital Area and the Daegyeong region. Its density was 0.002 nationwide; it was the highest in the Gangwon region, followed by the Honam region. The observed density was generally inversely proportional to population size. From these analytical results, the density was also high in the Gangwon region, where the number of nodes and links was the lowest. Modularity, one of the most common techniques for exploring populations in large-scale network analyses, was 0.387 nationwide, 0.463 in the Southeast region and 0.433 in the Honam region. The Southeast and Honam regions showed higher levels of clustering in automobile companies than nationwide.
6. DISCUSSION
6.1. Proximity
According to the analytical results of the automobile industrial ecosystem network by region, interconnectivity with suppliers was high in regions where each automaker’s plant was located. This indicates that geographical proximity exists in the network of automakers and suppliers. Due to the modularisation of automobile parts, geographical proximity still plays an advantage for automakers and parts suppliers. This also implies that automotive firms in the industrial network tend to have preferential attachment, suggesting that the nodes are connected according to a preference pattern rather than through random interaction (Jeong, Citation2003). Regarding the possibility of a real-world network structure (Barabasi & Frangos, Citation2002), the network type of the automobile industrial ecosystem showed a multi-hub connection type. A multi-hub network has multiple hub nodes, with each node locally gathered around the hub nodes.
6.2. Network density
The results of the network-based analysis demonstrate that the Korean automotive industry has multi-centralised or decentralised structures. Large companies in the network, including Hyundai, Kia and GM Korea, were major players in the inter-firm network. Multiple centralised structures were formed around these companies. The density measure shows to what extent firms agglomerate and are closely connected in the industrial ecosystem. In the case of the automotive industry, high density implies agglomeration of inter-firm transactions among actors in the industrial ecosystem. However, the scale-dependent property of density makes it difficult to compare density measures across regions with different numbers of nodes. For example, regions with a small number of firms could have a high density if they are connected to others close to the regions. Furthermore, density does not reveal to what extent an industrial ecosystem is dependent on a large firm. Therefore, other types of measures, such as the average degree and modularity, can complement the gap which could be overlooked by density.
6.3. Network degree
The average degree shows to what extent a firm has connections via transactions with other firms, on average. It treats all firms equally because the size and network position of firms are not considered in the calculation. This measure implies that an external shock can be shared with a diversified network if a node has many links to other nodes. For example, in the empirical results, the average degrees found in the Seoul Capital Area, Chungcheong and Daegyeong regions were higher than those in the other regions. Regions with a high average degree are considered to be more resilient because their network structure can absorb external shocks more effectively. As witnessed in the case of the Gunsan Plant in the Honam region, the regional industrial ecosystem is vulnerable to a crisis that emerged from a single large firm.
6.4. Network modularity
High modularity suggests more links within groups than between groups. This shows to what extent subsidiaries are tightly connected to a few leading companies in a region. For example, modularity measures found in the Honam and Southeast regions were much higher than those in other regions. This implies that the industrial ecosystems of the two regions are highly dependent on keystone companies such as Hyundai, Kia and GM. Therefore, a shock to keystone companies can spread to part suppliers more severely through the centralised network structure in the industrial ecosystem. A crisis can also be caused by managerial decisions made at headquarters located in other regions or countries. The closure of a GM plant in Gunsan showed that the decisions of multinational enterprises can affect the industrial ecosystem and regional economy. This also implies that regions with high modularity may be less resilient to future shocks.
7. CONCLUSIONS
This study contributes to the literature on industrial ecosystems by analysing inter-firm transaction networks, rather than focusing on individual actors. We argue that it is important to have a multi-trade network structure with multiple companies rather than relying on one company. This can result in a regional industrial ecosystem where businesses and regions coexist with sustainable competitiveness and stable growth.
However, the dataset used for the empirical investigation is limited as the quantity of inter-firm transactions is omitted. If such data are available for future research, an analysis of the weighted network can reveal the relative importance of each node and link. Furthermore, accumulating multiple years of time series data is more promising in future research, whereas this study is based on data from 2018. For example, it is possible to analyse inter-firm network structures and networks by region during the 1998 and 2009 economic crises. This will determine if the inter-firm transaction network changes from a single trading network to multiple trading networks or a different network structure.
Historical lessons teach us that a structural change and economic shock in the industry brings about a crisis for large companies, and subsequently, an impact on the industrial ecosystem and regional economy; for example, GM closed plants in Janesville (in 2008, United States) and Holden (in 2007, Australia). The community suffered an economic shock: suppliers broke, downtown businesses sagged and incomes plummeted (CBS, Citation2018). As this study suggests, social network analysis can show how the regional industrial ecosystem is vulnerable to shocks. If a similar dataset on inter-firm linkages is available, a proactive diagnosis of regional resilience can be made in industries and regions other than the case study of the paper.
DISCLOSURE STATEMENT
No potential conflict of interest was reported by the authors.
Additional information
Funding
REFERENCES
- Barabasi, A., & Frangos, J. (2002). Linked: The new science of networks science of networks. Perseus.
- Boschma, R. (2015). Towards an evolutionary perspective on regional resilience. Regional Studies, 49(5), 733–751. https://doi.org/10.1080/00343404.2014.959481
- CBS. (2018, December 27). 10 years after a GM plant closed, new hope in Janesville, Wisconsin. https://www.cbsnews.com/news/after-gm-plant-closed-new-hope-in-janesville-wisconsin/
- Coase, R. H. (1937). The nature of the firm. Economica, 4(16), 386–405. https://doi.org/10.1111/j.1468-0335.1937.tb00002.x
- Crespo, J., Suire, R., & Vicente, J. (2014). Lock-in or lock-out? How structural properties of knowledge networks affect regional resilience. Journal of Economic Geography, 14(1), 199–219. https://doi.org/10.1093/jeg/lbt006
- Crespo, J., Suire, R., & Vicente, J. (2016). Network structural properties for cluster long-run dynamics: Evidence from collaborative R&D networks in the European mobile phone industry. Industrial and Corporate Change, 25(2), 261–282. https://doi.org/10.1093/icc/dtv032
- Evenhuis, E. (2017). New directions in researching regional economic resilience and adaptation. Geography Compass, 11(11), e12333. https://doi.org/10.1111/gec3.12333
- Fröhlich, K., & Hassink, R. (2018). Regional resilience: A stretched concept? European Planning Studies, 26(9), 1763–1778. https://doi.org/10.1080/09654313.2018.1494137
- Galaso, P. (2018). Network topologies as collective social capital in cities and regions: A critical review of empirical studies. European Planning Studies, 26(3), 571–590. https://doi.org/10.1080/09654313.2017.1406898
- Iansiti, M., & Levien, R. (2004a). Strategy as ecology. Harvard Business Review, 82(3), 68–78.
- Iansiti, M., & Levien, R. (2004b). The keystone advantage: What the new dynamics of business ecosystems mean for strategy, innovation, and sustainability. Harvard Business Press.
- Jeong, H. (2003). Complex scale-free networks. Physica A: Statistical Mechanics and its Applications, 321(1–2), 226–237. https://doi.org/10.1016/S0378-4371(02)01774-0
- Khokhar, D. (2015). Gephi cookbook. Packt.
- Martin, R. (2012). Regional economic resilience, hysteresis and recessionary shocks. Journal of Economic Geography, 12(1), 1–32. https://doi.org/10.1093/jeg/lbr019
- Moore, J. F. (1997). The death of competition: Leadership & strategy in the Age of business ecosystems. Harper Business.
- Nahm, K.-B. (2016). The End of ‘selection and concentration’: Towards a new post-cluster regional industrial policies. Journal of the Economic Geographical Society of Korea, 19(4), 764–781. https://doi.org/10.23841/egsk.2016.19.4.764
- Pisano, G. P., & Shih, W. C. (2012). Producing prosperity: Why America needs a manufacturing renaissance. Harvard Business Review Press.
- Porter, M. E., & Stern, S. (2001). Innovation: Location matters. MIT Sloan Management Review, 15 Jul.
- Rong, K., Lin, Y., Yu, J., Zhang, Y., & Radziwon, A. (2021). Exploring regional innovation ecosystems: An empirical study in China. Industry and Innovation, 28(5), 545–569. https://doi.org/10.1080/13662716.2020.1830042
- Uzzi, B. (1996). The sources and consequences of embeddedness for the economic performance of organizations: The network effect. American Sociological Review, 61(4), 674–698. https://doi.org/10.2307/2096399
- Wasserman, S., & Faust, K. (1994). Social network analysis: Methods and applications. Cambridge University Press.