
 ?Mathematical formulae have been encoded as MathML and are displayed in this HTML version using MathJax in order to improve their display. Uncheck the box to turn MathJax off. This feature requires Javascript. Click on a formula to zoom.
ABSTRACT
Historically, Euro-Mediterranean European countries have presented high levels of intra- and interregional socio-economic inequalities and are regular recipients of financial support under European Union Cohesion Policy. This paper provides evidence of regional convergence in the size of lower- and upper-middle-income classes across regions of France, Greece, Italy and Spain for the period 2004–17. Our results also reveal that changes in class size in neighbouring regions are associated with changes in the same direction in the lower- and upper-middle classes of the region of interest. As regards growth of class size in neighbouring regions, the convergence process is offset in both middle-income groups, but only partially for the upper-middle class. Furthermore, the economic cycle affects the process of regional convergence in the size of the middle class, although the effects are non-homogeneous for both middle-class groups. While increases or decreases in gross domestic product (GDP) do not seem to be closely related to upper-middle-class size, relatively persistent decreases rather than increases in GDP over time tend to be more linked to lower-middle-class size. These findings point to significant differences in the convergence dynamics between lower- and upper-middle classes, with the former being more sensitive to both neighbouring regions and the business cycle.
1. INTRODUCTION
Traditionally, most studies on income inequality have focused on overall distribution and extreme classes and paid less attention to differences and changes in the middle class and its possible squeeze in some countries (Atkinson & Brandolini, Citation2013). Nonetheless, it is widely accepted that the middle class plays a key role in today’s society by sustaining consumption, boosting investment in education and health, supporting social protection systems, and contributing to promoting societies with lower crime rates, greater levels of trust, and higher political stability and good governance (e.g., Cowen, Citation2013; Organisation for Economic Co-operation and Development (OECD), Citation2019; Pew Research Center, Citation2017; Temin, Citation2017; Vaughan-Whitehead, Citation2016).
In Europe, there is evidence that the middle class in most countries experienced rapid growth in the 1980s and 1990s, while the new century seems to have brought a certain erosion of the middle class aggravated by the Great Recession, especially in countries of Southern Europe. Among the explanations for this increase in within-country inequality and the decline of the middle class in recent decades, the literature points to a number of long-term structural drivers, such as the deepening of globalisation, skill-biased technological progress, demographic trends, changes in labour market institutions or the lower redistributive capacity of tax–benefit systems (e.g., OECD, Citation2011, Citation2015; Dabla-Norris et al., Citation2015; Bourguignon, Citation2018). Furthermore, business cycles also play a significant role in the short term (Batinti & Costa-Font, Citation2020; Jäntti & Jenkins, Citation2010; Pérez-Moreno & Bárcena-Martín, Citation2019). In this regard, it is argued that periods of decline tend to be associated with higher income polarisation and a squeeze of middle-classes’ size.
While several studies have addressed the situation of the middle class across European countries, spatial analyses of regional disparities in the size of middle-income groups are lacking. This contrasts with the considerable empirical literature on convergence in average incomes and overall income inequality across regions (e.g., Aghion & Howitt, Citation2019; Barro & Sala-i-Martin, Citation2020), which has shown that average income data and income inequality data tend to spatially converge in the framework of the neoclassical growth model (Solow, Citation1956; Swan, Citation1956).
This paper tries to fill this gap in the literature by examining the spatial dynamics of middle-class size across regions of the four major Mediterranean European countriesFootnote1 (France, Greece, Italy, Spain) between 2004 and 2017 to test for potential spatial links of both lower- and upper-middle classes. These Southern European countries have historically presented high levels of socio-economic inequalities between regions, some of which are regular recipients of financial support under the European Union (EU) Cohesion Policy. Assessing the extent to which lower- and upper-middle-class sizes are spatially correlated and tend to converge spatially might offer valuable insights in terms of economic, social and territorial cohesion policy. Additionally, potential asymmetric impacts on the evolution of middle-class size over the economic cycle are evaluated by distinguishing between expansionary and recessionary periods. This latter point is especially relevant to examine whether the business cycle affects the process of convergence in the size of middle classes and to draw lessons for future economic fluctuations. To this end, we use microdata from Eurostat’s European Union Statistics on Income and Living Conditions (EU-SILC) databases to compute the size and evolution of middle classes in the Euro-Mediterranean countries under study.
The remainder of the paper is structured as follows. Section 2 briefly reviews the literature on income inequality convergence. Section 3 defines the middle-income classes. Sections 4 and 5 describe the data and methodology used, respectively. Section 6 presents and discusses the results. Finally, some concluding remarks are presented in section 7.
2. LITERATURE REVIEW
Within the framework of the neoclassical growth model, we can take as a starting point the convergence hypothesis developed by Solow (Citation1956) and Swan (Citation1956). The hypothesis assumes diminishing returns to factors of production (particularly capital), that is, the lower the starting level of real per capita income, the higher its subsequent rate of growth. Thus, a long-run tendency toward convergence in countries’ per capita income levels is expected. This convergence hypothesis has led to an extensive literature testing convergence in average incomes across both countries and regions, especially following the seminal papers by Baumol (Citation1986), Barro and Sala-i-Martin (Citation1992) and Mankiw et al. (Citation1992) on beta and sigma convergence. Both concepts are important for understanding economic growth and convergence. Let us recall that beta convergence describes the relationship between initial levels of economic variables and their subsequent growth rates, such that poorer economies tend to grow faster than richer ones and eventually catch up. On the other hand, sigma convergence refers to the idea that the dispersion in levels of economic variables across regions or countries tends to decrease over time, so the gap between rich and poor territories will tend to be narrower.
Nevertheless, beyond average incomes, neoclassical growth models might imply convergence in the entire income distribution, as underlined by Benabou (Citation1996). The author enquiries into whether countries tend to converge to the same level of income inequality or if there are permanent differences. He examines if convergence occurs not only in the first moment of countries’ income distributions (gross domestic product (GDP) per capita) but also in the second one (and higher), in line with most versions of the neoclassical model when considering uninsurable idiosyncratic shocks (e.g., Davila et al., Citation2012). On the basis of neoclassical growth models, the dynamics of convergence in income inequality could therefore be regarded as an extension of convergence in average incomes. Thus, it could be argued that, under similar conditions, countries or regions with high income inequality would tend to reduce inequality levels, while inequality would tend to increase when the levels are low. Moreover, from a spatial perspective, we might argue that, in terms of the potential influences on inequality and/or determinants of inequality in neighbouring regions, the overall effect in each region will be the result of the sensitivity of income strata to the socio-economic characteristics of neighbouring regions. Thus, the low part of the income distribution would be expected to behave more similarly across neighbouring regions, as it is more sensitive to processes of job creation and destruction. By contrast, changes in high incomes in a region due to factors such as progressive changes in the sectoral composition of economic activity and regional specialisation, human capital endowment, the intensity of innovation activities or the transfer of certain groups of highly skilled workers from one region to another do not necessarily occur in a similar way in neighbouring regions in the short term (e.g., OECD, Citation2013; Saha et al., Citation2019).
The potential convergence in income inequality has been widely tested in the empirical literature. While a number of studies have investigated inequality convergence across countries (Alvaredo & Gasparini, Citation2015; Benabou, Citation1996; Bleaney & Nishiyama, Citation2003; Chambers & Dhongde, Citation2016; Ravallion, Citation2003), others have addressed income inequality convergence within the same country, especially for the US (Apergis et al., Citation2018; Ezcurra & Pascual, Citation2009; Ho, Citation2015; Lin & Huang, Citation2011, Citation2012a, Citation2012b; Panizza, Citation2001) but also for other countries such as Argentina (Marina, Citation2000), Spain (Goerlich & Mas, Citation2004) and Brazil (Gomes, Citation2007). Most of these studies provide strong evidence of income inequality convergence and relatively robust evidence across different income inequality measures and datasets. However, they mostly disregard the situation of the middle classes.
As regards the EU, most efforts in recent decades have been aimed at studying convergence in income per capita at both national and regional levels under the implicit premise that it is an indicator of both economic performance and social progress (e.g., Alcidi et al., Citation2018a, Citation2018b; Diaz del Hoyo et al., Citation2017). Nevertheless, income distribution convergence across EU regions has been less studied, despite increasing concerns about the high levels of income inequality within European countries. For instance, based on the regional distribution of income (Gini index) in 1993 and 1998, Ezcurra and Pascual (Citation2005) provided descriptive evidence of income distribution convergence for 65 NUTS-1 regions. Subsequent studies, such as Tselios (Citation2009), have empirically tested for income inequality convergence across EU regions. Apart from examining income per capita convergence, he found evidence of unconditional convergence in income inequality (Gini and Theil indices, among other inequality measurements) across 102 NUTS-1 or -2 regions belonging to 13 countries for the period 1995–2000. More recently, Savoia (Citation2019) examined whether there has been convergence in income distribution (Gini index and quintile income shares) among a sample of NUTS-2 regions over the period 1989–2013. The author concluded that EU regions are converging to a higher level of income inequality, thus becoming equally more unequal. From a wider perspective, Cseres-Gergely and Kvedaras (Citation2019) explored changes and convergence in terms of equivalised net income distributions over the period 2007–14 at several aggregation levels of the EU: EU-wide, region-to-EU, country-to-EU, and convergence within and between various geographical EU macro-regions. Although the authors observed a general trend for the EU-wide equivalised net personal income to converge, they found substantial variations over different income quantiles and various geographical entities, thus underlining the need for specific analyses at different parts of the income distribution and geographical areas.
A different strand of the literature deals with the relationship between economic growth and income inequality. Traditionally, the most influential framework used to explain the potential effects of growth on inequality has been Kuznets’ (Citation1955) inverted ‘U’-curve hypothesis, which states that income inequality initially increases for a time as the economy grows and then decreases. Nonetheless, the current empirical evidence on Kuznets’ hypothesis is ambiguous and the current debate on distributional implications of (or the lack of) growth are essentially connected with Piketty’s (Citation2014) thesis. Piketty argues that rising inequality is largely a consequence of declining growth rates, such that slow growth rates tend to increase (or hinder the decrease) of inequality. Nevertheless, some prominent authors, such as Stiglitz (Citation2016), emphasise that growth–inequality links are not automatic and influenced by factors others than business cycles, such as structural socio-economic characteristics, the institutional environment and policies.
In relation to these potential effects of economic growth, some studies have explored the effects of economic fluctuations on the process of economic catching-up across European countries and regions, focusing primarily on the impact of the 2008 financial crisis and recovery aftermaths (e.g., Cabral & Castellanos-Sosa, Citation2019; Stanišić, Citation2012). For instance, Cseres-Gergely and Kvedaras (Citation2019) stressed that the situation for Southern European countries substantially changed after the financial crisis. They argued that part of the general trend for the EU-wide equivalised net personal income to converge was largely driven by a significant reduction in income in Southern Europe after the onset of the Great Recession and disproportionally affected the lower tail of the income distribution through labour market deterioration.
This paper addresses the lack of analyses of regional disparities in the size of middle-income groups from a spatial approach. Specifically, we are interested in examining convergence in the size of lower- and upper-middle-income classes across the NUTS-2 regions of the four major Mediterranean European countries over the period 2004–17 taking into consideration potential differential effects of expansionary and recessionary phases on this catching-up process.
3. DEFINING MIDDLE-INCOME CLASSES
There is no agreement on how to define and measure the middle class. The sociological literature has emphasised the role of occupations in the delimitation of social classes, while economists use one-dimensional indicators based on income thresholds, which make it easier to define the class structure. However, there is no agreement as to these thresholds and both absolute and relative thresholds have been proposed. The absolute income threshold approach defines the middle class as households with income or consumption in a specific range of US dollars in purchasing power parity (PPP). This is the case of Ravallion (Citation2010), who establishes US$2–13 of income per day, or López-Calva and Ortiz-Juarez (Citation2014), who propose US$10–50 of income per day.
The relative approach proposes alternative definitions. The first is based on the percentiles of the income distribution where the middle class is composed of individuals between the second and eighth deciles (Levy, Citation1987), the three middle quintiles (Barro, Citation2000; Easterly, Citation2001; Piketty, Citation2014), or from the third to the ninth decile (Solimano, Citation2008). In this case, the population share of each class is fixed, and the evolution of the income share of each class is the main concern. The second relative definition calculates the percentage of the population that is in the middle class by setting criteria based on percentages of the median income distribution. This definition is justified by the increasing awareness that average income measured in national accounts may fail to capture the living standards of the ‘typical’ household and the median household income is therefore used as a key indicator of how ordinary living standards are evolving (Aaberge & Atkinson, Citation2013; Atkinson & Brandolini, Citation2013; Boarini et al., Citation2015). We use this relative characterisation in our investigation.
Several definitions have been proposed in the literature. Blackburn and Bloom (Citation1985) suggested upper bounds of 60–225%, Thurow (Citation1987) between 75% and 125% of the median income, and Davis and Huston (Citation1992) between 50% and 150%. The definition that uses the upper and lower bounds of 75% and 125% of the median appears to be the most widely used. More recently, authors such as Atkinson and Brandolini (Citation2013) proposed a broader definition and argued that the middle class consists of households with an equivalent income between 75% and 200% of the median. The group classified as middle income is, however, overly aggregated as a result of these thresholds. For this reason, we divide the middle class into two groups using the boundaries of 75% and 125% of the median as the demarcation criterion for the lower-middle class and 125–200% of the median for the upper-middle class following Ayala and Cantó (Citation2018).
As Birdsall et al. (Citation2000) have shown, one of the advantages of using percentages of median income is that they allow comparing the class sizes between countries or within the same country at various points in time. This approach also avoids the problem of definitions based on occupational categories, which economic dynamics can make obsolete very quickly.
4. DATA
We use data on income distribution from the EU-SILC to define the proportion of the population that belongs to the middle class. This dataset contains timely and comparable cross-sectional and longitudinal multidimensional micro-data on income, poverty, social exclusion and living conditions. Our analysis pools regional data from waves 2004–17 for four Mediterranean European countries, namely, France, Greece, Italy and Spain, all of which are major recipients of financial support under EU Cohesion Policy. The regions are shown in Table A1 in the supplemental data online.
Total disposable household income is used to compute the limit of the income classes. It includes all income from work (employees’ salaries and self-employed workers’ income), income from capital and property, transfers between households, and income from private pension plans and social transfers minus taxes for all household members. The variable income refers to the previous calendar year. Although the household is the unit of measurement in the EU-SILC database, we use the income distribution of individuals as the unit of analysis whenever we try to examine individuals’ economic position. We adjust household income (aggregate income of all household members) according to household size using the OECD equivalence scale. Equivalence scales account for the fact that a household’s needs increase with each additional member but not proportionally due to economies of scale in spending. The OECD equivalence scale allocates a value to each household type in the population based on the household’s needs as follows: a value of 1 to the household head, 0.5 to each additional adult member and 0.3 to each member younger than 14 years. After dividing household income by the equivalence scale, we attach the equivalent household income to each member of the household.
We measure middle-class size as the proportion of individualsFootnote2 with income within the regional thresholds: 75% and 125% of the median income of the corresponding region for the lower-middle class, and 125% and 200% of the median income of the corresponding region for the upper-middle class. Data on the average size of the middle class for 2004–17 are reported in Table A2 in the supplemental data online.
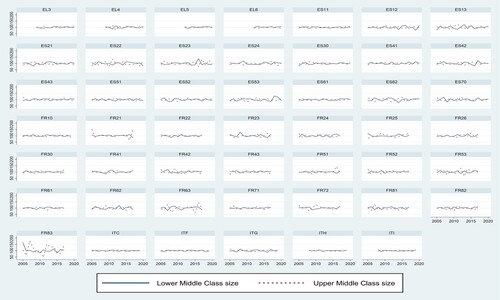
The class structure by regions for the last year analysed shows that the size of lower- and upper-middle classes in 2017 is 41% and 24% on average, respectively. The evolution of the lower- and upper-middle-class size by region is shown in , where the class size for 2004 is set to 100.
Figure 1. Annual changes in lower- and upper- middle-class size. Source: EU-SILC (2004–17) and authors’ own elaboration.
In the analysis of conditional regional convergence in the size of the upper- and lower-middle class, we control by the annual cumulative variation rate of regional GDP, differentiating between increases (positive GDP growth rate) and decreases (negative GDP growth rate) in the regional GDP. Information on the GDP of each region (millions US$, constant prices, constant PPP, base year 2015) comes from OECD statistics (OECD, Citation2021).
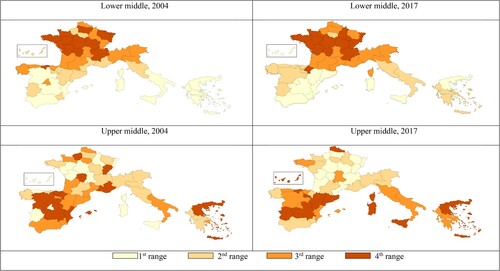
Quartile maps are used for a first approximation of the impact of the spatial component on the regional distribution of class size. As can be seen in , the spatial component seems to have a considerable impact on the size of the population classes according to their lower- and upper-middle income level. First, as regards the lower-middle-income class, we note that the regions in the upper two quartiles in 2004 were French regions, northern Italy, as well as the Cantabrian coast and Madrid in Spain, while in 2017 the Spanish regions except Navarra disappeared from the map. In any case, the presence of Southern regions is more prominent in the first and second quartiles and even within the same country, as is the case of Italy and Spain since regions that are further south belong to a lower quartile. The evolution of the quartile in the study period maps allows us to verify the definition of regional groups with territorial contiguity belonging to the same quartiles, which suggest the strengthening of the spatial autocorrelation throughout the period analysed. By contrast, the situation of the upper-middle-income class is generally the inverse of the lower-middle-income class since the southernmost regions (mainly of Spain) are in the upper quartiles.
Figure 2. Quartile map of lower- and upper-middle-income class size, 2004 and 2017.
5. METHODOLOGY
We start with a classic unconditional convergence model (Sala-i-Martin, Citation1996) in which income per capita has been replaced by regional middle-income class size (MIS). When this model is estimated using linear regression, it can be described as follows by the usual expression:
(1)
(1) where the dependent variable represents the change in MIS measured through the annual cumulative growth rate for each region. Note that we analyse growth in the income class size, which is a proportion, as we are interested in the relative size of the middle class as a proxy of relative inequality (as, for example, the Gini index). Changes in the absolute number of people in the middle class are not related to inequality, since the number of people might increase or decrease and the relative size might not change if the population changes at the same rate. On the right-hand side of equation (1),
is the coefficient to be estimated and
represents the error term. However, in order to select the best specification, we have modified equation (1) to take into account the following considerations: (i) a panel data model is used due to the availability of datasets, thus offering extended modelling possibilities; (ii) the spatial nature of the income distribution (as will be demonstrated below by the Moran index) suggests accommodating spatial heterogeneity and dependence in the model; and (iii) the extension of the unconditional convergence model to another conditional one in order to analyse the impact of other variables (X) related to the economic cycle together with the initial value of MIS.
Once the above considerations are taken into account, equation (1) becomes a general nesting spatial model, namely the second generation (Elhorst, Citation2021). This model comprises non-dynamic models based on spatial panel data and controls for fixed or random spatial and/or time period-specific effects. Different spatial econometric models can be specified from this model depending on the combinations of spatial interaction effects and their flexibility in terms of spatial spillovers. The specification of this model for panel data (Elhorst, Citation2014b) after its adaptation to our case study would be the following:
(2)
(2) where:
denotes the annual accumulative growth rate of MIS as a vector of dependent variable observations for every unit and time;
is a matrix describing the arrangement of the regions in the sample;
is the endogenous interaction effect of the change in MIS;
is the initial value of MIS;
is a matrix of n additional independent variables at the initial time;
and
are the exogenous interaction effects of the initial values of MIS and n additional independent variables, respectively, for region i on the dependent variable for other regions;
and
are, respectively, the vector of time period or spatial, fixed or random effects;
is the spatial autoregressive coefficient;
,
,
and
are the parameters to be estimated where the first two are for exogenous explanatory variables and the last two for exogenous interaction effects; and
,
and
are, respectively, the parameter for the spatial correlation effect of errors, the interaction effects among error terms of the different regional units and the vectors of the disturbance terms.
Six main types of models can be deduced from this model depending on the constraint used (LeSage, Citation2008): the spatial Durbin model (SDM; λ = 0); the spatial Durbin error model (SDEM; δ = 0); the spatial autoregressive combined model (SAC; θ = 0); the spatial autoregressive model (SAR; θ= 0 and λ = 0); the spatial error model (SEM; δ = 0 and θ = 0); or the spatial lag of X model (SLX; λ = 0 and δ = 0). To select the model that best fits the regional income distribution, a Bayesian comparison approach is used (LeSage, Citation2015) both for different weight matrices given a model and for different model specifications given a matrix.
The estimation problem of endogeneity caused by introducing a spatial lagged dependent variable has been extensively discussed in panel data literature (e.g., Elhorst, Citation2005). The traditional ordinary least squares (OLS) estimator does not provide consistent estimates (except in specific circumstances) of the speed of convergence or the rest of the model coefficients. To overcome this inconsistency, Lee and Yu (Citation2010) and Elhorst (Citation2010) propose a simple bias-correction procedure based on the parameter estimates of the uncorrected approach. Specifically, Elhorst (Citation2010) uses the maximum likelihood estimator of the spatial lag model and of the error model including fixed or random effects. In this study, we specifically use the Matlab routines provided by Elhorst (Citation2014a) updated for the bias correction procedure for both models and the fixed and random effects.
In exploratory spatial data analysis, it is necessary to determine the spatial weight matrix that best reflects spatial interactions in the territorial units before modelling interactions between the regions in the dataset. Spatial weight matrices normally used in econometric analysis are based on a theory of distance, such as (1) the k-nearest neighbours computed from the geographical coordinates of the regional reference points (Le Gallo & Ertur, Citation2003); and (2) the threshold distance (minimum, intermediate and maximum) to define the connected site pairs.
These matrices are tested for the Southern European regions according to the assessment of the best performance of the estimated model. Elhorst (Citation2014b) suggests that the best description among the spatial weight matrices requires the highest log-likelihood function value and the lowest parameter estimate of the residual variance. For this, we explore the sensitivity of these parameters by substituting the spatial weight matrix in the estimation of an SDM. This procedure (Gibbons & Overman, Citation2012) is applied for 10 possible combinations of two classes (lower- and upper-middle classes) and five time delays (from 1 to 5, that is, the growth in class size depends on the initial situation of the class, which goes from the previous year to the previous five years). Subsequently, we compare the results according to the criteria mentioned above.
As regards the dependent variable, an analysis of the annual cumulative growth rate for different periods (from one to five years) indicates that better results are obtained when a four-year period is considered. Hence, the estimation considers the relationship between the initial value of class size (or other explanatory variables) and the growth in the following four years. According to this model, the most efficient spatial weighting matrix for the lower-middle class is four nearest neighbours, while for the upper-middle-income class it is six nearest neighbours. shows the absence of spatial autocorrelation for the upper-middle class at the beginning of the study period and the strong growth in the spatial autocorrelation exhibited by all income classes. However, the selection of the spatial weighting matrix cannot be guided only by Moran’s indices and it is also necessary to take into account the efficiency of the model in which it is to be implemented.
Table 1. Moran’s index test for income classes by population, 2004–17.
6. MODEL SELECTION AND EMPIRICAL RESULTS
Our aim is to test the existence of convergence in the middle-income classes (in their different breakdowns) and the potential asymmetric impact of the business cycle on convergence. To this end, the main variables we consider are the size of both the lower- and upper-middle-income classes as well as the evolution of GDP. We perform a spatial exploratory analysis where the evolution of each class size from one- to five-year periods is a dependent variable and the independent variables are the initial value of the class size and those which best reflect the impact of the economic cycle on the dependent variable. In our case, the cumulative annual average variation rates in regional GDP from one- to five-year periods are considered. Regarding the definition of the model, we consider both variables as independent, therefore a classic model of conditional beta-convergence model is estimated.
We propose the conditional beta-convergence model to analyse if the economic cycle could contribute to explaining the evolution of class sizes. The same process used to previously select the weighting matrices for the lower- and upper-middle-income classes can also be used to select the model with the best fit. After analysing the SAR, SEM, SDM and SDEM, the third model with random effects is selected for the lower- and upper-middle classes.
The SDM, which includes spatial delay in both the dependent and independent variables, indicates that the value of the dependent variable in neighbouring regions has a significant impact on the dependent variable for a given region. To test for possible asymmetric effects of the economic cycles on the evolution of the size of the middle-income classes, we compute the cumulative annual average variation rates of regional GDP with different time delays (from a one- to five-year periods). We differentiate periods of economic expansion and contraction by splitting the changes in GDP into two variables: one that identifies periods of GDP growth () and another for GDP decline (
), so that each variable takes the data with these signs and leaves the rest with a zero value. As with the dependent variable, we choose the four-year cumulative annual average variation rate of regional GDP (in periods t to t – 4) as additional independent variables. By doing so, the variation of, for example, the lower-middle-income class from 2004 to 2008 would be explained by the initial situation of this class in 2004, as well as by the cumulative annual variation rate of GDP between 2004 and 2008. Thus, the model to be estimated for both income classes is as follows:
(3)
(3) where
and
are the cumulative annual average variation rates in regional GDP in a four-year period, when positive and negative, respectively; and
and
are the exogenous interaction effects of the positive and negative, respectively, variation rates in GDP for region i on the dependent variable for other regions.
The coefficients for the decrease or increase (negative and positive variation rate) in GDP are not significant for both income classes (), thus suggesting that relatively persistent falls or growth in GDP over time in a region are not associated with a variation in the region’s class size. The same applies to the spatial interaction effect for the positive variation rates of GDP for neighbouring regions. This suggests that the evolution of these class sizes for a given region is not conditioned by GDP growth in the region or in neighbouring regions. Conversely, the decline in GDP for the lower-middle-class size in neighbouring regions is positive and significant at 1%. This suggests that when the GDP of neighbouring regions declines, the lower-middle-class size for a given region also tends to decrease. This indicates that the evolution in lower-middle-class size is more conditioned by the recessive economic situation in neighbouring regions than by that of the region itself.
Table 2. Conditional convergence model estimation (SDM): decomposition of gross domestic product (GDP) growth rate.
The results confirm the convergence process in the size of lower- and upper-middle classes and provide evidence of the asymmetric effects of economic cycles for the lower-middle class. While the size of the upper-middle class does not seem to be associated with economic cycles, the size of the lower-middle class decreases in times of recession but is not affected in expansionary periods. This finding is consistent with the fact that the size of the lower-middle class is more sensitive to labour market performance over the business cycle. That is, rather than benefiting from economic growth, the lower-middle class tends to shrink in periods of economic decline, thus corroborating the lower resilience of this income group to economic downturns.
shows the estimated coefficients for the independent variables (initial class size, GDP growth rate and GDP decrease rate). In all cases, the values of the variables indicate the relationship between each independent variable and the dependent variable from a global point of view and without considering spatial feedback across regions. However, none of the coefficients of the independent variables (spatially lagged or not) includes the feedback effect. This is because a change in an explanatory variable in region i may be associated with a change in the dependent variable in that region and in its neighbours, and this change in the neighbouring regions is also related to variations in region i. For this reason, it is necessary to explicitly incorporate the spatial dependence between the neighbouring regions and the dependent variable by adding four spatially lagged dependent variables: one for the dependent variable and three for each of the independent variables.
To examine the relationship between the independent variables and the dependent variable considering all the feedback effects generated by the spatial delays, the usual analysis framework in the literature is used to estimate (1) direct effects, which summarise the association of changes in each independent variable in a region with the middle-income class size growth of the same region; (2) indirect effects, to test the hypothesis whether spatial spillovers are related to the dependent variable of other regions; and (3) the sum of the direct and indirect effects, which reflects the overall relationship between an explanatory variable and the dependent variable. displays the relationship between changes in the initial class size and changes in middle-class size (the so-called direct, indirect and total effects).
Table 3. Conditional convergence. Estimation of direct and indirect effects.
As can be seen, the direct and indirect effects of the initial size of the classes are significant at 1% in all cases. The indirect effects contribute to significantly compensating (especially in the case of the lower-middle class) the convergence process due to the direct effects of the convergence process. This would result in the existence of a regional convergence process in the middle-income classes modulated by the presence of decreasing returns of scale.
The direct effects of GDP variation rates on the lower- and upper-middle classes are not significant, while the indirect effects for the negative GDP growth rate are significant at the 1% level only for the lower-middle class, making the total effects significant. This suggests that the size of the lower-middle class tends to decrease in recessive phases. Furthermore, it should be noted that the total effect for the positive GDP growth rate is significant at the 1% level also for the lower-middle class, although with negative sign in this case. Likewise, a reduction is observed in the lower-middle class in both recession and recovery periods, so a loss of lower-class size and increased income polarisation could be expected.
Finally, to examine the sensitivity of our findings to the definition of middle-class income, we perform additional tests and analyses in the Robustness section of the Appendix in the supplemental data online. The tests confirm that when different income thresholds are used to define middle class, the conclusions remain the same in the sense that the links are asymmetric over the business cycle and non-homogeneous for the entire middle class.
7. CONCLUSIONS
Although EU Cohesion Policy seems to have achieved convergence in regional income per capita over the last decades, it is less clear whether the process of European integration has involved convergence in middle-income class sizes. This study addresses regional convergence in the size of middle-income classes across 48 NUTS-2 regions belonging to France, Greece, Italy and Spain, all of which are major recipient countries under EU Cohesion Policy for the period 2004–17. We find a conditional beta-convergence process in lower- and upper-middle-income classes, such that the size of the middle class tends to increase less (or decrease more) in regions with initially larger middle classes than in others with initially smaller ones. This is consistent with the rationality of neoclassical growth models, according to which convergence is expected in both level of income per capita and in the entire income distribution, assuming that the regions’ major structural characteristics are similar.
Our models also reveal a significant relationship between changes in class size in neighbouring regions and the evolution of lower- and upper-middle classes in a specific region. In particular, the effects of class size growth in neighbouring regions contribute to offsetting the convergence process in both classes, fully for the lower-middle class and partially for the upper-middle class. However, the main difference in the effects for the two class sizes is that the value for the upper-middle-class size is higher than the value for the lower-middle-class size, in the same line as the spatial autoregressive component. This points to differences in the underlying drivers of both middle-class groups. As discussed in the literature review, regional changes in the size of the lower-middle class are usually more related to job creation and destruction processes and the redistributive role of the state. In contrast, the size of the upper-middle class may be associated with the specific productive structure and competitiveness level of each region, thus leading to more heterogeneous behaviours between neighbouring regions.
Regarding potential impacts of economic cycles on the convergence process, our study reveals considerable asymmetry between lower- and upper-middle-class size. Although variations in GDP seem to be linked to reductions in lower-middle-class size in both expansionary and recessionary periods, relatively persistent decreases in GDP over time (four years) are more strongly associated with the size of this class than with increases in GDP. In contrast, for the upper-middle-class size, increases or decreases in GDP do not seem to be significantly related to class size.
In sum, we can conclude that the convergence in class size is modulated by the neighbouring region and the business cycle in such a way that convergence of lower-middle-income classes tends to be compensated by the opposite effect of neighbouring regions. Moreover, both periods of declines and increases in GDP are associated with reductions in the size of the lower-income class. On the other hand, convergence of upper-middle-income classes is reduced (but not offset) by their relationship with neighbouring regions. In this case, changes in GDP are not associated with the evolution in the size of the upper income class. This indicates that economic fluctuations not only produce an asymmetric effect but also non-homogeneous effects on lower- and upper-middle classes. Further research would be required to extend our empirical evidence to other contexts and circumstances.
Supplemental Material
Download PDF (195.6 KB)ACKNOWLEDGEMENTS
The authors gratefully acknowledge the financial support provided by the University of Malaga and the University of Granada, as well as the Regional Government of Andalusia [UMA18-FEDERJA-005] and the Spanish Ministry of Science and Innovation [AEI/10.13039/501100011033].
DISCLOSURE STATEMENT
No potential conflict of interest was reported by the authors.
DATA AVAILABILITY
This paper used European Union Statistics on Income and Living Conditions (EU-SILC) data, which are public and can be freely accessed by contacting EUROSTAT. However, the authors cannot provide it due to the privacy clause signed in the contract with EUROSTAT.
Notes
1 We have not included other countries with spatial relationships due to lack of data availability, as some of the countries’ regions have missing data for some years of the period analysed or their administrative boundaries have been modified.
2 We estimate class size using the EU-SILC sample weights. These weights may be thought of as measurements of how many people the given sample observation represents in the reference population.
REFERENCES
- Aaberge, R., & Atkinson, A. B. (2013). The median as watershed, Statistics Norway Discussion papers no. 749, Statistics Norway.
- Aghion, P., & Howitt, P. (2019). The economics of growth. MIT Press.
- Alcidi, C., Nuñez-Ferrer, J. N., Di Salvo, M., Musmeci, R., & Pilati, M. (2018a). Income convergence in the EU: A tale of two speeds. CEPS Commentary, 9 January 2018.
- Alcidi, C., Nuñez-Ferrer, J. N., Musmeci, R., Di Salvo, M., & Pilati, M. (2018b). Income convergence in the EU: Within-country regional patterns. CEPS Commentary, 5 February 2018.
- Alvaredo, F., & Gasparini, L. (2015). Recent trends in inequality and poverty in developing countries. In A. B. Atkinson & F. Bourguignon (Eds.), Handbook of income distribution (Vol. 2, pp. 697–805). Elsevier.
- Apergis, N., Christou, C., Gupta, R., & Miller, S. M. (2018). Convergence in income inequality: Further evidence from the club clustering methodology across states in the U.S. International Advances in Economic Research, 24(2), 147–161. https://doi.org/10.1007/s11294-018-9675-y
- Atkinson, A. B., & Brandolini, A. (2013). On the identification of the middle class. In J. C. Gornick, & M. Jäntti (Eds.), Income inequality: Economic disparities and the middle class in affluent countries (pp. 77–100). Stanford University Press.
- Ayala, L., & Cantó, O. (2018). The driving forces of rising inequality in Spain: Is there more to it than a deep worsening of low income households living standards? In B. Nolan (Ed.), Inequality and inclusive growth in rich countries: Shared challenges and contrasting fortunes (ch. 10). Oxford University Press.
- Barro, R. (2000). Inequality and growth in a panel of countries. Journal of Economic Growth, 5(1), 5–32. https://doi.org/10.1023/A:1009850119329
- Barro, R. J., & Sala-i-Martin, X. (1992). Convergence. Journal of Political Economy, 100(2), 223–251. https://doi.org/10.1086/261816
- Barro, R. J., & Sala-i-Martin, X. (2020). Economic growth. MIT Press.
- Batinti, A., & Costa-Font, J. (2020). Do economic recessions squeeze the middle class? Economics and Politics, 32(3), 335–355. https://doi.org/10.1111/ecpo.12145
- Baumol, W. J. (1986). Productivity growth, convergence, and welfare: What the long-run data show. American Economic Review, 76(5), 1072–1085. http://www.jstor.org/stable/1816469
- Benabou, R. (1996). Inequality and growth. In B. Bemanke, & J. Rotemberg (Eds.), National bureau of economic research macroeconomics annual (pp. 11–74). MIT Press.
- Birdsall, N., Graham, C., & Pettinato, S. (2000). Stuck in the tunnel: Is globalization muddling the middle class? Center on social and economic dynamics working paper no. 14.
- Blackburn, M., & Bloom, D. (1985). What is happening to the Middle Class?. American Demographics, 7(1), 18–25.
- Bleaney, M., & Nishiyama, A. (2003). Convergence in income inequality: Differences between advanced and developing countries. Economics Bulletin, 4(22), 1–10. http://www.accessecon.com/pubs/EB/2003/Volume4/EB-03D30002A.pdf.
- Boarini, R., Murtin, F., & Schreyer, P. (2015). Inclusive growth: The OECD measurement framework, OECD statistics working papers, 2015/06. Organisation for Economic Co-operation and Development (OECD).
- Bourguignon, F. (2018). World changes in inequality: An overview of facts, causes, consequences and policies. CESifo Economic Studies, 64(3), 345–370. https://doi.org/10.1093/cesifo/ifx028
- Cabral, R., & Castellanos-Sosa, F. A. (2019). Europe’s income convergence and the latest global financial crisis. Research in Economics, 23–34. https://doi.org/10.1016/j.rie.2019.01.003
- Chambers, D., & Dhongde, S. (2016b). Convergence in income distributions: Evidence from a panel of countries. Economic Modelling, 59, 262–270. https://doi.org/10.1016/j.econmod.2016.07.019
- Cowen, T. (2013). Average is over: Powering America beyond the Age of the Great Stagnation. Penguin.
- Cseres-Gergely, Z., & Kvedaras, V. (2019). Change and convergence of income distributions in the European Union during 2007–2014, JRC Working Papers in Economics and Finance, 2019/13. Publications Office of the European Union, Luxembourg, 2019. https://doi.org/10.2760/217338,JRC117006
- Dabla-Norris, E., Kochhar, K., Suphaphiphat, N., Ricka, F., & Tsounta, E. (2015). Causes and consequences of income inequality: A global perspective. International Monetary Fund SDN/15/13. https://doi.org/10.5089/9781513555188.006
- Davila, J., Krusell, J. H., & Ríos-Rull, J. V. (2012). Constrained efficiency in the neoclassical growth model with uninsurable idiosyncratic shocks. Econometrica, 80(6), 2431–2467. https://doi.org/10.3982/ECTA5989
- Davis, J. C., & Huston, J. H. (1992). The shrinking middle-income class: A multivariate analysis. Eastern Economic Journal, 18, 277–285. http://www.jstor.org/stable/40325452
- Diaz del Hoyo, J. L., Dorrucci, E., Heinz, F. F., & Muzikarova, S. (2017). Real convergence in the euro area: A long-term perspective, ECB Occasional Paper Series No. 203.
- Easterly, W. (2001). The middle-class consensus and economic development. Journal of Economic Growth, 6(4), 317–335. https://doi.org/10.1023/A:1012786330095
- Elhorst, J. P. (2005). Unconditional maximum likelihood estimation of linear and log-linear dynamic models for spatial panels. Geographical Analysis, 37(1), 85–106. https://doi.org/10.1111/j.1538-4632.2005.00577.x
- Elhorst, J. P. (2010). Spatial panel data models. In M. M. Fischer, & A. Getis (Eds.), Handbook of applied spatial analysis (pp. 377–407). Springer.
- Elhorst, J. P. (2014a). Matlab software for spatial panels. International Regional Science Review, 37(3), 389–405. https://doi.org/10.1177/0160017612452429
- Elhorst, J. P. (2014b). Spatial econometrics: From cross-sectional data to spatial panels. Springer Heidelberg.
- Elhorst, J. P. (2021). The dynamic general nesting spatial econometric model for spatial panels with common factors: Further raising the bar. Review of Regional Research, https://doi.org/10.1007/s10037-021-00163-w
- Ezcurra, R., & Pascual, P. (2005). Is there convergence in income inequality levels among the European regions? Applied Economics Letters, 12(12), 763–767. https://doi.org/10.1080/13504850500245669
- Ezcurra, R., & Pascual, P. (2009). Convergence in income inequality in the United States: A nonparametric analysis. Applied Economic Letters, 16(13), 1365–1368. https://doi.org/10.1080/13504850701439319
- Gibbons, S., & Overman, H. G. (2012). Mostly pointless spatial econometrics? Journal of Regional Science, 52(2), 172–191. https://doi.org/10.1111/j.1467-9787.2012.00760.x
- Goerlich, F., & Mas, M. (2004). Three (marginal?) questions regarding convergence. Journal of Economic Studies, 31(1), 25–38. https://doi.org/10.1108/01443580410516242
- Gomes, F. A. R. (2007). Convergence in income inequality the case of Brazilian municipalities. Economics Bulletin, 15(15), 1–9. http://accessecon.com/pubs/EB/2007/Volume15/EB-07O00004A.pdf
- Ho, T. (2015). Income inequality may not converge after all: Testing panel unit roots in the presence of cross-section cointegration. The Quarterly Review of Economics and Finance, 56, 68–79. https://doi.org/10.1016/j.qref.2014.10.005
- Jäntti, M., & Jenkins, S. P. (2010). The impact of macroeconomic conditions on income inequality. Journal of Economic Inequality, 8(2), 221–240. https://doi.org/10.1007/s10888-009-9113-8
- Kuznets, S. (1955). Economic growth and income inequality. The American Economic Review, 45, 1–28. https://doi.org/10.4324/9780429311208-4
- Lee, L. F., & Yu, J. (2010). Estimation of spatial autoregressive panel data models with fixed effects. Journal of Econometrics, 154(2), 165–185. https://doi.org/10.1016/j.jeconom.2009.08.001
- Le Gallo, J., & Ertur, C. (2003). Exploratory spatial data analysis of the distribution of regional per capita GDP in Europe, 1980−1995. Papers in Regional Science, 82(2), 175–201. https://doi.org/10.1007/s101100300145
- LeSage, J. P. (2008). An introduction to spatial econometrics. Revue d'Économie Industrielle, 123(123), 19–44. https://doi.org/10.4000/rei.3887
- LeSage, J. P. (2015). Software for Bayesian cross section and panel spatial model comparison. Journal of Geographical Systems, 17(4), 297–310. https://doi.org/10.1007/s10109-015-0217-3
- Levy, F. (1987). The middle class: Is it really vanishing? The Brookings Review, 5(3), 17–21. https://doi.org/10.2307/20079981
- Lin, P. C., & Huang, H. C. (2011). Inequality convergence in a panel of states. Journal of Economic Inequality, 9(2), 195–206. https://doi.org/10.1007/s10888-010-9141-4
- Lin, P. C., & Huang, H. C. (2012a). Convergence of income inequality? Evidence from panel unit root tests with structural breaks. Empirical Economics, 43(1), 153–174. https://doi.org/10.1007/s00181-011-0482-z
- Lin, P. C., & Huang, H. C. (2012b). Inequality convergence revisited: Evidence from stationarity panel tests with breaks and cross correlation. Economic Modelling, 29(2), 316–325. https://doi.org/10.1016/j.econmod.2011.10.009
- López-Calva, L. F., & Ortiz-Juarez, E. (2014). A vulnerability approach to the definition of the middle class. Journal of Economic Inequality, 12(1), 23–47. https://doi.org/10.1007/s10888-012-9240-5
- Mankiw, N. G., David, H. R., & David, N. W. (1992). A contribution to the empirics of economic growth. Quarterly Journal of Economics, 107(2), 407–437. https://doi.org/10.2307/2118477
- Marina, A. (2000). Economic convergence of the first and second moment in the provinces of Argentina. Estudios de Economía, 27(2), 259–277. https://www.redalyc.org/pdf/221/22127205.pdf.
- Organisation for Economic Co-operation and Development (OECD). (2011). Divided we stand: Why inequality keeps rising. OECD Publ.
- Organisation for Economic Co-operation and Development (OECD). (2013). Innovation-driven growth in regions: The role of smart specialisation. OECD Publ.
- Organisation for Economic Co-operation and Development (OECD). (2015). In it together: Why less inequality benefits all. OECD Publ.
- Organisation for Economic Co-operation and Development (OECD). (2019). Under pressure: The squeezed middle class. OECD Publ.
- Organisation for Economic Co-operation and Development (OECD). (2021). OECD Statistics. Retrieved September, 2021, from https://stats.oecd.org/.
- Panizza, U. (2001). Convergence in income inequality. Journal of Income Distribution, 10(1–2), 5–12. https://doi.org/10.25071/1874-6322.1276
- Pérez-Moreno, S., & Bárcena-Martín, E. (2019). Secular stagnation and income class structure in Europe: Policy and institutional implications. In P. Arestis, & M. Sawyer (Eds.), Frontiers of heterodox macroeconomics. International papers in political economy (pp. 323–370). Palgrave Macmillan (Springer Nature).
- Pew Research Center. (2017). Middle class fortunes in Western Europe.
- Piketty, T. (2014). Capital in the twenty-first century. Harvard University Press.
- Ravallion, M. (2003). Inequality convergence. Economics Letters, 80(3), 351–356. https://doi.org/10.1016/S0165-1765(03)00141-1
- Ravallion, M. (2010). The developing world’s bulging (but vulnerable) middle class. World Development, 38(4), 445–454. https://doi.org/10.1016/j.worlddev.2009.11.007
- Saha, N., Saha, T., & Saha, P. (2019). Smart specialization strategy: Does it really foster regional competitiveness? Smart specialization and regional competitiveness. In N. Caseiro, & D. Santos (Eds.), Smart specialization strategies and the role of entrepreneurial universities (pp. 100–130). IGI Global.
- Sala-i-Martin, X. (1996). The classical approach to convergence analysis. The Economic Journal, 106(437), 1019–1036. https://doi.org/10.2307/2235375
- Savoia, F. (2019). Income inequality convergence across EU regions, LIS Working Paper Series, No. 760, Luxembourg Income Study (LIS): Luxembourg.
- Solimano, A. (2008). The middle class and the development process. Serie Macroeconomía del Desarrollo, 65, Comisión Económica para América Latina y el Caribe. Chile.
- Solow, R. M. (1956). A contribution to the theory of economic growth. The Quarterly Journal of Economics, 70(1), 65–94. https://doi.org/10.2307/1884513
- Stanišić, N. (2012). The effects of the economic crisis on income convergence in the European Union. Acta Oeconomica, 62(2), 161–182. www.jstor.org/stable/23526150
- Stiglitz, J. E. (2016). Inequality and economic growth. In M. Jacobs, & M. Mazzucato (Eds.), Rethinking capitalism: Economics and policy for sustainable and inclusive growth (pp. 134–155). Wiley-Blackwell.
- Swan, T. W. (1956). Economic growth and capital accumulation. Economic Record, 32(2), 334–361. https://doi.org/10.1111/j.1475-4932.1956.tb00434.x
- Temin, P. (2017). The vanishing middle class: Prejudice and power in a dual economy. MIT Press.
- Thurow, L. (1987). A surge in inequality. Scientific American, 256(5), 30–37. https://doi.org/10.1038/scientificamerican0587-30
- Tselios, V. (2009). Growth and convergence in income per capita and income inequality in the regions of the EU. Spatial Economic Analysis, 4(3), 343–370. https://doi.org/10.1080/17421770903114711
- Vaughan-Whitehead, D. (2016). Europe’s disappearing middle class? Evidence from the world of work. Edward Elgar/International Labour Organization (ILO).