
 ?Mathematical formulae have been encoded as MathML and are displayed in this HTML version using MathJax in order to improve their display. Uncheck the box to turn MathJax off. This feature requires Javascript. Click on a formula to zoom.
ABSTRACT
This paper analyses the geographical variations in income level and income inequality in Greece over a long time period allowing comparisons between pre- and during the economic and fiscal crisis periods. The analysis is based on a novel database that includes individual micro-data of declared and taxable income aggregated at municipal level over the period 2002–14. Results indicate that economic crisis and fiscal reforms changed substantially both inter- and intra-municipal/interpersonal income inequalities. The geographies of income inequality are subject to the period of analysis, type of municipality and level of income. The geographies of inequality question the fairness and inclusiveness of the implemented reforms during the recession.
1. INTRODUCTION
Income inequality has risen to historically high levels. Robert Shiller, recipient of the Nobel Memorial Prize in Economics in 2013, declared that the most important problem we are facing today is rising inequality. This observation, along with the empirical evidence that inequality matters for the economic performance of nations and for the well-being and prosperity of citizens and territories, has placed the issue at the core of scientific investigation (Atkinson et al., Citation2011; Atkinson & Piketty, Citation2010; Bourguignon, Citation2015; Dorling, Citation2015; Piketty & Saez, Citation2003).
Although income inequality has been a longstanding issue in economics (Kuznets, Citation1955), this renewed attention is arguably, at least in large part, attributable to the work of Atkinson (Citation1997). Subsequently, the works of Piketty (Citation2014) gave further impetus and triggered a voluminous number of publications providing insights from different countries across the globe. Cavanaugh and Breau (Citation2018) show that the rate of increase in papers on inequality was more than twice as fast as and greater than several other major research themes in the social sciences.
International organisations are aware of the importance of this issue. Income inequality in Organisation for Economic Co-operation and Development (OECD) countries is at its highest level of the past half century; the average income of the richest 10% of the population is about nine times that of the poorest 10% compared with seven times 25 years ago (OECD, Citation2019). Furthermore, the economic crisis has intensified income inequality as income is significantly more unequally distributed today than it was before the economic crisis (OECD, Citation2014). Reducing inequalities and eliminating poverty are among the policy priorities of the 2030 Agenda for Sustainable Development (United Nations, Citation2015). Inclusive and sustainable development constitute strategic priorities of the European Union (EU) Cohesion Policy (European Commission, Citation2014, Citation2022). The International Monetary Fund (IMF) reports claims that widening income inequality has been regarded as the defining challenge of our time (Dabla-Norris et al., Citation2015; IMF, Citation2015).
Given the intensity and the consequences of income inequality for economic development and social well-being, tackling income inequality has been placed at the forefront of academic discussions and policy practices.
However, while income inequality reflects the prosperity and welfare conditions that prevail in an economy over a certain period of time, the geography of income and income inequality provides additional evidence of the variations in wealth and the well-being of people within a country across space (Wei, Citation2015). The geography of income level and income inequality becomes a particularly significant subject of study in times of economic crisis with soaring unemployment rates and severe cuts in wages and pensions. Nowhere in Europe were these conditions more evident than in Greece during the period of the Great Recession that began in 2008 and the implementation of the strict fiscal adjustment programmes after 2010.Footnote1
This paper analyses the geographical aspects of declared income and income inequality in Greece during the period 2002–14. In addition, it focuses on the impact of the economic crisis and tax reforms on the evolution of income per capita and income inequality across Greek municipalities. The analysis is based on individual micro-data, which constitute a random sample of 10% of the annual income tax declarations. A total of 7.5 million observations, about 500,000 declarations per year, are included in the analysis with information regarding declared and taxable income as well as important attributes of households and tax incidence.
Despite the above-mentioned advantages, this dataset has some important limitations. The variable ‘declared income’ captures the income received by households during the preceding calendar year which are submitted to tax authorities with the tax declarations in the following year. These data include income submitted by six categories of taxpayers: proprietors, traders, farmers, employees, self-employed and retired. However, these data cannot capture other types of income such as fiscal transfers to individuals of places. In addition, this dataset does not include income from the shadow/hidden economy, a chronic problem for the Greek economy (IOBE, Citation2018). Although ‘taxable’ income, an induced estimation of income based on objective criteria, which is also included in the dataset, complements the information regarding declared income, this dataset still cannot capture the net/real income level and income inequality in the country.
Contrary to these limitations, the quality, consistency, length and accuracy of the tax data provide well-grounded conditions to analyse the spatial and temporal evolution of income and income inequality and their association focusing on changes due to the economic crisis and tax reforms. In addition, following Piketty (Citation2014), tax data offer the advantage that they refer to registered incomes and tax incidences and are usually considered more suitable for the estimation of short-term changes in inequality.
The analysis is anticipated to meet a multiplicity of objectives. First, it provides a comprehensive overview of the taxation system and tax incidence by income group and by municipality in Greece. This research complements existing knowledge about inter- and intra-regional inequality and welfare in the country by focusing on municipalities. Second, it analyses the association between income level and income inequality over a long time period, which, to the best of our knowledge, is the longest period for which such research has ever been conducted for Greece. The time length of the analysis allows for a comparison before and during the economic crisis and the implementation of the memorandums and the fiscal adjustments programmes. Third, the analysis is based on individual tax declarations data that allow an estimation of the Gini index of income inequality. We trust that this is also the first time that such research has been conducted on the estimation of income inequality with individual declared income data for Greece over such a long time period. Fourth, the analysis pays specific attention to the geographical dimensions of income and income inequality at a small geographical/municipal level. The geographical attributes of taxation and the analysis of dynamics of income change at a small geographical level is an important issue for understanding the wealth conditions across the country and an important element for the evaluation of regional and fiscal policy. Finally, this research employs a combination of analytical tools in order to provide multidimensional statistical, cartographical and econometric evidence from a country that was hit severely by the economic crisis and was subject to the implementation of austerity policies and fiscal reforms. Austerity policy, with a huge decrease in public investment, had been a detrimental factor to the regional resilience, accelerated economic recession and widened geographical and income inequalities in the country (Psycharis et al., Citation2014; Psycharis et al., Citation2022).
The remainder of the paper is structured as follows. Section 2 provides a concise literature review regarding the geographical aspects of income inequality. Section 3 discusses the dataset and provides information about tax reforms, along with a descriptive analysis of declared income in Greece during the period under study. Section 4 analyses the geographical attributes of income and income inequality in Greece before and during the economic crisis. Section 5 presents the econometric specifications for the association between income level and income inequality at the municipal level before and during the economic crisis. Section 6 presents and discusses the econometric results. Finally, Section 7 summarises the key findings and sketches the framework and trajectories for further research.
2. INCOME INEQUALITY: SPACE MATTERS
Income inequality is a key issue in economic analysis as well as in social and welfare policy (Atkinson, Citation2015; Galbraith, Citation2012; Stiglitz, Citation2012). While empirical studies of income inequality at the national level have dominated the scientific literature, the geography of income inequality has become a distinct and rapidly accelerating strand of scientific research (Wei, Citation2015).
But why dies income inequality matter across space? First, local-level income inequality (e.g., income inequality at the municipality level) is likely to be different from national-level income inequality because it neither responds to the same factors nor creates the same policy implications (Florida & Mellander, Citation2016; Glaeser et al., Citation2009).
Second, there is likely to be an association between the geography of income inequality and the geography of income per capita. This association is addressed by the Kuznets (Citation1955) curve which shows that income per capita has an inverted ‘U’-curve effect on income inequality. According to this curve, income inequality increases as regions move to higher welfare levels and then declines at the mature stages of development. In the early stages of economic development, workers are likely to move from low-paid sectors, such as the large primary sector, to high-paid sectors, such as the secondary and tertiary sectors. This movement boosts further income inequality (Firebaugh, Citation2003). In the latter stages of economic development, as the low-paid sectors shrink and the high-paid sectors increase in size, further movement decreases income inequality. The investigation of the inverted ‘U’-turn hypothesis at local level constitutes an interesting and timely research area. As an example, exploring a unique panel dataset of Canadian regions, Breau and Lee (Citation2023) test whether interpersonal income inequality increases once the initial inverted-‘U’ pattern is completed. Analysis supports the notion of a sideways ‘S’-shaped curve describing a wavelike decrease to increase shift, with a turning point in the late 1990s/early 2000s.
Third, the geography of income inequality depends not only on the geography of income per capita but also on a series of other factors, such as the previous levels of wealth and inequality, human capital, agglomeration economies, economic structure and quality of institutions, which also vary across space (Hortas-Rico & Rios, Citation2019; Quito et al., Citation2023). The previous levels of both income per capita and inequality affect the geography of income distribution because history matters. Moreover, changes in income distribution take place at a very slow pace because, for example, people are often reluctant to change jobs and to migrate for psychological and institutional reasons (Gujarati, Citation2003; Rodríguez-Pose & Tselios, Citation2009a). A higher level of education is likely to increase the earning opportunity of the lowest strata and the social and job opportunities of the poor, reducing income inequality (Checchi, Citation2000; Rodríguez-Pose & Tselios, Citation2009a). The concentration of population in particular areas generates spillover effects upsurging the economic activities in these areas, which in turn affect income distribution (Iqbal et al., Citation2018). The sectoral composition of an area affects its income inequality because the added value of each sector to gross domestic product (GDP) differs. Since the sectoral composition varies across space, this variation affects the geography of income inequality. Using the case study of Indonesia, González Gordón and Resosudarmo (Citation2019) find a positive impact of both manufacturing and services shares of GDP on income inequality, but a negative impact of agriculture share of GDP on inequality. The quality of institutions shapes the distribution of income inequality. In economies with relatively high governance quality, such as in economies with high levels of voice and accountability, political stability, government effectiveness, regulatory quality, rule of law and control of corruption, a lower income inequality is expected than in economies with low governance quality (Tselios, Citation2023).
Fourth, an economic and financial crisis impacts the geographical dimension of income inequality because the austerity measures affect not only the geography of welfare but also all determinants of income inequality. For instance, it is quite usual for wages to fall during a crisis. However, wages differ across space making the impact of crisis on areas heterogeneous. Moreover, some sectors, such as manufacturing and tourism, suffer more in an economic crisis than others. Since the sector composition varies between regions, the impact of the crisis is unequal. Overall, the sign and the significance of the determinants of income inequality may differ between the pro- and after-crisis periods. Recent advances in research underlie the significance of the intra-/interpersonal inequality (Moretti, Citation2022). More precisely, place-based policies are not sufficient per se in promoting growth and inclusiveness. The benefits of an area are not necessarily trickled down in the same vain to all members of the area for many reasons. First, because the gains of capital are disproportionally higher compared with the gains of labour. Furthermore, the benefits of political interventions are not distributed evenly among income groups. Usually, the most educated and higher income workers or citizens can grasp easier the benefits of policy interventions than the less educated. In addition, the less well-off segments of population lack the skills and expertise to use in a disproportional manner the gains from the policy. As a result, interpersonal income inequalities may still continue to grow even if place-targeted policy is in action. This has been considered as a course of increasing populism and discontent (Rodríguez-Pose et al., Citation2023).
While inequality constitutes an alarming issue of our times, the spatiality of inequality enhances our understanding of the expressions of inequality and trigger further research on this topic.
The literature seems to lean towards two important conclusions. First, the level of urbanisation is highly correlated with the level of income inequality. Inequality is higher in large cities and urban agglomerations. Second, the level of education seems to have been one of the most significant factors of interpersonal income inequality across space.
With regards to Greece, there is relatively limited research regarding the geographical dimension of income and income inequality (Psycharis & Pantazis, Citation2016). More recently, Psycharis et al. (Citation2023) find that the Attica Metropolitan Region exhibits a higher degree of income inequality relative to the rest of the country, and the economic crisis increased inequality not only in this region but also in the rest of the country. Furthermore, Psycharis and Panori (Citation2023) find that segregation trends across municipalities in the Athens metropolitan area are high and increasing. These results are in line with Mastronardi and Cavallo (Citation2020) and Moser and Schnetzer (Citation2017) who show that interpersonal inequality within urban municipalities is higher in comparison with the rural areas for the Italian and Austrian municipalities, respectively. Mussida and Parisi (Citation2020) show that inequality appears largely to be a within-region problem across Italian regions, particularly in the South, and the crisis exacerbated this phenomenon. However, the relationship between income level and income inequality at the municipal level still remains a promising and underexploited area of research. This paper aims to fill, at least in part, the existing gap and trigger further research on this research topic.
3. GREEK ECONOMIC CRISIS AND DECLARED INCOME: BASIC FACTS AND FIGURES
3.1. Data on declared income and definition of the variables
This paper is based on a purpose-constructed database which includes micro-data for 10% of the annual household declarations for the time period 2002–14. This dataset includes information on two types of income: declared income and taxable income. The difference is that while the former is based on the gross income that has been generated within a year for each member of the household, and is submitted to the tax authority with the annual tax declarations, the latter is the income that has been estimated either by deducting tax exemptions from the gross income or by taking into consideration different attributes of the individuals, such real estate or car ownership.
The analysis carried out for this research is based on equivalent individual income.Footnote2 Income inequality has been measured with the estimation of the Gini index (known as Gini coefficient) which summarises the dispersion of income across the entire income distribution and varies between 0 (i.e., everyone has the same income) and 100 (i.e., one person has all the income) The Gini index, which is the most popular measure of income inequality, is easy to interpret and acceptable to test models of income inequality (Rodríguez-Pose & Tselios, Citation2009b). The Gini index allows for comparison among regions with different population sizes. Contrary to much of the literature that the Gini index is more sensitive to changes around the median of the income distribution than to changes among the very rich or the very poor (Allison, Citation1978; Firebaugh, Citation2003), Gastwirth (Citation2017) shows that the Gini index is more sensitive to changes in the lower and upper parts of the distribution than in the middle.
The geographical level of analysis refer to the 325 municipalities that constitute the first tier of local government in Greece (Law 3852/2010). Municipalities are grouped into six categories based on population and geographical characteristics (Law 4555/2018): metropolitan, large mainland, medium mainland, small mainland, large islands and small islands.
3.2. The evolution of income inequality
shows the evolution of declared and taxable income and clearly shows that, after 2011, declared and taxable income dropped substantially. The fiscal consolidation reform was implemented with detrimental effects on economic activity, growth and finally on tax revenues. Between 2008 and 2014 the revenue from personal income tax dropped by 24% (European Commission, Citation2016). This was the outcome of simultaneous increases in unemployment, cuts in wages and pensions, and increases in taxes.
Figure 1. Evolution of income per capita and income inequality (Gini index).
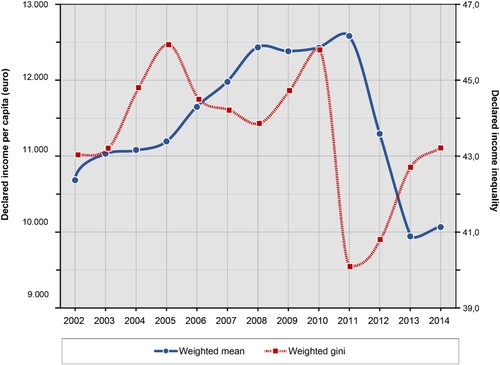
However, shows that income inequality also dropped. This is more pronounced in the case of taxable than in the case of declared income. This drop in inequality in declared income could be primarily attributed to the broadening of the tax base and the increased number of declarations in the low brackets of the income scale.Footnote3 Part of the explanation could also be attributed to the drop in high incomes due to the increased tax rate scales, the imposition of the solidarity tax and the cuts in salaries for the high-income earners.
4. THE GEOGRAPHICAL INCIDENCE OF DECLARED INCOME
4.1. Cartographical representation of income and income inequality
portrays income level and income inequality at the municipal level in Greece for the period 2012–2014. More precisely, the upper part presents the inequalities in declared income at the municipal level for the periods before and during the economic crisis and the implementation of fiscal reforms. The comparative examination of these maps provides some interesting findings.
Figure 2. Geography of income per capita and income inequality (Gini index).
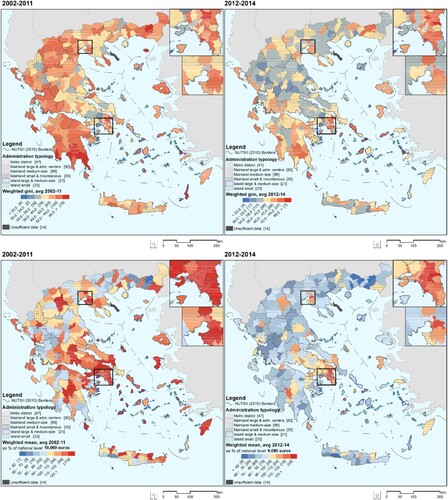
During the period 2002–11, there are important differences in the levels of income per capita across the municipalities. The first observation shows that there is a gap between a large number of metropolitan and medium municipalities and Islands on the one hand, and the most remote, small and mountainous municipalities on the other hand.
However, during the period 2012–14 the map changes. First, the average level of declared income during the crisis and the implementation of fiscal adjustment programmes has dropped. However, its drop is not geographically uniform. Most municipalities outside the large metropolitan areas reveal levels of declared income per capita below the country average. As a result, inequalities in the level of average income per capita between municipalities during the economic crisis have widened.
Furthermore, the geography of income inequality among individuals within municipalities is portrayed on the two maps at the lower/bottom part of . Comparing these maps with those in the upper part, it can be observed that they contradict each other in many ways. The most striking observation is that during the period of economic crisis interpersonal income inequality declined. This is more pronounced in municipalities outside the large metropolitan areas.
The decrease in interpersonal income inequality in the municipalities outside the large urban agglomerations can be attributed to two simultaneous factors. First, there is the widespread obligation for a vast number of people across the country to submit declarations. The number of people obligated to make a tax declaration increased and crosses all the income groups, especially the lower income groups, across the country. At the same time, the drop in incomes due to the economic recession and wage and salary cuts has led to the reduction in incomes relative to the pre-crisis period. The combined effects of these two trends, namely the increase of low-income tax declarations across space, along with the further decrease in the relatively lower incomes outside the urban agglomerations, has led to the decrease of interpersonal income inequality in areas outside the large cities and urban agglomerations. The interpretation of inequality questions the inclusiveness of the tax policy since the drop in inequality is achieved primarily with the increase in tax of the low-income taxpayers.
4.2. The evolution in income level and income inequality
These results can be further scrutinised by type of municipality. clearly shows that the level of income and the dispersion of inequality varies significantly by type of municipality.
Figure 3. Evolution of income and the dispersion of income inequality (Gini index) by category of municipality (constant price, 2015 = 100).
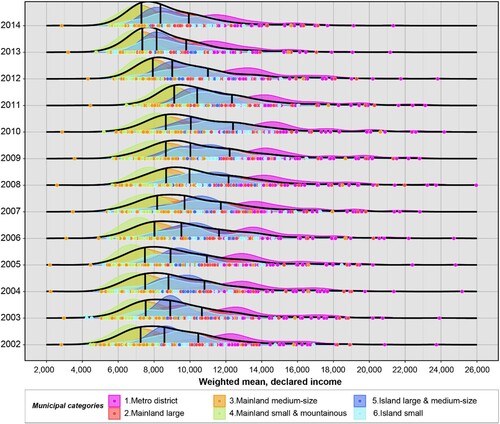
More precisely, the dispersion of income for the most urbanised municipalities is found at the upper end of the scale and the dispersion is higher compared with the small mainland municipalities. This documents that average declared income in metropolitan municipalities in higher than the average declared income in the small mainland municipalities. In addition, interpersonal inequalities within metropolitan municipalities are higher compared with the interpersonal income inequality within small mainland municipalities. This trend is more pronounced than it was in the past and has further intensified during the years of economic crisis and the implementation of fiscal adjustment programmes.
These findings document that geography matters in terms of income inequality. The type of interpersonal income inequality it is not at all neutral regarding the type of municipality.
4.3. The dispersion of income by type of municipality
goes a step further in order to examine more precisely how interpersonal income inequality is related with the type of municipality. More precisely, it presents the relationship between income levels and income inequality for the six categories of municipalities.
Figure 4. Evolution of the relationship between income and income inequality (Gini index) by category/group of municipalities (constant price, 2015 = 100).
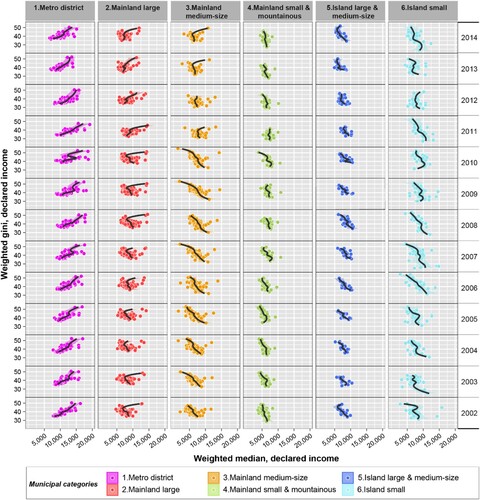
This scatterplot documents the positive relationship between income levels and income inequality for metropolitan municipalities. For the municipalities in metropolitan areas, an increase in income is followed by an increase in income inequality. This also applies to the majority of cases in the large mainland municipalities and capital cities.
However, the opposite applies in the case of the medium and small mainland and island municipalities. In these cases, an increase in income is followed by a decrease in income inequality. These findings provide initial evidence that income inequalities are higher in more urbanised areas of the country.
Summing up, it can be stated that geography matters both for inequalities in wealth across space as well as inequalities in wealth within municipalities. This relationship brings an interesting feature to the discussion of income inequalities. These findings will be further examined with the use of an econometric model.
5. THE ASSOCIATION BETWEEN INCOME PER CAPITA AND INCOME INEQUALITY
We now examine the relationship between income per capita and income inequality at the municipality level for two periods: (1) between 2002 and 2011 (before economic crisis) and (2) between 2012 and 2014 (within the economic crisis). The relationship between income per capita and income inequality is not presumed to be linear, but is configured using a stepwise approach, that is, we initially start with a linear income per capita variable and then add its square term. The explorative analysis shows a non-linear relationship between income per capita and income inequality. Therefore, we estimate the interpersonal income inequality of a municipality as a function of a municipality’s per capita income and its square term and a set of control municipality characteristics. Taking into account that, in theory, many socio-economic factors are correlated with income inequality, the selection of control variables draws on the microeconomic data availability. Hence, we use the following empirical specification.
(1)
(1) where
is inequality in declared or taxable income for municipality i in year t,
is declared or taxable income per capita, respectively, for municipality i in year t,
is a vector of control variables for municipality i in year t,
is unobserved municipality-specific characteristics which denotes spatial fixed effects and represents the effect of the omitted variables that are peculiar to each municipality such as the geographical characteristics of the municipalities,
is the unobserved time effect characteristics (i.e., time-period fixed effects) which controls for all time-specific spatial-invariant variables such as the business cycle, and
is the disturbance term. We run this econometric specification for both periods.
For the estimation of equation (1), we use fixed effects (FEs), because these effects allow for unobserved heterogeneity in the time-invariant geographical characteristics of the Greek municipalities. Even if we use observed time-invariant municipality-specific characteristics (such as dummies for island or mountainous municipalities), the FEs estimator cannot estimate the effect of these time-invariant variables because the within transformation wipes out those variables (Baltagi, Citation2005). Thus, the spatial FEs allow for both observed and unobserved heterogeneity in the time-invariant geographical characteristics. We also use time dummies, because if these dummies are statistically significant, the one-way FEs estimator will suffer from omission bias (Baltagi, Citation2005). Therefore, our econometric specification is a two-way FEs model. In our empirical specification, is a constant,
and
are coefficients on income per capita and its square term, respectively, and
is a vector of coefficients on controls. It should be clarified here that the effect of a change in per capita income on income inequality depends on the level of per capita income of the municipality. Therefore, the marginal effect of per capita income on income inequality is
(Brambor et al., Citation2006). Finally, we use cluster-robust standard errors in order to control for arbitrary heteroscedasticity and autocorrelation.
This empirical specification allows us to examine whether income distribution across people and within municipalities is associated with the wealth level of municipalities (i.e., income per capita) after controlling for some time-variant characteristics of municipalities () as well as the spatial and time-period fixed effects (
and
, respectively). The time-variant control variables are drawn from the microecoconomic database. These variables are: (1) the number of population samplings of a municipality divided by the size of the municipality (km2), which is a proxy for population density, (2) the mean number of children within a family, which is a proxy for family size,Footnote4 (3) the mean number of cars of a family, which is a proxy for family lifestyle, (4) the percentage of married people within a municipality, which is a proxy for family status, and (5) the percentage of people within a municipality based on their main income source (i.e., proprietors, traders, farmers, employees, self-employed and retired).
We then examine whether the association between income per capita and income inequality differs by municipality type, which is a time-invariant categorical variable. Thus, we run equation (1): (a) for large and medium islands, (b) for small islands, (c) for large mainland, (d) for medium-sized mainland, (e) for small and mountainous mainland and (f) for metro district municipalities, for both periods.
presents the descriptive statistics of the variables for municipalities with population samples () greater than or equal to 50 people, for the two periods: 2002–11 and 2012–14. Interpersonal income inequality is measured by the Gini index, which is 0 for perfect equality and 100 for perfect inequality. We consider both declared and taxable income distribution. Despite the conceptual differences between the declared and the taxable income distribution, the correlation coefficients between the declared and taxable income per capita, as well as between inequality in the declared and taxable income, is very high (0.9960 and 0.8985, respectively, for the whole period of analysis). The average mean of the declared income inequality index during the period 2002–11 is 41,175, while during the period 2012–14 it is 38,829. Declared income inequality decreased by 5.68%. The average mean of the taxable income inequality index, which is lower than that of the declared income inequality, decreased as well (from 40,194 to 33,391), but this reduction is much higher (20.37%). The descriptive statistics for the declared and taxable income per capita show that declare income per capita decreased by 10.76% while taxable income per capita 5.39%. Regarding the control variables population density, the mean number of cars and the percentage of married people have decreased and are likely to be the result of the economic crisis, while the mean number of children has not changed. Finally, the main sources of income are salaries and pensions for both periods.
Table 1. Descriptive statistics.
6. REGRESSION RESULTS
The empirical analysis exploits the panel structure of the dataset for 311 Greek municipalities (i.e., municipalities with population samples () greater than or equal to 50 declarations) from 2002 to 2011 (before crisis) and from 2012 to 2014 (within the crisis), by FE estimation taking into account unobserved municipality-specific effects. To evaluate the robustness of the results in terms of the population size of the municipalities, we experimented with different sizes of population samples. We start with
, and then
(297 municipalities),
(229 municipalities),
(154 municipalities),
(84 municipalities) and
(54 municipalities). We also checked whether municipalities with very small population samples (
), which represent the very small populated municipalities (11 municipalities), are important for the estimation results, but omitting these observations has almost no effect.Footnote5 Finally, we used populated weighed regressions to further explore the robustness of the results in terms of the population size. However, the differences between unweighted and weighted regressions should be mentioned here (Sala-i-Martin, Citation2003; Tselios et al., Citation2012). In the unweighted regressions, each Greek municipality is weighted the same, and thus the emphasis of analysis and policy is on Greek municipalities, while in the weighted regressions, highly populated municipalities have more weight than lower populated ones, because each Greek citizen should be weighted the same, and therefore the emphasis is on Greek citizens. In this section, we initially examine the relationship between income per capita and income inequality before and within crisis, and then, whether this association differs by municipality type.
displays the FE regression results when the dependent variable is the declared income inequality for the two periods of analysis: (a) 2002–11 (regressions 1–7) and (b) 2012–14 (regressions 8–14). The R-within confirms the overall goodness-of-fit of all the regressions presented and the F-statistics probability lets us reject the null hypothesis that all coefficients are zero. The performance of the regressions is in general satisfactory because our specifications account for more than half of the variance in income inequality across the sample for both periods. Moreover, there is a gradual increase in R-within as the population size of the municipalities increases (from regressions 1–6, and from regressions 8–13), for example, the R-within in regression 1 is 0.5412 while in regression 6 it is 0.7904.
Table 2. Regression results for inequality in declared income.
In the period 2002–11, regressions 1–3 show that there is a strong ‘U’-shape relationship between declared income per capita and declared income inequality, but this association weakens as the population size of the municipality increases (for the marginal effects, see Appendix 1 in the supplemental data online). Therefore, there is evidence that an increase in municipal welfare levels – measured by the declared income per capita – is associated (1) with a reduction in income inequality for low-income municipalities, (2) with a lower reduction or a very low increase in inequality for middle-income municipalities, and (3) with an increase in inequality for high-income municipalities (regressions 1–3). This finding is not robust for all regions, as there is no evidence of a ‘U’-shape welfare–inequality relationship for municipalities with relatively large populations (regressions 4–6). The non-linear association between income per capita and income inequality (‘U’-shaped) is also confirmed by the population weighted regression (regression 7; for the marginal effects, see Appendix 1 online).
In the period 2012–14, the association between income per capita and income inequality within the crisis is different than it is before the crisis. For the period 2012–14, there is evidence that an increase (decrease) in income per capita is related to an increase (decrease) in income inequality (regressions 8–11 and 14). This finding is also confirmed by examining the linear association between income per capita and income inequality (see Appendix 2 in the supplemental data online). The welfare–inequality relationship is moderated by the welfare level of municipalities only for the large populated ones, as for these municipalities, there is an inverted ‘U’-shape relationship between income per capita and income inequality (regression 13; for the marginal effects, see Appendix 1 in the supplemental data online).
As for the controls, there is weak evidence for the within-crisis period that an increase in the population density, in the average number of children or in the mean number of cars increases income inequality, but that increase in the percentage of married people reduces inequality. The results for both periods show that rise in the percentage of people whose main source of income is renting increases income inequality. Once more, the results show that income inequality increased from 2002 to 2011, it decreased drastically in 2011 and then it increased from 2012 to 2014.
But are there differences in the relationship between income per capita and income inequality between different types of municipalities? shows that the ‘U’-shape relationship between income per capita and income inequality from 2002–11 holds for large and medium-size islands (regression 1) and for the mainland (regressions 3–5). And the magnitude of the coefficients is higher for the small and mountainous islands (regression 5). However, this is not the picture for the metro district municipalities (47 municipalities), because there is strong evidence that there is an inverted ‘U’-shape relationship between income per capita and income inequality (regression 6). Hence, a rise in welfare for the relatively less-wealthy metropolitan areas increases income inequality, but a rise in welfare for the relatively wealthier metropolitan areas reduces inequality. also shows that the positive association between income per capita and income inequality over 2012–14 is more profound for the large and medium-size mainland (regressions 9 and 10, respectively).
Table 3. Regression results for inequality in declared income by municipality type.
The findings when the dependent variable is inequality in taxable income are similar to the findings when the dependent variable is inequality in declared income (see Appendix 3 in the supplemental data online).Footnote6
Overall, there is strong evidence that the association between declared or taxable income per capita and inequality in declared or taxable income, respectively, differs between the periods 2002–11 and 2012–14, as well as between the metro district municipalities and the other municipalities. Economic crisis and tax reforms highlight a ‘turning point’ for the geography on income inequality across Greek municipalities.
For the period before the crisis, there is a ‘U’-shape relationship between (either declared or taxable) income per capita and income inequality for non-metro-district municipalities (i.e., islands and mainland). An increase in the income of non-metropolitan municipalities is likely to be associated with a decrease in income inequality within the municipality, but this negative association is lower as income (welfare) increases and then becomes positive for relatively rich municipalities. For the very high economic welfare municipalities, an increase in welfare may be linked with a rise in income inequality. In other words, the benefits of economic growth for a poor municipality (i.e., an increase in income per capita), as a result of lower taxes, are likely to trickled down gradually to all members of the municipality by raising low incomes and subsequently narrowing the income gap. However, this reduction in income inequality is lower as income increases, and for the rich, but non-metro-district, municipalities a further increase in wealth is linked with an increase in inequality.
The picture for the metro-district municipalities is different, as the welfare-inequality relationship is an inverted ‘U’-shape, that is, an increase in welfare for metropolitan areas increases inequality, but for the relatively rich urban areas, a welfare increase reduces inequality. These finding are robust to changing the definition of income inequality, but the welfare-inequality association is much stronger for taxable than for declared income distribution.
For the period within the crisis, an increase (decrease) in either declared or taxable income per capita is associated with an increase (decrease) in income inequality, especially for the large or medium-size mainland municipalities. However, further increases (decreases) in taxable income per capita are likely to reduce (increase) income inequality.
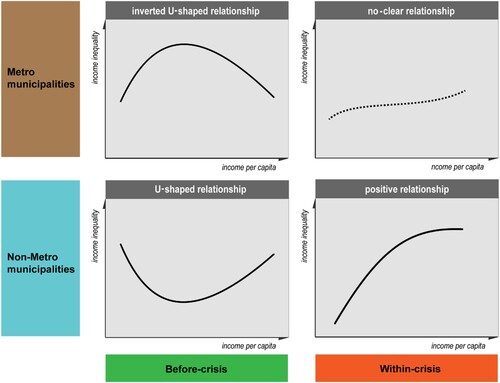
Summing up it could be said that there is a very specific type of income inequality in Greece, which is determined by factors such as time (before and during the economic crisis), geography (type of municipality) and level of wealth (per capita income). The combination of these factors provide different ‘geographies of inequality’. These finding are sketched and summarised in .
Figure 5. Types of income inequality at the municipal level in Greece.
7. DISCUSSION AND CONCLUSIONS
The main goal of this paper has been to explore the evolution and relationship between income per capita and income inequality at municipal level in Greece before and during the economic crisis. Analysis has provided different ‘geographies of inequality’. Economic crisis signifies a ‘turning point’ in the geographies of inequality.
The obtained results are sensitive to the period of analysis (before and during the crisis), type of municipality (metropolitan, urban, large and medium and small mainland, and small and large islands) and income level (better-off and less well-off).
Regarding the evolution of income per capita, economic crisis and fiscal consolidation reforms dropped substantially income level across municipalities. However, the income drop had not been homogenous across municipalities. The geography of changes in income per capita across municipalities shows that mainland middle and small municipalities lost more while islands lost less. Within cities drop of income had been spatially uneven.
Regarding intra-/interpersonal income inequality analysis provides evidence that economic crisis resulted in a decrease of interpersonal inequality at relatively less well-off municipalities and increase of interpersonal inequality in the relatively well-off municipalities of the country. Interpersonal income inequalities in cities and large agglomerations have been higher relative to the municipalities outside the urban areas. Economic crisis has increased income inequalities in cities and decreased income inequalities in rural areas.
Finally, the existence of a Kuznets inverted ‘U’-shaped relationship between income per capita and income inequality is not at all a case of ‘one size fits all’.
The association between income per capita and income inequality is in accordance with the predictions of Kuznets inverted ‘U’-turn for the cases of metro-municipalities before the economic crisis. However, analysis shows that there exists an ‘U’-turned relationship between income per capita and income inequality for the non-metro municipalities before the crisis.
Conversantly, economic crisis reveals a positive association of income per capital and income inequality for the relatively more well-off municipalities in cities and metropolitan areas.
These differentiated geographies of income per capital and income inequality call for different policy responses combining place-based along with people-centred policies in achieving territorially balanced and inclusive development for all the people.
This study offered some initial insights regarding the geographical dimension of income inequality in Greece. However, much work remains to be done. The geography of inequality constitutes a long range issue. Future research will build on a continuously updated, enriched and expanded database which could serve as a main source of analysis. Income inequalities in cities and large metropolitan areas and the association between income inequalities, voting patterns and political discontent are among the next trajectories of our research.
Supplemental Material
Download MS Word (83.6 KB)DISCLOSURE STATEMENT
No potential conflict of interest was reported by the authors.
Additional information
Funding
Notes
1 The First Economic Adjustment Programme for Greece, ‘the first Memorandum’, was signed in 2010 by the Greek Government, the European Commission and the International Monetary Fund (IMF). The Second Economic Adjustment Programme for Greece, ‘the second Memorandum’, was signed in 2012. The third Memorandum, signed in 2015, is outside the time frame of the analysis in this paper.
2 Equivalised declared (taxable) income is the total income of a tax declaration divided by the number of household members converted into equivalised adults; household members are equivalised or made equivalent by the following so-called modified OECD equivalence scale: the first household ‘adult’ member counts as one person, the other adult household members count as 0.5 person, each household member indicated as a ‘child’ aged 14 years or more counts as 0.5 person, and each household member indicated as a ‘child’ aged 13 years or less counts as 0.3 person.
3 The lower income taxpayers had an increase in the tax burden by 337.7%, while those in high-income classes an increase of only 9%. Or the share of the lower income groups to the tax-led adjustment increased from 2.5% to 9.4%, while that of the higher income groups decreased from 97.5% to 90.6% (European Commission, Citation2016, p. 33).
4 This variable is highly correlated with the mean number of members within a family, which is a better proxy for family size (correlation coefficient = 0.8897). However, we do not use this variable in our analysis because it is highly correlated with the percentage of married people within a municipality, which is another control (correlation coefficient = 0.7242).
5 These results can be provided by the authors upon request.
6 Moreover, the findings are robust to the measurement of income inequality. This is hardly surprising, because the Gini index is highly correlated with the other indices of measuring income inequality, such as the Theil index and the squared coefficient of variation.
REFERENCES
- Allison, P. D. (1978). Measures of inequality. American Sociological Review, 43(6), 865–880. https://doi.org/10.2307/2094626
- Atkinson, A. (1997). Bringing income distribution in from the cold. The Economic Journal, 107(441), 297–321. https://doi.org/10.1111/j.0013-0133.1997.159.x
- Atkinson, A. B. (2015). Inequality: What Can Be done? Harvard University Press.
- Atkinson, A. B., & Piketty, T. (2010). Top incomes. A global perspective. Oxford University Press.
- Atkinson, A. B., Piketty, T., & Saez E, e. E. (2011). Top incomes in the long run of history. Journal of Economic Literature, 49(1), 3–71. https://doi.org/10.1257/jel.49.1.3
- Baltagi, B. H. (2005). Econometric analysis of panel data. John Wiley.
- Bourguignon, F. (2015). The globalization of inequality. University Press.
- Brambor, T., Clark, W. R., & Golder, M. (2006). Understanding interaction models: Improving empirical analyses. Political Analysis, 14(1), 63–82. http://www.jstor.org/stable/25791835
- Breau, S., & Lee, A. (2023). The evolution of the Kuznets curve in Canada. Papers in Regional Science, 1–27. https://doi.org/10.1111/pirs.12737
- Cavanaugh, A., & Breau, S. (2018). Locating geographies of inequality: Publication trends across OECD countries. Regional Studies, 52(9), 1225–1236. https://doi.org/10.1080/00343404.2017.1371292
- Checchi, D. (2000). Does educational achievement help to explain income inequality? Departmental Working Papers 2000–11, Department of Economics, University of Milan, Italy.
- Dabla-Norris, E., Kochhar, K., Ricka, F., Suphaphiphat, N., & Tsounta, E. (2015). Causes and consequences of income inequality: A global perspective. IMF Staff Discussion Notes No. 15/13.
- Dorling, D. (2015). Inequality and the 1%. Verso.
- European Commission. (2014). Taking stock of the Europe 2020 strategy for smart, sustainable and inclusive growth, Communication from the Commission to the European Parliament, the Council, the European Economic and Social Committee and the Committee of the regions., Brussels, 19.3.2014, COM(2014) 130 final/2.
- European Commission. (2016). Political economy of Tax reforms, proceedings of the workshop organised by the directorate general for economic and financial affairs (DG ECFIN) held in Brussels on 19 October 2015, S. Princen (Ed.). Office for Official Publications of the European Communities.
- European Commission. (2022). https://ec.europa.eu/regional_policy/policy/how/priorities_en, accessed 22/7/2023.
- Firebaugh, G. (2003). The new geography of global income inequality. Harvard University Press.
- Florida, R., & Mellander, C. (2016). The geography of inequality: Difference and determinants of wage and income inequality across US metros. Regional Studies, 50(1), 79–92. https://doi.org/10.1080/00343404.2014.884275
- Galbraith, J. K. (2012). Inequality and instability. Oxford University Press.
- Gastwirth, J. L. (2017). Is the Gini index of inequality overly sensitive to changes in the middle of the income distribution? Statistics and Public Policy, 4(1), 1–11. https://doi.org/10.1080/2330443X.2017.1360813
- Glaeser, E. L., Resseger, M., & Tobio, K. (2009). Inequality in cities. Journal of Regional Science, 49(4), 617–646. https://doi.org/10.1111/j.1467-9787.2009.00627.x
- González Gordón, I., & Resosudarmo, B. P. (2019). A sectoral growth-income inequality nexus in Indonesia. Regional Science Policy and Practice, 11(1), 123–139. https://doi.org/10.1111/rsp3.12125
- Gujarati, D. N. (2003). Basic econometrics. McGraw-Hill.
- Hortas-Rico, M., & Rios, V. (2019). The drivers of local income inequality: A spatial Bayesian model-averaging approach. Regional Studies, 53(8), 1207–1220. https://doi.org/10.1080/00343404.2019.1566698
- International Monetary Fund (IMF). (2015). Causes and consequences of income inequality: A global perspective, strategy. Policy, and Review Department.
- IOBE. (2018). Η φορολογία Εισοδήματος στην Ελλάδα, Income tax in Greece, Athens (in Greek).
- Iqbal, A., Hassaan, M., & Mahmood, H. (2018). Income inequality and agglomeration economies: A case of a developing economy. International Journal of Economics and Business Research, 15(2), 257–271. https://doi.org/10.1504/IJEBR.2018.089686
- Kuznets, S. (1955). Economic growth and income inequality. American Economic Review, 45, 1–28.
- Mastronardi, L., & Cavallo, A. (2020). The Spatial Dimension of Income Inequality: An Analysis at Municipal Level. Sustainability, 12(4), 1622.
- Moretti, E. (2022). Place-based policies and geographical inequalities. IFS Deaton Review of Inequalities.
- Moser, M., & Schnetzer, M. (2017). The income–inequality nexus in a developed country: Small-scale regional evidence from Austria. Regional Studies, 51(3), 454–466. https://doi.org/10.1080/00343404.2015.1103848
- Mussida, C., & Parisi, M. L. (2020). Features of personal income inequality before and during the crisis, An analysis of Italian regions. Regional Studies, 54(4), 472–482. https://doi.org/10.1080/00343404.2019.1624711
- Organisation for Economic Co-operation and Development (OECD). (2014). Income inequality update: Rising inequality: youth and poor fall further behind Insights from the OECD Income Distribution Database, June 2014.
- Organisation for Economic Co-operation and Development (OECD). (2019). Inequality and income. http://www.oecd.org/social/inequality.htm
- Piketty, T. (2014). Capital in the twenty-first century. Harvard University Press.
- Piketty, T., & Saez, E. (2003). Income inequality in the United States, 1913–1998. The Quarterly Journal of Economics, 118(1), 1–41. https://doi.org/10.1162/00335530360535135
- Psycharis, Y., Georgiadis, T., & Nikolopoulos, P. (2023). The geographical dimension of income and consumption inequality: Evidence from the Attica metropolitan region of Greece. Region, 10(1), 183–197. https://doi.org/10.18335/region.v10i1.452
- Psycharis, Y., Kallioras, D., & Pantazis, P. (2014). Economic crisis and regional resilience: Detecting the ‘geographical footprint’ of economic crisis in Greece. Regional Science Policy & Practice, 6(2), 121–141. https://doi.org/10.1111/rsp3.12032
- Psycharis, Y., & Panori, A. (2023). Small-scale socio-economic conditions and residential segregation: Evidence from the municipalities across the metropolitan region of Attica. The Romanian Journal of Regional Science, 17(1), 38–65.
- Psycharis, Y., Panori, A., & Athanasopoulos, D. (2022). Public investment and regional resilience: Empirical evidence from the Greek regions. Tijdschrift Voor Economische en Sociale Geografie, 113(1), 57–79. https://doi.org/10.1111/tesg.12499
- Psycharis, Y., & Pantazis, P. (2016). The geography of declared income in Greece before and during the economic crisis. Regions Magazine, 303(1), 4–7. https://doi.org/10.1080/13673882.2016.11760792
- Quito, B., del Río-Rama, M. l. C., Peris-Ortiz, M., & Álvarez-García, J. (2023). Spatial-temporal determinants of income inequality in the Cantons of Ecuador between 2010 and 2019: A spatial panel econometric analysis. Journal of the Knowledge Economy. https://doi.org/10.1007/s13132-023-01373-y
- Rodríguez-Pose, A., Terrero-Dávila, J., & Lee, N. (2023). Left-behind versus unequal places: Interpersonal inequality, economic decline and the rise of populism in the USA and Europe. Journal of Economic Geography, lbad005, https://doi.org/10.1093/jeg/lbad005
- Rodríguez-Pose, A., & Tselios, V. (2009a). Education and income inequality in the regions of the European Union. Journal of Regional Science, 49(3), 411–437. https://doi.org/10.1111/j.1467-9787.2008.00602.x
- Rodríguez-Pose, A., & Tselios, V. (2009b). Mapping regional personal income distribution in Western Europe: Income per capita and inequality. Finance a úvér-Czech Journal of Economics and Finance, 59(1), 41–70.
- Sala-i-Martin, X. X. (2003). Keynote speech: Convergence and divergence – theoretical underpinnings. In G. Tumpel-Gugerell, P. Mooslechner, & Oesterreichische nationalbank (Eds.), Economic convergence and divergence in Europe: Growth and regional development in an enlarged European union (pp. 117–127). Edward Elgar.
- Stiglitz, J. E. (2012). The price of inequality. W.W. Norton.
- Tselios, V. (2023). Does political decentralization affect income inequality? The role of governance quality. Regional Studies, 57(5), 829–843. https://doi.org/10.1080/00343404.2022.2101634
- Tselios, V., Rodríguez-Pose, A., Pike, A., Tomaney, J., & Torrisi, G. (2012). Income inequality, decentralisation, and regional development in Western Europe. Environment and Planning A, 44(6), 1278–1301. https://doi.org/10.1068/a44334
- United Nations. (2015). Transforming our world: Τhe 2030 agenda for sustainable development, resolution adopted by the general assembly on 25 September 2015.
- Wei, Y. H. D. (2015). Spatiality of regional inequality. Applied Ge.