
 ?Mathematical formulae have been encoded as MathML and are displayed in this HTML version using MathJax in order to improve their display. Uncheck the box to turn MathJax off. This feature requires Javascript. Click on a formula to zoom.
ABSTRACT
Differences in regional incomes are large and persistent in many countries. On the one hand, internal migration from low- to high-income regions might eradicate these differences over time. On the other hand, internal migration might exacerbate disparities, as receiving regions benefit from incoming skills and agglomeration economies. This paper estimates the effect of internal in- and out-migration on the earnings of employees who do not move, using a panel of employee records from Great Britain between 2004 and 2018. Employees are tracked and identified as internal migrants if they start working in a new travel-to-work area (TTWA), representing functional labour market areas. The share of in- and out-migrants is significantly correlated with earnings and earnings growth of non-migrants in a TTWA. The results show that in-migrants have an immediate negative effect on local earnings of non-migrants. After three years, in-migration is positively correlated with earnings growth. These effects are exclusively driven by urban areas. Out-migrants have no significant effects. The results provide some evidence that labour mobility can be used as a tool to encourage local growth, albeit with significant adjustment costs.
1. INTRODUCTION
Regional income inequality in the UK is high and persistent, leading the Government in 2022 to declare ‘levelling up’ regional inequalities as its primary goal. Faced with stark inequality, movements from low-income to high-income regions have the potential to eradicate regional earnings differences over time. However, despite relatively high levels of labour mobility, earnings inequality in the UK remains high. This paper seeks to answer the question of how internal migration affects local earnings.
It is widely understood that internal migration has positive earnings effects on migrants themselves. However, internal migrants tend to be higher-skilled and younger than the rest of the population. Indeed, incoming flows of graduates have positive effects on local economies (Faggian & McCann, Citation2009; Iammarino & Marinelli, Citation2015). Internal migration flows might contribute to a virtuous cycle of regional growth: population growth contributes to agglomeration economies, which in turn attracts more internal migrants (Mitze & Schmidt, Citation2015). Through this channel, internal migration might exacerbate rather than reduce regional inequalities. Since this paper considers only internal migration and not immigration from abroad, in the following, migrants refers exclusively to those moving within the UK. They are referred to as in-migrants in reference to the receiving area and out-migrants in reference to the area they are leaving.
This paper utilises the Annual Survey of Hours and Earnings individual records. The survey provides a detailed picture of employment-linked internal migrations in Great Britain, as well as earnings of migrants and non-migrants. It tracks a 1% sample of all employees above the income tax threshold – over 2 million observations – throughout their working lives, even as they change employer or place of work. Consistent data are available for the years 2004 to 2018, with several variables available for years since 1975.
The goal of the paper is to estimate the effect of internal in- and out-migration on the earnings of employees who do not move. The findings show that inflows of migrants to a local labour market exert downward pressure on wages at first, consistent with a classic labour supply and demand framework. However, over the course of three years, this turns into a positive association with wage growth, which is stronger in urban areas, suggesting that in-migration contributes to local productivity growth. In contrast, out-migration from a local labour market does not have a significant effect on the earnings of those staying behind, neither in the short or medium term.
The paper proceeds as follows: Section 2 provides an overview of the previous literature and develops the hypotheses. The dataset and empirical methods are presented in Section 3. Section 4 presents the results, discussed in Section 5. Section 6 concludes.
2. LITERATURE REVIEW
In the UK, internal migration matters in the context of big earnings discrepancies between rich and poor regions, in particular the North–South divide. Economic decline in the north since the 1970s was met with population decline, which only stopped in the 2000s when immigration from abroad into those regions picked up. There is some evidence that internal migration in the UK has slowed over time, but this is not the case for long distance moves, the focus of this paper (Champion & Shuttleworth, Citation2017).
In a simple framework, internal migration is a reaction to regional earnings differences. If earnings are higher in one region, workers from lower-earning regions will move there (González-Leonardo et al., Citation2022; Lehmer & Ludsteck, Citation2010). In general equilibrium, this can be conceptualised as a shock to labour supply, affecting also the wages of those who do not move. As labour supply falls in the low-income region, earnings increase. Simultaneously, earnings fall in the high-income region as labour supply increases, assuming that labour demand does not change in the short term.
Hypothesis 1: In-(out-)migration has a negative (positive) effect on earnings in the short-run.
Hypothesis 2: In-(out-)migration has a positive (negative) effect on earnings in the medium term.
Hypothesis 3: The medium term effects are larger in urban areas.
3. DATA AND METHODS
The study relies on a long-running employment survey that also provides information on employees earnings and place of work, the Annual Survey of Hours and Earnings (ASHE) (Office for National Statistics, Citation2019). The survey tracks individuals through their working lives even as they change their place of work, so that internal migrants can be identified.
ASHE is a 1% panel of pay-as-you-earn (PAYE) tax registered employees, who are selected randomly by their national insurance number (NiNo). Questionnaires are completed by employers from payroll information. Employees earning less than the income tax threshold (£11,850 in 2018/19) and self-employed workers are not included in the survey. By definition, those out of employment are not covered, and only earnings from and hours worked in formal employment, before taxes, benefits and other transfers are captured.
Since the dataset is a panel with an annual observation for each employee, it is possible to trace people as they move and change jobs. Each year, employees appearing on ASHE are identified as internal migrants if their travel-to-work area (TTWA) of employment is different to that of the previous year. Employees that were missing for one year only are also counted as migrants if the TTWA differs before and after the break. Employees are assigned to TTWAs by the postcode of their place of work. To increase sample sizes in remote areas, some TTWAs were consolidated, bringing the total number down from 218 to 150 TTWAs of more even size (following Gibbons et al., Citation2014). While I refer to migrants as ‘moving’ between areas, it is possible that the place of residence does not in fact change, and the individual only starts working in a new area. However, since TTWAs are defined so that most people live in the TTWA where they work, starting a new job in a different TTWA would on average be expected to go along also with a residential move. All changes in TTWA are considered as migrations, regardless of the distance moved, and changes between high- and low-income or urban and non-urban areas.
To test the hypotheses developed above, the estimation strategy relates earnings to in- and out-migration in the local area. The estimating equation is provided by EquationEquation (1(1)
(1) ), where
are log gross weekly earnings of individual
in year
.
and
are internal in- and out-migrants arriving in or leaving area
, where individual
works in year
,
are individual characteristics such as age,
is an area dummy to capture differences such as housing costs across regions and
is a year dummy to control for macroeconomic shocks. Migrants are measured as a share of total employment in area
.
(1)
(1) To test for the effects in the medium run, over 1–3 years, the dependent variable can be expressed in terms of growth rates for different time horizons. In EquationEquation (2
(2)
(2) ) this is expressed as the difference in log wages between year
and year
, where
is 1–3 years after the migration variables are measured.
(2)
(2) To test for stronger effects in urban areas, the sample is split into urban and non-urban areas, as defined by the Office for National Statistics (ONS) small area classification 2011. TTWAs are classified as urban if they consisted mainly of urban or suburban local areas at the 2011 census. Non-urban areas are predominantly made up of smaller cities and towns, villages and rural areas.
ASHE provides information on the hourly rate, usual hours worked, overtime and incentive pay, and the occupation and managerial duties of the employee, continuously for 1975 to 2018, but location identifiers are only available from 2004. As two time lags are required to identify the internal migrants, the analysis covers the years 2006 to 2018. Throughout the paper, earnings or wages refer to total gross weekly earnings, usually in logs, in an employee’s main job. Employer information such as industry and total employment are also included in the dataset. Occupations are coded to the main National Statistics Socio-economic Classifications (NSSEC), summarised into three classes for the analysis – higher, middle and routine/semi-routine occupations.
All monetary values are deflated using the consumer price index and are expressed in constant 2015 pound sterling. Employees reported to work more than 100 hours per week, earning less than £50, more than £100,000 per week or tripling their earnings from one year to another were removed as outliers. Individuals with reported age under 16 or over 64 were dropped from the sample. Those switching from working full-time to part-time or vice versa were also not considered, as this might distort earnings growth.
4. EMPIRICAL RESULTS
compares internal migrants identified on ASHE against the full sample. Migrants earn slightly more, but also work longer hours than all employees. They are more likely to be male and to be working full-time. As expected, there is a selection effect. Despite being younger, internal migrants earn more, on average £546 per week, compared to £515 for all employees. However, they also work longer hours (35.4 total hours compared to 33.98). In terms of hourly rates, the gap still persists, with £15.44 for migrants and £15.16 for all employees. Internal migrants work disproportionately in higher occupations (managerial or professional), according to the NSSEC classification. Migrants tend to move repeatedly: the migrants identified in the data were more likely to have already moved before. Internal migrants have fewer years of total labour market experience, calculated as the total number of years appearing on ASHE, consistent with the lower average age.
Table 1. Summary statistics for internal migrants and non-migrants.
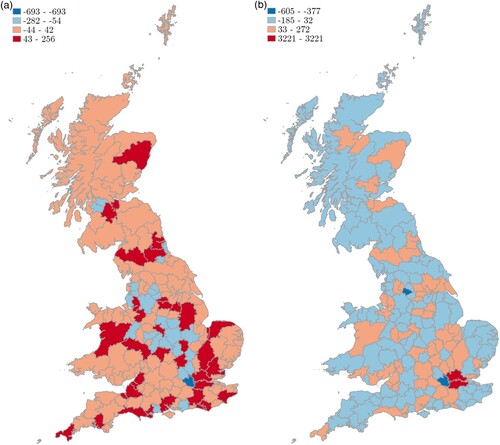
depicts the patterns of net migration in Great Britain between 2004 and 2018. This is expressed in terms of total gains or losses in employees, ranging from a loss of 693 in the dark blue shaded area to a gain of 256 in a dark red shaded area. Note that, as ASHE is a random 1% sample of all employees, these figures can be read as approximately one-hundredth of the actual net gains and losses of employees due to internal migration. For comparison, total employment change is added in panel b) of . Most areas, shaded in pink, registered neither small losses or gains, ranging from a loss of 44 to a gain of 42 employees due to internal migration. The areas gaining the most employees are distributed fairly evenly across the country. This picture is mostly mirrored in panel b) of , confirming that internal migration represents an important contribution to overall employment growth.
Figure 1. Internal migration of employees and employment growth by TTWA between 2004 and 2018. (a) Net migration of employees; (b) Employment growth.
presents regression results to test hypotheses 1 and 2, estimating the association between internal in- and out-migration and local earnings over different time horizons. The estimation sample includes only individuals who are not moving. The internal migration variables are internal in-migrants, who move to the TTWA between and
and internal out-migrants, who leave the TTWA between
and
, measured as shares of total employment on ASHE in
. Summary statistics for the baseline sample are provided in Table A.1 of the Supplemental Data.
Table 2. Effect of internal in- and out-migration on local earnings.
The regressions include individual characteristics including age, gender and job characteristics. The model is saturated with TTWA and year fixed effects. For each of the dependent variables, presents estimation results without individual fixed effects in the first three columns and estimations including individual fixed effects in the last three columns. They can control for unobserved personal characteristics that do not change over time, such as talent and completed education before entering the labour market.
Columns (1) and (4) in present results to test hypothesis 1, with log gross weekly earnings as the dependent variable. Both columns (1) and (4) show a statistically significant negative association between in-migration and local earnings. The coefficient is smaller in magnitude in column (4), which also controls for individual fixed effects. There is no comparable association with out-migration, with both coefficients being statistically insignificant and changing sign between columns (1) and (4).
To test hypothesis 2, the estimation is repeated for earnings growth between and
and earnings growth between
and
as the dependent variables. Earnings growth rates are computed as the log differences in gross weekly earnings between the time periods. For the estimations on growth rates, only employees are included who work in the same TTWA between
and
or
, respectively. Results for one-year earnings growth are presented in columns (2) and (5). None of the coefficients for in- or out-migration, with or without individual fixed effects are statistically significant. Results for three-year growth rates are presented in columns (3) and (6). Both coefficients of interest in column (3) are again statistically insignificant. Column (6) shows a marginally significant positive association between in-migration and earnings in the medium term. The association with out-migration is again statistically insignificant.
Across all estimations, the control variables have the expected signs. Earnings increase with age, but the rate of earnings growth is higher for younger people and falls with age. There is a negative earnings effect for women both in levels and in growth rates.Footnote1 Those working full-time earn more, while those with a second job earn less. Those working longer hours have higher earnings in levels but experience lower earnings growth. The occupation categories are dummy variables, with the middle category as the baseline. Employees in higher occupations earn more but experience slower earnings growth over time. This is the opposite for those in routine occupations, who earn less, but have higher earnings growth. Those who previously migrated themselves have higher earnings on average, but their earnings growth is not significantly different from those who never moved. The experience variable shows the same pattern as age, with a positive level and negative growth effects. Employer size, measured as total log employment at the place of work, is positively correlated with earnings, but earnings growth is slightly lower at larger businesses.
tests hypothesis 3, exploring different effects in urban and non-urban areas. Individual fixed effects, as well as all other control variables, are included in all specifications. There are clear differences in the observed coefficients between the urban and non-urban samples. For the urban sample in columns (1) and (3), the immediate association with current earnings is negative, as in the full sample, but larger in magnitude. The association with earnings growth over three years is positive and statistically significant from zero at the 5% level. Compared to the full sample, the three-year growth rate is 1.5-times larger. These effects are not present in the non-urban sample in columns (2) and (4): while retaining the same signs, both coefficients are much smaller in magnitude and statistically insignificant. As before, the coefficients of the out-migration variable are statistically insignificant. None of the other control variables seem to interact with the urban area indicator. The female earnings penalty is larger in urban areas, while those in routine occupations experience higher earnings growth in urban areas. Otherwise, most coefficients are remarkably similar in magnitude and significance levels.
Table 3. Regression results for urban and non-urban areas.
5. DISCUSSION
The empirical findings provide some evidence for the hypotheses set out in Section 2. For hypothesis 1, I find that in the short-run, an increase in labour supply puts downward pressure on wages, consistent with the negative coefficient of in-migration. However, over the longer run, internal migrants contribute to productivity growth, and earnings increase again. The positive coefficient of in-migration on three-year earnings growth provides evidence for this effect. There is however only partial evidence for hypothesis 2, as there are no corresponding effects from out-migration. In line with hypothesis 3, the results suggest that urbanisation mediates the effect of migration on local earnings, as the significant coefficients are driven by effects in urban areas. In non-urban areas, internal migration does not significantly affect wages either in the short- or medium-term.
The effects are small but economically meaningful: The average share of in-migrants in a given year and TTWA is 7% in the preferred specification in , is associated with an immediate drop in wages of 0.77% in urban areas. Over the following three years, it is associated with in wage growth of 0.53 percentage points. This compares to 3-year earnings growth of 5% over the observation period.
This raises the question as to the channels by which in-migration leads to faster wage growth in urban areas. Given the selective nature of migration, in-migration may raise the overall skill level in an area, and increase productivity through spillover effects, such as knowledge sharing. Alternatively, an increase in population might simply contribute to agglomeration economies. Lastly, higher wages may be a response to higher living costs in response to a larger population. The asymmetrical effects of in- and out-migration provide some evidence in favour of the first channel. Incoming internal migrants bring new knowledge and experience from their previous place of work that they can share with their new colleagues, supporting productivity growth. This new knowledge then stays in the area. These processes may be more effective in urban labour markets that facilitate interactions.
Endogeneity concerns warrant caution in interpreting the results as causal effects rather than correlations. Both internal in- and out-migration and local earnings growth might be driven by other underlying factors, for example, the opening of new businesses or plants in the area, or conversely the closure of businesses and loss of jobs. Internal migrants may respond to pull-factors, such as foreign direct investment (Celi & Sica, Citation2023). Furthermore, internal migration may be correlated with other shocks to the labour force, e.g., a change in participation or immigration from abroad. However, while short distance moves have been generally regarded as motivated by housing, and long-distance moves by employment, this is not entirely accurate, with a lot of variation in migration motives across socio-economic groups (Niedomysl, Citation2011). The changing effects observed over time provide some reassurance that the coefficients are not driven by unobserved variables. If in-migration was primarily driven by underlying wage growth, the contemporaneous correlation with earnings would be expected to be positive. However, the opposite is true, suggesting that areas receiving many internal migrants do not experience general wage growth at the same time.
A related issue concerns the scope of the dataset, not capturing employees below the income tax threshold. As earnings increase, more people will be attracted into employment, and more employees will pass the income tax threshold, changing the composition of the sample. It is difficult to say how this affects the results. Over the study period, the income tax threshold has increased substantially, both in cash terms and relative to average earnings. However, the share of the adult population paying any income tax, while also varying over time, has not moved in tandem with the threshold.
The analysis is conducted at the level of functional labour markets, in the UK generally operationalised as TTWAs (e.g., D’Costa & Overman, Citation2014). However, it is a statistical concept and is not mirrored by any institutions that could set policy at this scale. In general, subnational government is very limited in the UK, with hardly any revenue raising powers. Housing policy is implemented at the municipality level, a scale smaller than the TTWAs, while some functions of industrial policy such as business promotion happen at the metropolitan or regional level, e.g., through local enterprise partnerships. However, wages are set in local labour markets, which is the outcome of interest in this paper, and the results can provide insights for national government to influence labour mobility.
6. CONCLUSIONS
The paper contributes to the literature on regional development and regional disparities by highlighting the importance of labour mobility. The results suggest that internal migration does affect earnings of non-migrants in the region. However, these effects are isolated in urban areas and only driven by in-migrants. In the medium term, in-migration is associated with regional income growth. This provides some evidence that policy makers can encourage migration, in particular to urban areas, to stimulate growth. These results are also significant in context with other local development policies. Local economic development often creates jobs that are filled by internal migrants that did not previously live in the area (Bartik, Citation1993). This may create the impression that these policies do not actually benefit the target population. However, the results here suggest local populations benefit through spillover effects.
However, there are also significant adjustment costs. In-migration is correlated with an immediate decline in earnings. This is on top of pressures on housing, infrastructure and local services. Indeed, in the UK and many other high-income countries high housing costs in urban areas present a significant barrier to mobility. This suggests that alleviating these adjustment costs presents a possible policy lever to reap the benefits of mobility over the longer term.
Unfortunately, the results do not provide perspectives for non-urban areas, many of which are among the most deprived in the UK, as neither in- nor out-migration has a significant impact on earnings there. The findings suggest that encouraging in-migration does not provide growth opportunities for these areas. Future research should consider why this is the case. Opportunities to interact and learn from new arrivals may be limited in less non-urban areas. For these regions, the absence of a negative effect of out-migration is encouraging, but it is likely that in the limit negative effects do materialise, as more and more people leave an area. Negative effects of depopulation extend beyond the labour market and need to be carefully managed. To evaluate the welfare effects more conclusively, future research could distinguish between (initially) high- and low-income areas to test whether the effects differ. In the vein of the ‘virtuous cycles’ identified by (Mitze & Schmidt, Citation2015), positive effects may be more pronounced in already prosperous areas.
Further research should also consider the impacts on labour supply. As wages rise over time in response to in-migration, it would be expected that labour supply also increases, through people joining the labour force, switching from part-time to full-time work or otherwise increasing their hours worked. Unfortunately, the present dataset is not suited to answer these questions, as the cut off at the income tax threshold makes it impossible to know whether a new entrant in the survey was previously not employed or simply earning less than the threshold.
Supplemental Material
Download PDF (47.6 KB)ACKNOWLEDGEMENTS
The author is grateful to Simona Iammarino, Michael Storper, Alessandra Faggian and Vassilis Monastiriotis, the editor and two anonymous referees for detailed comments and suggestions, as well as participants at the LSE Economic Geography Work in Progress seminars, the Global Conference in Economic Geography 2018, the Regional Studies Association Early Career Conference 2018, the Royal Geographic Society Postgraduate Forum mid-term conference 2019, the Seminars in Economic Geography 2020 and the City-REDI Research Symposium 2021.
DATA AVAILABILITY STATEMENT
This work contains statistical data from ONS which is Crown Copyright. The use of the ONS statistical data in this work does not imply the endorsement of the ONS in relation to the interpretation or analysis of the statistical data. This work uses research datasets which may not exactly reproduce National Statistics aggregates. Some of the statistical data used in this study were accessed in a secure research environment under the Digital Economy Act 2017 and cannot be made available by the author due to data protection regulations. The work was carried out in the Secure Research Service, part of the Office for National Statistics.
DISCLOSURE STATEMENT
No potential conflict of interest was reported by the author(s).
Additional information
Funding
Notes
1 It was noted during peer review that the female dummy should not have been included in the regression with individual fixed effects. The coefficient is identified from a small number of observations that are recorded as changing gender in the data. Unfortunately, due to restrictions on data access, it was not possible to update these results.
REFERENCES
- Bartik, T. J. (1993). Who benefits from local job growth: Migrants or the original residents? Regional Studies, 27(4), 297–311. https://doi.org/10.1177/089124249000400406
- Celi, G., & Sica, E. (2023). Globalization and internal migration: Evidence from inter-provincial mobility in Vietnam. Regional Studies Regional Science, 10(1), 1–19. https://doi.org/10.1080/21681376.2022.2155563
- Champion, T., & Shuttleworth, I. (2017). Is longer-distance migration slowing? An analysis of the annual records for England and Wales since the 1970s. Population, Space and Place, 23(3), 1–14. https://doi.org/10.1002/psp.2024
- D’Costa, S., & Overman, H. G. (2014). The urban wage growth premium: Sorting or learning? Regional Science and Urban Economics, 48, 168–179. https://doi.org/10.1016/j.regsciurbeco.2014.06.006
- De la Roca, J., & Puga, D. (2017). Learning by working in big cities. The Review of Economic Studies, 84(1), 106–142. https://doi.org/10.1093/restud/rdw031
- Diodato, D., Morrison, A., & Petralia, S. (2021). Migration and invention in the age of mass migration. Journal of Economic Geography, 22(2), 477–498. https://doi.org/10.1093/jeg/lbab032
- Duranton, G., & Monastiriotis, V. (2002). Mind the gaps: The evolution of regional earnings inequalities in the UK, 1982–1997. Journal of Regional Science, 42(2), 219–256. https://doi.org/10.1111/1467-9787.00257
- Eriksson, R. H. (2011). Localized spillovers and knowledge flows: How does proximity influence the performance of plants? Economic Geography, 87(2), 127–152. https://doi.org/10.1111/j.1944-8287.2011.01112.x
- Faggian, A., & McCann, P. (2009). Human capital, graduate migration and innovation in British regions. Cambridge Journal of Economics, 33(2), 317–333. https://doi.org/10.1093/cje/ben042
- Gibbons, S., Overman, H. G., & Pelkonen, P. (2014). Area disparities in Britain: Understanding the contribution of people vs. place through variance decompositions. Oxford Bulleting of Economics and Statistics, 76(5), 745–763. https://doi.org/10.1111/obes.12043
- González-Leonardo, M., López-Gay, A., & Esteve, A. (2022). Interregional migration of human capital in Spain. Regional Studies, Regional Science, 9(1), 324–342. https://doi.org/10.1080/21681376.2022.2060131
- Groot, S. P. T., de Groot, H. L. F., & Smit, M. J. (2014). Regional wage differences in the Netherlands: Micro evidence on agglomeration externalities. Journal of Regional Science, 54(3), 503–523. https://doi.org/10.1111/jors.12070
- Iammarino, S., & Marinelli, E. (2015). Education-job (mis)match and interregional migration: Italian university graduates’ transition to work. Regional Studies, 49(5), 866–882. https://doi.org/10.1080/00343404.2014.965135
- Lehmer, F., & Ludsteck, J. (2010). The returns to job mobility and inter-regional migration: Evidence from Germany. Papers in Regional Science, 90(3), 549–572. https://doi.org/10.1111/j.1747-7379.2011.00871.x
- Lucas, R. E. (1988). On the mechanics of economic development. Journal of Monetary Economics, 22(1), 3–42. https://doi.org/10.1016/0304-3932(88)90168-7
- McCann, P., & Simonen, J. (2005). Innovation, knowledge spillovers and local labour markets. Papers in Regional Science, 84(3), 466–485. https://doi.org/10.1111/j.1435-5957.2005.00036.x
- Mitze, T., & Schmidt, T. D. (2015). Internal migration, regional labor markets and the role of agglomeration economies. The Annals of Regional Science, 55(1), 61–101. https://doi.org/10.1007/s00168-015-0683-z
- Niedomysl, T. (2011). How migration motives change over migration distance: Evidence on variation across socio-economic and demographic groups. Regional Studies, 45(6), 843–855. https://doi.org/10.1080/00343401003614266
- Office for National Statistics. 2019. ONS SRS metadata catalogue, dataset. Annual Survey of Hours and Earnings - UK. https://doi.org/10.57906/x25d-4j96.
- Storper, M. (2018). Separate worlds? Explaining the current wave of regional economic polarization. Journal of Economic Geography, 18(2), 247–270. https://doi.org/10.1093/jeg/lby011
- Storper, M., & Venables, A. J. (2004). Buzz: Face-to-face contact and the urban economy. Journal of Economic Geography, 4(4), 351–370. https://doi.org/10.1093/jnlecg/lbh027