
 ?Mathematical formulae have been encoded as MathML and are displayed in this HTML version using MathJax in order to improve their display. Uncheck the box to turn MathJax off. This feature requires Javascript. Click on a formula to zoom.
ABSTRACT
Benchmarking has been deemed useful for the study of regional competitiveness and innovation and is quickly expanding. The aim of this work is the formulation and validation of a method to select the right regions to compare. The proposed method is of general application and can therefore be used by any region across the world wishing to benchmark against others in the field of competitiveness and innovation. This method is carried out in two successive stages. In the first stage, regions with higher innovation and competitiveness than the region under study are identified. In the second, a subset of regions with a resource base similar to the one under study is selected, which makes them suitable for the comparison. The method is validated by applying it to a European region. The results show the validity and robustness of the proposed method.
1. INTRODUCTION
The regional level has gradually been recognised as the most suitable for the study of innovation and competitiveness and now boasts a solid position in the world of academia and socio-economics.
When looking at national economic realities in terms of their economic development regarding innovation and competitiveness, one notes the considerable diversity and internal heterogeneity of many states. This is evident when reviewing the indicators for these variables presented in studies such as Hollanders and Es-Sadki (Citation2017), Hollanders et al. (Citation2019b) and Annoni and Dijkstra (Citation2019). These studies clearly show the appropriateness of adopting the regional scale in order to obtain more homogeneous and accurate information, thus addressing the internal heterogeneity of states as mentioned above.
Regions, or the regional scale, are seen as the locus of innovation, prompting a certain ‘rediscovery’ of the scale’s role in stimulating competitiveness in firms and the regions themselves (Doloreux & Parto, Citation2005) and enhancing their role as a space for economic and administrative activities. From this starting point, the specific characteristics (history, actors, relations, policies, etc.) of the regions have been proven to impact innovation creation (Bellmann et al., Citation2013; Beugelsdijk, Citation2007; Naz et al., Citation2015; Rodríguez-Gulías et al., Citation2020). This is mostly due to the fact that the actors who generate it are located in the region, as are their collaboration spaces and modes. Furthermore, this greatly affects the competitiveness of the regions, and hence their socio-economic development (Howells, Citation2005), which in turn impacts broader territorial areas (Cooke, Citation2008). In this respect, Beugelsdijk et al. (Citation2018) study the level of economic development across EU regions and point out large regional differences both between and within countries and that the interregional diffusion of technology and efficient production practices is limited.
Hence, analysis of regional competitiveness and innovation is becoming increasingly relevant. Benchmarking the different variables and processes developed in the regions is one technique that has proven useful in this respect and has become more and more widespread. Indeed, a comparison between entities with a similar nature or objectives, although they perform differently, has been used systematically for improvement and learning. The methodologies under the generic term of benchmarking that address this comparative usage have been applied to private entities, public institutions, and even countries, in addition to regions, as we have mentioned.
However, application of the technique calls for certain execution criteria and caution. Each benchmarking process addresses specific objectives that significantly determine the execution modes and criteria. For this reason, one of the questions that must be answered before undertaking analysis of regional competitiveness and innovation as the base for later benchmarking is: With whom should the comparison dynamic be established? The right choice of entities for comparison, grounded on reasonable objective bases, is key to achieving the desired outcomes.
Accordingly, the aim of this paper is to present and validate a method which has been elaborated with objective criteria by the research team. The focus is on selecting regions suitable for comparison of competitiveness and innovation-related scopes with a region under study. The method is of general application and can therefore be used by any region wishing to benchmark against others in the field of competitiveness and innovation. For that purpose, following this introduction, the second section presents the conceptual framework of the study; the third develops the proposed method and the fourth describes the validation of said method through its application to a European region, namely the Basque Country. The study closes with a presentation of the main conclusions, followed by the references.
2. CONCEPTUAL FRAMEWORK
As stated above, the regional scale has been recognised as the most suitable scope for innovation and competitiveness analysis. It therefore seems appropriate to clarify what is understood by the two terms in this context. Moreover, the relevance of these two aspects makes them fitting for benchmarking practices. The way in which this technique is applied in territories in general, and in regions in particular, should therefore be carefully examined. Suitable regional benchmarking in the competitiveness and innovation scope should establish what types of regions should be used for comparison with the region under study. We suggest that the comparison be made with regions that are ‘superior’, but which have a similar resource base. Otherwise, this superiority may be due to non-reproducible factors which cannot be achieved in the region under study. These concepts are clarified below.
Beginning with regional competitiveness, the OECD (Citation2019, p. 1) provides a clear definition: ‘A competitive region is one that can attract and maintain successful firms and maintain or increase standards of living for the region’s inhabitants. Skilled labour and investment gravitate away from “uncompetitive” regions towards more competitive ones’. Regional competitiveness therefore lies in the capacity to attract promising firms on the one hand, and to improve its inhabitants’ standard of living on the other. If we designed an ‘economic progress map’ or ‘competitiveness map’, we would find a very unequal territorial distribution with strong differences between some regions and others, and even between those located in the same country or any other chosen geographic space. The European case clearly illustrates this (Annoni et al., Citation2017; Annoni & Dijkstra, Citation2019; Calleja Crespo & Herbert, Citation2014; Odendahl et al., Citation2019).
Innovation capacity is one of the main pillars of a region’s competitiveness (Huber et al., Citation2003). There is a close connection between regional innovation and competitiveness (Hollanders & Es-Sadki, Citation2017); and the higher a region’s wealth and development, the stronger the connection (Annoni et al., Citation2017; Annoni & Dijkstra, Citation2019; Hollanders & Es-Sadki, Citation2017; Howells, Citation2005). However, these concepts are not exactly the same. In fact, there are regions in which the two processes do not occur simultaneously or do not reach the same level of excellence.
Innovation has been explained in different ways and the definition formulated in the Oslo Manual (OECD/ Eurostat, Citation2018, p. 20) is widely accepted: ‘An innovation is a new or improved product or process (or combination thereof) that differs significantly from the unit’s previous products or processes and that has been made available to potential users (product) or brought into use by the unit (process)’. Nevertheless, we have not found any definition that expressly refers to the concept of ‘regional innovation’. It could be stated that regions have innovation features which are determined by the innovation carried out by firms, organisations and institutions established in them. In this respect, the innovation capacity of a region would be determined by the links between public and private entities within it as this would promote an environment conducive to innovation development. Similarly, Torre (Citation2023) points out that the two main determinants of regional innovation are its productive structure and its territorial governance. The current impetus of innovation and territorial development ‘monitoring’ methodologies as a new management strategy is particularly remarkable and is linked to specialisation strategies (RIS3) in Europe (Kleibrink et al., Citation2016). This point leads us to the concept of ‘Regional Innovation System’ (Asheim et al., Citation2011; Cooke, Citation2008; Cooke et al., Citation1997). Regional innovation system characteristics typically include the development of cooperative innovation initiatives between entities that create and disseminate knowledge, technology transfer agencies, ‘Research and Technology Organizations’ (RTOs) and public administration, all of which are based on a shared culture of innovation which allows firms and innovation systems to move forward together. Hence, it could be said that a region’s innovation capacity depends on the strength of its regional innovation system.
It should be noted that the exclusive focus on innovation as a competitiveness and economic growth driver is being enlarged towards a new approach, also directing attention to the challenges of society (mission-oriented policies). Innovation capacity in the regional scope is therefore seen as a broader concept in which social commitment and transformational change play an important role (Schot & Steinmueller, Citation2018). Kemeny et al. (Citation2022) delve into the impact of disruptive innovations on territorial inequality and show greater concern for social issues in the analysis of competitiveness and innovation. This new approach reaches a high level of sophistication in the studies measuring the alignment between regions’ levels of innovation development and their societal challenges by applying a composite index (RE-SCORE) (Cappellano et al., Citation2021). It has clearly influenced the understanding of the regional innovation system concept. In any event, the differences between regions’ innovative capabilities are evident, which also occurs in the field of competitiveness (Hollanders et al., Citation2016; Hollanders et al., Citation2019b; Hollanders & Es-Sadki, Citation2017; Kijek & Matras-Bolibok, Citation2018).
Although regional innovation and competitiveness are different, the two are closely linked and both are associated with the socio-economic development of regions. This process can be benchmarked by considering the two aspects. Benchmarking consists of learning and improvement experiences which may be useful in certain territorial scopes, including the regional one, to find suitable references for policy proposals (Huggins & Izushi, Citation2009). In this sense, regional innovation agencies are required to monitor innovative and competitive regions and identify potential improvements to be introduced in their own innovation system (Morisson & Doussineau, Citation2019). There are well known research works or comparative studies on competitiveness (Altomonte & Békés, Citation2016; Annoni et al., Citation2017; Annoni & Dijkstra, Citation2019; Schwab, Citation2019; Schwab & Zahidi, Citation2020), innovation (Hollanders et al., Citation2019a, Citation2019b; Hollanders & Es-Sadki, Citation2017) or education (OECD, Citation2016). Such studies are normally based on broad statistical analysis.
There are various approaches to benchmarking. However, as Groenendijk (Citation2011) points out, the different types are determined by the desired objectives. The execution mode and criteria must be aligned with the objectives. There is no point comparing regional competitiveness and innovation in the region under study with others whose superiority is based on conditions and factors that it can never achieve. A ‘comparability principle filter’ (Papaioannou et al., Citation2006) is therefore needed: benchmarking is only plausible between comparable regions. In this regard, the comparability principle that we propose in this paper is a similarity between the set of resources and capabilities in the regions. In other words, they must have similar resource bases.
To further explore the concept, it is useful to take a closer look at the ‘resource-based view’ (Barney, Citation2001; Barney et al., Citation2011; Hoopes et al., Citation2003; Wernerfelt, Citation1984), which was reflected in the discipline of strategic management. Said approach postulates that the creation of sustained competitive advantages in organisations is due to their having their own specific endowment and combination of resources which enables them to surpass the average performance of their competitors. These resources may be tangible – material, human, financial – or intangible – knowledge, technology, experience, R + D, organisational culture, etc. A resource is considered ‘strategic’, i.e., it significantly contributes to the competitive capacity of the organisation, if, according to Amit and Schoemaker (Citation1993), it is scarce, valuable, non-transferable, inimitable and irreplaceable. Over time, García-Merino et al. (Citation2014) added durability to the above characteristics.
Although this approach originated to explain the individual competitive capacity of organisations, it can also be applied to groups of organisations, provided that they share ‘resource bases’ that can be considered sources of collective advantages. For this reason, we believe that this approach can also be extended to the territorial scope to explain the competitive capacity of regions. Indeed, the competitiveness of regions with similar resource bases, whether they are tangible or intangible, may differ precisely because of the different capabilities they have developed to combine these resources. Among these capabilities, we must consider identifying and overcoming the tensions and strategic misalignments that generally appear between the different agents involved in the development of a region (Nieth, Citation2019). Nevertheless, the literature on regional ‘resource bases’ has largely focused on the natural resources that a region or territory possesses (Gunton, Citation2003; Tan et al., Citation2017). However, some studies embrace a broader concept in this regard. Harmaakorpi (Citation2006) developed the ‘regional development platform’ concept which links a region’s ability to develop innovation and competitive capabilities based on its available resources. Similarly, the International Labour Organization includes competences, human resources, organisation of business, raw materials and local elements in ‘regional resource bases’ (International Labour Organization, Citation2010). Alonso and Kok (Citation2018), for their part, pointed out the need to further develop other types of resources and local capabilities, namely, knowledge, competences, human resources, education at all levels, R + D, industrial organisation, etc. Additionally, the positive impact of regional resources, such as inhabitants’ level of training, investment in research and development (R&D) or innovative activities on firms’ innovation results, have already been evidenced (Bellmann et al., Citation2013; Naz et al., Citation2015; Rodríguez-Gulías et al., Citation2020; Tojeiro-Rivero & Moreno, Citation2019).
Based on the above considerations and taking into account the research aim of this study, the ‘regional resource base’ we focus on is the set of resources that a certain region possesses, and which can be considered essential for the development of competitiveness and innovation therein. For this reason, when examining the regions’ endowments of these valuable, non-transferable, practically inimitable, non-replaceable and somewhat durable resources, the following should be noted as important elements of said ‘resource bases’:
| - | Geographic characteristics: physical resources, such as the extent or degree of urban development. | ||||
| - | Demographic characteristics: human resources, from both the quantitative (amount), as well as qualitative (training level) perspectives. | ||||
| - | Economic structure and resources: namely, the GDP per capita or sectorial distribution of the economy. | ||||
| - | Commitment to innovative economic development: public and private investment in R&D, development of high or very advanced technology activities. | ||||
| - | Cohesion or equitable distribution of wealth. | ||||
With this conceptual baggage, we go on to present the proposed method in the next section.
3 . METHOD FOR SELECTION OF REFERENCE REGIONS
3.1. General approach
The method proposed is based on a process carried out in two successive and cumulative stages of region selection and classification. The first stage is applied to the entire ‘region population’ of the study while the second is only applied to the group of regions selected during the first stage. shows the process in a schematic diagram.
Figure 1. Selection methodology of suitable regions for competitiveness and innovation benchmarking.
Source: own work.
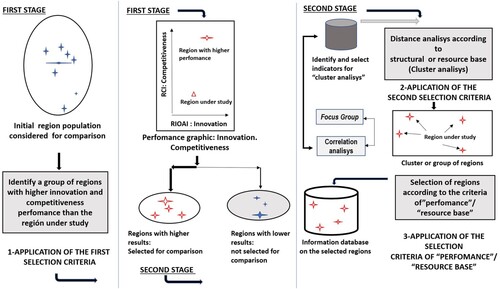
As can be observed from the figure, the following logic is applied:
The innovation and competitiveness data of all the regions considered for the comparison are analysed in the first stage. A group is identified whose simultaneous performance in these two areas is higher than the region under study.
Starting with the group of regions selected in the first stage, the following stage then focuses on identification of a group of regions that possess a ‘resource base’ (a set of resources essential to the development of regional competitiveness and innovation) similar to the one under study. For this purpose, an active selection of a set of resource base indicators is performed. This active selection of indicators involves three stages. Firstly, the research team must identify them and secondly, they must be submitted to a focus group formed by regional development experts who will validate and classify the proposed indicators (Appendix 1 in the online supplemental data). Thirdly, a correlation analysis will be run in order to eliminate redundant information between them and take the prioritisations set by the focus group into account, which will give the final indicator scoreboard. The regions identified in the first stage are later divided into groups by applying cluster analysis based on the selected indicator scoreboard. ‘Resource base’ ‘proximity’ to the region under study is the criteria for grouping. This technique will yield a selection of regions that surpass the region under study in competitiveness and innovation (first stage) and show a certain similarity to it in ‘resource base’ terms (second stage), which will be evidenced by their belonging to the same cluster.
This process is explained in greater detail below.
3.2. First stage: identify a group of regions with higher competitiveness and innovation performance than the region under study
As stated above, the first stage of selection aims to identify those regions that simultaneously show higher competitiveness and innovation data than the region under study. However, information on indicators that measure these two characteristics is needed for this task. The aspects related to measuring competitiveness and innovation in territorial spaces, and particularly in the regional scope, are examined more closely for this reason.
Measurement of competitiveness in territorial scopes, both at the country and regional levels, has been undertaken by different organisations which have designed indicator scoreboards that yield composite competitiveness indexes or indicators. The following are considered the most relevant: World Economic Forum (WEF) (Schwab, Citation2019; Schwab & Zahidi, Citation2020) and the European Union’s (EU) (Annoni et al., Citation2017; Annoni & Dijkstra, Citation2019; Calleja Crespo & Herbert, Citation2014). These institutions have taken an international approach, and the first has extended their applications to economies across the world while the second has focused on European Union member countries. Both indicators were developed within the same framework, that of the WEF. Any of the above composite competitiveness indicators, or indexes, could be used with the method proposed in this paper. Nevertheless, as can be observed, for the European scope, we chose the regional competitiveness index (RCI) presented in the work by Annoni and Dijkstra (Citation2019). The RCI includes 74 basic indicators which are grouped into 11 pillars which, in turn, are organised into three sub-indexes: basic, efficiency and innovation factors of competitiveness.
The pillars that make up each sub-index are as follows:
| - | Basic: institutions, macroeconomic stability, infrastructures, health and basic education. | ||||
| - | Efficiency: higher education, training and lifelong learning, labour market efficiency and market size. | ||||
| - | Innovation: technological readiness, business sophistication and innovation. | ||||
To calculate the value of the RCI, a different weighting is applied to each of the sub-indexes, depending on the level of income (GDP/per capita; PPS) of the region for which the calculation is made.
Different publications provide information on innovation indicators for measurement in territorial scopes, and particularly at the regional level, which is relevant and suitable for our purpose. The following are seen as references at the European level: The European Innovation Scoreboard and The Regional Innovation Scoreboard. The first focuses on countries (Hollanders et al., Citation2019a; Hollanders et al., Citation2020) while the second refers to regions (Hollanders et al., Citation2019b). Review of the indicators proposed in the above reports indicates that they could be divided into four types: (i) framework conditions, (ii) investments, (iii) innovations activities and (iv) impacts. Although some points could be qualified, we believe that the indicators grouped under investments correspond to inputs into each region’s innovation system, resulting from public and private decisions and strategies in this field. Hence, we consider the rest of the indicators as outputs or innovation system results, some of which are intermediate outputs, in other words, they are results of innovation processes, which in turn contribute to promoting territorial innovation. Consequently, in order to identify the regions with outstanding innovation results (intermediate or final), our proposal is to exclude the investment indicators as they are considered to be inputs. When selecting the regions, it is important to set selection criteria based on innovation outputs, as we have mentioned, and not on the intentions or decisions of the different regional, public or private governance systems.
Thus, in order to obtain a composite innovation indicator, we will take the regional innovation output average index (RIOAI) for each region as the weighted mean of the normalised values of the innovation indicators selected. The normalisation procedure of the indicators is detailed in the Regional Innovation Scoreboard 2019, Methodology Report (Hollanders et al., Citation2019c, p. 20).
The procedure consists of first transforming the data using a square root transformation if the degree of asymmetry of the data exceeds a value of 1, and then normalising the data using the ‘MIX-MAX’ procedure.
The mathematical formula is:
(1)
(1) Where NIIn (‘normalised innovation indicator’) is the normalised value of the innovation indicator n, Wn is the weight assigned to said indicator and N the total number of indicators taken into account.
However, assigning weights to the indicators may prove difficult. We therefore chose to assign equal weight to all the indicators so as to obtain the arithmetic mean of the values:
(2)
(2) The use of information sources on regional competitiveness and innovation indexes such as the abovementioned ones, as well as the formula to correct innovation values to obtain the RIOAI, enable us to create a two-dimensional map where each region can be placed according to its competitiveness (RCI) and innovation (RIOAI). The regions that surpass the one under study in both areas will be the ones included in the first group of selected regions.
3.3. Second stage of classification: identify similar regions according to their resource bases
The group of regions selected in the first stage may show very diverse realities in demographic, socio-economic, administrative and other aspects. Furthermore, some of them may be quite different from the region under study in terms of comparability. For this reason, a second selection stage is carried out to obtain a more suitable group for comparison. We must therefore identify the group of suitable regions from those selected in the first stage. This process will be determined by the similarity or ‘proximity’ between the regions’ ‘resource base’, understood in the terms described in the second section.
For this purpose, the ‘resource base’ indicators of said regions must be identified, which enables their characterisation. These indicators will form the application field of the cluster analysis to determine the regions which are most comparable to the one under study. In addition, we propose a prioritisation procedure in case the number of regions obtained is too large to carry out the comparison. This process is explained in greater detail below.
Firstly, a previous selection of the regional ‘resource base’ indicators used by institutions in various scopes is proposed. In our opinion, special attention should be paid to sources such as Eurostat or the OECD (Annoni & Dijkstra, Citation2019; Hollanders et al., Citation2019b; Huber et al., Citation2003; OECD, Citation2016, Citation2019). Once the previous selection has been completed, we suggest forming a focus group made up of experts in innovation, competitiveness and regional development (Appendix 1). The group’s objective would be to refine and validate the previously selected indicators and to prioritise them. These decisions would be based on the opinions of knowledgeable professionals from the fields of regional competitiveness and innovation. The following step is to run a correlation analysis between the selected indicators to further refine them, combining with the priorities set by the focus group. The desired result is a group of indicators that have been validated and at the same time are scarcely correlated so that each one represents distinctive characteristics of the regional resource bases.
As we have mentioned, to successfully carry out benchmarking it is vital to identify the regions that have a ‘resource base’ similar to the region under study. Therefore, having created the ‘resource base’ indicators scoreboard, we aim to obtain a set of regions suitable for comparison by running a cluster analysis (Hair et al., Citation2018). Quadratic Euclidean distance and Ward’s method are used for this purpose (Ward, Citation1963).
The cluster analysis must provide a cluster or group of regions with ‘resource bases’ similar to the region under study, which is included in it. However, if this is a large group, the regions included in it must be prioritised. On the one hand, this process can be performed using the best competitiveness and innovation indicator results in comparison to the region under study, and on the other, those regions showing the greatest ‘resource base’ proximity. We propose the use of quadratic Euclidean distance in two steps for this purpose.
Firstly, the distance between the region under study and each of the regions in the cluster is calculated, using normalised RCI and RIOAI values (according to Equation (2))Footnote1 as indicated in Section 3.2. The mathematical expression of this distance is:
(3)
(3) Where QEDX,R is the quadratic Euclidean distance in competitiveness and innovation from region X to R, the region under study, and RIOAI and RCI the innovation and competitiveness indexes of the mentioned regions.
The conglomerate analysis also provides the quadratic Euclidean distances calculated between each pair of regions according to their resource bases, which we call DRBX,R (‘Distance according to Resource Base’).
Two distances are therefore given, one for competitiveness and innovation and the other according to the resource base. The quotient between both distances provides a value or ratio which allows us to prioritise the regions to be selected from higher to lower within the cluster that contains the region under study.
(4)
(4) Having presented the method proposed, we show its specific application to a European region in the next section.
4. APPLICATION TO THE BASQUE COUNTRY
4.1. The Basque Country in the European scope of competitiveness and innovation
The Basque Country (NUTS2; ES21),Footnote2 located in Spain, was chosen for our study. The decision was made to apply the method to this territory, which is considered the region under study, due to a series of characteristics which make it very suitable for this purpose. These characteristics are explained below:
− It is a medium-sized region in the European Union with a population of somewhat over two million people (Eurostat, Citation2020a), which is approximately 5% of Spain’s total population.
− The area has a strong industrial tradition (24.2% of its GDP is industry), with particular emphasis on manufacturing. Most of the industrial sector is formed by small and medium-sized enterprises (SMEs).
− The Basque Country has broad legislative and tax competences as well as highly developed public policies which include science and innovation.
− The region’s income per capita measured in PPSFootnote3 ranks high; 50th among 268 European regions according to the RCI 2019 (Annoni & Dijkstra, Citation2019).
− However, it shows middle-ranking and somewhat fluctuating competitiveness and innovation indicators (Annoni et al., Citation2017; Annoni & Dijkstra, Citation2019; Hollanders et al., Citation2016; Hollanders et al., Citation2019b; Hollanders et al., Citation2020; Hollanders & Es-Sadki, Citation2017).
− In summary, this European region has a high level of income, although its future prospects are uncertain due to the recent fluctuations registered in innovation and competitiveness ratings.
As the purpose of this part of the study centres on application of the proposed selection method to identify suitable regions for comparison with the Basque Country, the decision was made to exclusively consider regions belonging to the European Union – EU.Footnote4 This geographic scope was determined due to the lack of available statistical data defined in the same way for homogenous regional scales across the world. We have based our study on the European Union NUTS geographic classification (Eurostat, Citation2015, Citation2018) to set the scope of analysis, with level NUTS2 to be used as regional scale reference.Footnote5
4.2. Application of stage 1. Classification according to innovation and competitiveness
In this first stage, the objective is to identify a group of European regions that surpass the Basque Country in the fields of competitiveness and innovation. The index provided by the ‘Regional Competitiveness Index 2019’ (Annoni & Dijkstra, Citation2019) has been used to calculate regional competitiveness. Measurement of regional innovation was based on the ‘Regional Innovation Scoreboard 2019’ (Hollanders et al., Citation2019b) elaborated by the European Union. Based on this source, and using the criteria set out in Section 3.2 which excludes the indicators that refer to innovation inputs for estimation of the RIOAI in the Basque Country according to Equation (2), we chose the 15 indicators of regional innovation results shown in .
Table 1. Indicators of innovation results according to Regional Innovation Scoreboard 2019.
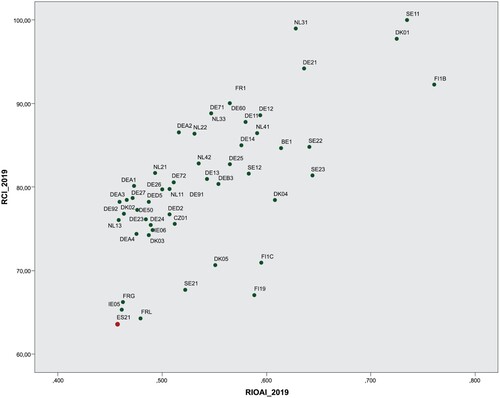
The RIOAI for 2019 in each region was obtained by applying the values of these indicators to the EU regions. In the y axis indicates the RCI competitiveness index for 2019 and the x axis indicates the aforementioned RIOAI. It contains the group of regions with competitiveness and innovation values that simultaneously surpass those reached by the Basque Country. A total of 51 regions meet the criteria.
Figure 2. Situation in European regions that surpass the Basque Country in both competitiveness and innovation.
Source: own work.
4.3. Application of stage 2
4.3.1. Selection and validation of indicators
Having identified a group of European regions that surpass the Basque Country in competitiveness and innovation, the second stage focuses on finding a group of regions with similar resource bases to the Basque Country’s in order to ensure reliable comparability. For that purpose, a representative regional resource base scoreboard must first be elaborated. As we have mentioned in Section 3.3, after having reviewed the information sources, the research team made a previous selection of 31 indicators for which data had been homogeneously elaborated at the regional level in Europe. Due to length limitations, only the final selection of indicators will be shown in this study.
As also stated in the same section, a focus group was later formed with experts who were supervised by the authors of this paper (Appendix 1). The professional profiles and expertise of the persons forming the focus group are as follow:
- Three regional development experts.
- Two regional innovation systems experts.
- Two economic and business development experts.
- Two innovation experts.
The methodology has enabled us to set a priority criterion for the 31 initially selected indicators.Footnote6 The first refinement of the indicators was then performed by running a correlation analysis between the initially selected ones. The following step consisted of deleting the indicators which were highly correlated to others and had not been prioritised by the experts. Following this refinement, the number of indicators finally selected was reduced to 17, which are shown in . The most important indicators chosen by the focus group are marked with an asterisk.
Table 2. Final selection of regional resource base indicators.
Lastly, a second correlation analysis was run on the 17 selected indicators. The results indicate that the correlations between them are low, which makes this indicator scoreboard acceptable and was thus the one chosen for use in the following stage.
4.3.2. Obtaining a group of regions with comparable resource bases: forming the clusters
A cluster analysis was then performed, according to the criteria described in Section 3.3. In addition to the Basque Country, 51 regions which were identified in the first stage have been considered as ‘individuals’, and the 17 indicators on the previously mentioned scoreboard as ‘variables’. The software SPSS Statistics (Field, Citation2017) was used for this task. As the variables are measured in different units, they had to first be ‘normalised’ (Z Score).
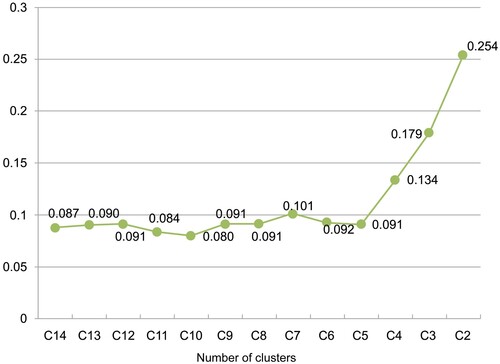
The first stage of the analysis yielded the distance matrix between pairs of regions and the agglomeration schedule.Footnote7 This schedule provides information on the entire clustering process. In this process the 52 groups or regions are reduced to form a single group and it must be decided when groups with low homogeneity are combined. This evaluation is based on the evolution and analysis of the clustering coefficient (the higher the value, the lower the homogeneity between the entities grouped together). In our case study, shows the variation rates of said coefficient, based on the creation of 14 groups or clusters. We observe that the coefficient remains relatively stable until reaching the degree on four clusters, and that the highest variation rates occur when reducing from four to three clusters (rate of 0.1335), from three to two (0.1787) and from two to one (0.2539). Therefore, the four-cluster adoption solution could be considered appropriate. Going on to a higher degree of conglomeration would mean grouping together entities with low similarity.
Figure 3. Clustering coefficient variation rates.
Source: own work.
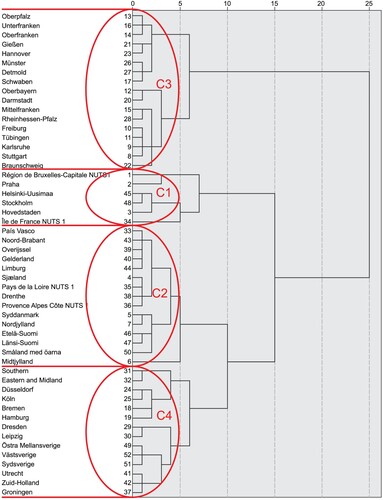
Likewise, the dendrogram analysis ()Footnote8 provides relevant qualitative information to establish the suitable number of clusters. Closer examination shows that four clusters are the most suitable level of conglomeration for our purpose. Cluster C1 contains six regions, C2 contains 15 (including the Basque Country), C3 contains 17 and C4 contains 14. C2 therefore contains the regions whose resource bases are considered to be similar to those of the Basque Country.
Figure 4. Dendrogram.
Source: own work.
4.3.3. Cluster characterisation MANOVA, ANOVA and Duncan’s tests
A multivariate analysis of variance (MANOVA) test was performed to validate the differentiation of clusters regarding the joint behaviour of the variables (indicators). shows the results.
Table 3. Cluster characterisation. Results of the MANOVA test.
When studying the table, we observe that the Wilks’ lambda value is 0.008 and the approximate F statistic associated with it is 7.627. Taking into account the p-value (0.000), we can reject the null hypothesis of equality of mean vectors. The value of partial eta squared (ηp2) is 0.799, which is close to one and indicates that the variability attributable to belonging to each of the clusters is high; in other words, the clusters are clearly different from each other. The clusters identified are therefore significantly different in reference to the seventeen resource base indicators examined jointly.
However, this cluster differentiation concerning the set of variables does not necessarily mean that they are different for each of the variables considered individually. For this reason, several analysis of variance (ANOVA) tests were run for each variable to study the individual behaviour of each indicator in the different clusters. The results showFootnote9 that the null hypothesis was rejected for 15 of the 17 indicators. They are thus individually significant to distinguish between the four clusters (significance < 0.05) and allow identification of appreciable differences in each cluster as regards the others. The population of the region (first demographic indicator in ) and the percentage of the population employed in public administration and services (fourth indicator of economic structure in )Footnote10 did not show significant differences so they have not been taken into account.
Once the significant indicators had been identified, we found it necessary to run an a posteriori multiple comparison test in order to study their behaviour in different clusters. We applied Duncan’s test for this task. The objective was to examine each variable to find significant differences between cluster pairs and examine them. shows the mean values for each of the significant indicators in each cluster and the total mean values. The table also provides the results of Duncan’s test for each cluster pair, showing only the pairs whose mean values show a significant difference.
Table 4. Cluster characterisation. Results of ANOVA and Duncan’s test.
4.3.4. Descriptive characterisation of cluster C2
As indicated above, cluster C2 contains the region under study, i.e., the Basque Country. It is therefore interesting to characterise it in comparison to the other clusters. As seen in , the results of Duncan’s test show that this cluster presents significant differences in eleven variables in comparison to C1, eight in comparison to C3 and seven in comparison to C4. This means that C1 is the most dissimilar to C2, followed by C3 and C4. On the other hand, in we observe that C1 is practically formed by ‘capital regions’. Thus, they have resource sets and capabilities that are notably different from those of the rest of the regions. Hence, given this dissimilarity, our opinion is that there is no point using C1 for comparison with C2 and we go on to focus on the comparison with the other two clusters, C3 and C4.
indicates that C2 ranks better in comparison to C3 and C4 for the following indicators:
| - | Lifelong training (for people between 25 and 64). This indicator is nearly three times higher than C3’s (significantly higher) and is 123% higher than C4’s. | ||||
| - | Collaboration between innovative SMEs, which is twice as high as C3’s value (significantly higher) and nearly 129% more than C4’s. | ||||
| - | Population at risk of poverty, with C2 showing better data than C3 (113%) and C4 (130%, significantly). | ||||
| - | Per capita GDP, creation of wealth which reaches 82% of C3’s level and 75% of C4’s, in which the latter difference is significant. | ||||
| - | Size of manufacturing firms, measured by staff, notably lower than the other two clusters, specifically 30% of C3’s value (significantly lower) and 64% of C4’s. | ||||
| - | Percentage of medium and high-tech exports, reaching 65% of C3’s value (significantly lower) and 84% of C4’s. | ||||
| - | Science and technology employment, totalling 64% of C3’s value (significantly lower) and 75% of C4’s. | ||||
| - | Public investment in R&D, slightly lower average values than the other two although significantly lower in both cases. 90% of C3’s value and 71% of C4’s. | ||||
| - | Employment in the ICTs sector is slightly lower than C3’s totalling (86%) and somewhat more dissimilar and significantly lower than C4’ (68%). | ||||
| - | SMEs’ investment in non-R&D-related innovation activities, showing 70% of C3’s value (significantly lower) and 79% of C4’s. | ||||
| - | Private investment in R&D is also significantly lower than C3’s (75%), although similar to C4’s value. | ||||
In short, C2 is a group of regions whose resource bases are comparatively characterised by strong employee training, close collaboration between SMEs and social cohesion but also by their small businesses, lower employment in science and technology and ICTs, and lower investment in R&D and other innovative activities. As a result, the percentage of technology exports is low and this may be the cause of less wealth creation. The Basque Country shares these resource base characteristics with the other cluster members, although the other regions in C2 outrank it in competitiveness and innovation. This makes them suitable regions for comparison.
4.3.5. Prioritisation of the regions in cluster C2 for benchmarking against the Basque Country
C2 is formed by fifteen regions, including the Basque Country, which would leave fourteen regions to compare it with. This number is too high for benchmarking. As a result, prioritisation of these regions was proposed, according to the criteria described in Section 3.3., specifically applying Equations (3) and (4). The results are shown in .
Table 5. Prioritisation of C2 regions according to the quotient between distance in competitiveness and innovation and resource base distance in comparison to the Basque Country.
The entire method was again applied to the 2016 data (RCI 2016, RIS 2016) (Annoni et al., Citation2017; Hollanders et al., Citation2016) and the European Union statistics from that date (Eurostat, Citation2018) to check the robustness and stability of the prioritisation. This showed that the regions of Noord-Brabant, Gelderland and Limburg in the Netherlands and the Danish region of Midtjylland also appear among the six top priority regions in 2016. We find this recurrence in the final selection and prioritisation results of the regions remarkable. It confirms the robustness of the proposed selection method and provides a sound reference for the regions to be used for benchmarking.
5. CONCLUSIONS
This study has presented a method which will enable a suitable response to the question: Which regions should ours be compared with? The aim is to address the need for improvement in competitiveness and innovation in a region under study through comparison with other regions which show a higher performance for competitiveness and innovation but have similar resource bases. The proposed method is based on objective criteria and makes use of quantitative information from statistics databases, which facilitates bias minimisation in the selection of regions for comparison. The method is structured sequentially and provides an active selection of indicators integrating qualitative analysis. It is general in nature and is therefore applicable to any region across the world that wishes to benchmark against others in the field of competitiveness and innovation.
The application of this method to a specific European region engaged in competitiveness and innovation dynamics, the Basque Country, enables us to confirm that it yields satisfactory results. This is supported by the number of suitable regions selected and prioritised, identifying enough more advanced regions in innovation and competitiveness but which also show ‘resource base’ similarities to the Basque Country, making them appropriate for comparison and learning. Furthermore, repetition of the method with previous data has made it possible to show its robustness to time variability. In the cluster analysis stage of the application, it is also remarkable how in-depth observation of the cluster formation process proved to be extremely interesting. It provided both qualitative and quantitative information on resource base similarities and differences between groups of European regions.
Once the most suitable regions for comparison have been chosen, different kinds of realistic benchmarking may be carried out, provided that it focuses on the fields of competitiveness and innovation: public policy, types of agents, links with other territorial levels (city, country) and also the regional innovation systems themselves.
As a result, and according to the application of the method presented in this work, the regions indicated in would be those prioritised for the implementation of a benchmarking process against the Basque Country for innovation and competitiveness, such as its regional innovation system.
The specific application of this method calls for completely updated statistical information which has been elaborated according to regional disaggregation criteria. This aspect may limit the use of the method and require finding solutions in order to apply it.
Supplemental Material
Download PDF (514.8 KB)DATA AVAILABILITY STATEMENT
The data that support the findings of this study are openly available.
DISCLOSURE STATEMENT
No potential conflict of interest was reported by the author(s).
Additional information
Funding
Notes
1 The RIOAI values are normalised to a 0–1 range. The RCI values range from 0 to 100 and are normalised by dividing them by the maximum value of the indicator, which yields values from 0 to 1.
2 The acronym indicates that the Basque Country is in the NUTS2 disaggregation category of European regions and ranks 1st among the units listed in Spain.
3 Per capita income is expressed in purchasing power standards (PPS) to allow meaningful comparisons.
4 EU 28, including the United Kingdom.
5 Several French regions and one Belgian region have matching NUTS 1 and 2 levels and are included in the selection process. They are identified as NUTS1 in .
6 Due to length limitations, the complete process carried out by the focus group has not been included in this paper. The full text is available upon request.
7 The correlation analysis between indicators, the distance matrix and the agglomeration schedule are available upon request.
8 The diagram shows as NUTS1 those regions where NUTS1 and NUTS2 levels match.
9 The ANOVA results for each of the variables are available upon request.
10 It should be noted that neither of these two indicators was prioritised by the focus group, which confirms that they are not relevant to discriminate between the different regions’ resource bases.
REFERENCES
- Alonso, A. D., & Kok, S. K. (2018). A resource-based view and dynamic capabilities approach in the context of a region’s international attractiveness: The recent case of western Australia. Local Economy, 33(3), 307–328. https://doi.org/10.1177/0269094218765167
- Altomonte, C., & Békés, G. (2016). Measuring competitiveness in Europe: Resource allocation, granularity and trade. Bruegel Blueprint Series, 24. Bruegel. https://www.bruegel.org/wp-content/uploads/2016/01/Blueprint-XXIV.pdf.
- Amit, R., & Schoemaker, P. (1993). Strategic assets and organizational rent. Strategic Management Journal, 14(1), 33–46. https://doi.org/10.1002/smj.4250140105
- Annoni, P., & Dijkstra, L. (2019). The EU regional competitiveness index 2019. Publications Office of the European Union. https://doi.org/10.2776/046835.
- Annoni, P., Dijkstra, L., & Gargano, N. (2017). The EU regional competitiveness index 2016. European Union. https://doi.org/10.2776/94425.
- Asheim, B., Smith, H., & Oughton, C. (2011). Regional innovation systems: Theory, empirics and policy. Regional Studies, 45(7), 875–891. https://doi.org/10.1080/00343404.2011.596701
- Barney, J. B. (2001). Resource-Based theories of competitive advantage: A ten year retrospective on the resource-based view. Journal of Management, 27(6), 643–650. https://doi.org/10.1177/014920630102700602
- Barney, J. B., Ketchen, D. J., & Wright, M. (2011). The future of resource-based theory: Revitalization or decline. Journal of Management, 37(5), 1299–1315. https://doi.org/10.1177/0149206310391805
- Bellmann, L., Crimmann, A., Evers, K., & Hujer, R. (2013). Regional determinants of establishments’ innovation activities: A multi-level approach. Working paper, IZA discussion papers, 7572, Institute for the Study of Labor, Bonn, Germany.
- Beugelsdijk, S. (2007). The regional environment and a firm’s innovative performance. A plea for a multi-level interactionist approach. Economic Geography, 83(2), 181–199. https://doi.org/10.1111/j.1944-8287.2007.tb00342.x
- Beugelsdijk, S., Klasing, M. J., & Milionis, P. (2018). Regional economic development in Europe: The role of total factor productivity. Regional Studies, 52(4), 461–476. https://doi.org/10.1080/00343404.2017.1334118
- Calleja Crespo, D., & Herbert, D. (2014). European competitiveness report 2014. Helping firms grow. European Union.
- Cappellano, F., Makkonen, T., Dotti, N. F., Morisson, A., & Rizzo, A. (2021). Where innovation meets directionality: An index to measure regional readiness to deal with societal challenges. European Planning Studies. https://doi.org/10.1080/09654313.2021.1976114.
- Cooke, P. (2008). Regional innovation systems: Origin of the species. International Journal of Technological Learning, Innovation and Development, 1(3), 393–409. https://doi.org/10.1504/IJTLID.2008.019980
- Cooke, P., Gómez Uranga, M. G., & Etxebarria, G. (1997). Regional innovation systems: Institutional and organisational dimensions. Research Policy, 26(4–5), 475–491. https://doi.org/10.1016/S0048-7333(97)00025-5
- Doloreux, D., & Parto, S. (2005). Regional innovation systems: Current discourse and unresolved issues. Technology in Society, 27(2), 133–153. https://doi.org/10.1016/j.techsoc.2005.01.002
- Eurostat. (2015). Regions in the European Union. Nomenclature of territorial units for statistics - NUTS 2013/ EU 28. Publications Office of the European Union.
- Eurostat. (2018). Regions in the European Union. Nomenclature of territorial units for statistics - NUTS 2016/EU-28. Publications Office of the European Union.
- Eurostat. (2020a). Database. https://ec.europa.eu/eurostat/data/database.
- Eurostat. (2020b). Database. https://ec.europa.eu/eurostat/statistics-explained/index.php?title = Education_and_training_statistics_at_regional_level.
- Field, A. (2017). Discovering statistics using IBM SPSS statistics. Sage Publications.
- García-Merino, J. D., García-Zambrano, L., & Rodríguez-Castellanos, A. (2014). Impact of relational capital on the business value. Journal of Information and Knowledge Management, 13(1), 1450002-1–1450002-8. https://doi.org/10.1142/S0219649214500026.
- Groenendijk, N. (2011). EU and OECD benchmarking and peer review compared. In F. Laursen (Ed.), The EU and federalism. Polities and policies compared (pp. 181–202). Ashgate.
- Gunton, T. (2003). Natural resources and regional development: An assessment of dependency and comparative advantage paradigms. Economic Geography, 79(1), 67–94. https://doi.org/10.1111/j.1944-8287.2003.tb00202.x
- Hair, J., Black, W., Anderson, R., & Babin, B. (2018). Multivariate data analysis (8th ed.). Cengage Learning EMEA.
- Harmaakorpi, V. (2006). Regional development platform method (RDPM) as a tool for regional innovation policy. European Planning Studies, 14(8), 1085–1104. https://doi.org/10.1080/09654310600852399
- Hollanders, H., & Es-Sadki, N. (2017). Regional innovation scoreboard 2017. European Union. https://doi.org/10.2873/593800.
- Hollanders, H., Es-Sadki, N., & Kanerva, M. (2016). Regional innovation scoreboard 2016. European Union.
- Hollanders, H., Es-Sadki, N., & Merkelbach, I. (2019a). European innovation scoreboard 2019. Publications Office of the European Union. https://doi.org/10.2873/877069.
- Hollanders, H., Es-Sadki, N., & Merkelbach, I. (2019b). Regional innovation scoreboard 2019. Publications Office of the European Union.
- Hollanders, H., Es-Sadki, N., & Merkelbach, I. (2019c). Regional innovation scoreboard 2019 methodology report. Publications Office of the European Union.
- Hollanders, H., Es-Sadki, N., Merkelbach, I., & Khalilova, A. (2020). EIS 2020 main report. Publications Office of the European Union. https://doi.org/10.2873/6063.ET-AY-20-002-EN-N.
- Hoopes, D. G., Madsen, T. L., & Walker, G. (2003). ‘Guest editors’ introduction to the special issue: Why is there a resource-based view? Toward a theory of competitive heterogeneity. Strategic Management Journal, 24(Special Issue), 889–902. https://doi.org/10.1002/smj.356
- Howells, J. (2005). Innovation and regional economic development: A matter of perspective? Research Policy, 34(8), 1220–1234. https://doi.org/10.1016/j.respol.2005.03.014
- Huber, P., Fritz, O., & Gács, V. (2003). A study on the factors of regional competitiveness. Cambridge Econometrics.
- Huggins, R., & Izushi, H. (2009). Regional benchmarking in a global context: Knowledge, competitiveness, and economic development. Economic Development Quarterly, 23(4), 275–293. https://doi.org/10.1177/0891242409347896
- International Labour Organization. (2010). Local resource-based approaches for infrastructure investment.
- Kemeny, T., Petralia, S., & Storper, M. (2022). Disruptive innovation and spatial inequality. Regional Studies. https://doi.org/10.1080/00343404.2022.2076824.
- Kijek, T., & Matras-Bolibok, A. (2018). Innovativeness of European regional space: Convergence or divergence? Acta Scientiarum Polonorum. Oeconomia, 17(1), 59–65. https://doi.org/10.22630/ASPE.2018.17.1.7
- Kleibrink, A., Gianelle, C., & Doussineau, M. (2016). Monitoring innovation and territorial development in Europe: Emergent strategic management. European Planning Studies, 24(8), 1438–1458. https://doi.org/10.1080/09654313.2016.1181717
- Morisson, A., & Doussineau, M. (2019). Regional innovation gobernance and place-based policies: Design, implementation, and implications. Regional Studies, Regional Science, 6(1), 101–116. https://doi.org/10.1080/21681376.2019.1578257
- Naz, A., Niebuhr, A., & Peters, J. C. (2015). What’s behind the disparities in firm innovation rates across regions? Evidence on composition and context effects. Annals of Regional Science, 55(1), 131–156. https://doi.org/10.1007/s00168-015-0694-9
- Nieth, L. (2019). Understanding the strategic “black hole” in regional innovation coalitions: Reflections from the twente region, eastern Netherlands. Regional Studies, Regional Science, 6(1), 203–216. https://doi.org/10.1080/21681376.2019.1578259
- Odendahl, C., Springford, J., Johnson, S., & Murray, J. (2019). The big European sort? The diverging fortunes of Europe’s regions. Centre for European Reform, May. https://www.cer.eu/publications/archive/policy-brief/2019/big-european-sort-diverging-fortunes-europes-regions.
- OECD. (2016). L'excellence e l'équité dans l'éducation. Résultats du PISA 2015 (volume I). Éditions OCDE. https://doi.org/10.1787/9789264305199-fr.
- OECD. (2019). Regional competitiveness. Paris, OECD. http://www.oecd.org/cfe/regional-policy/regionalcompetitiveness.htm.
- OECD/ Eurostat. (2018). Oslo manual 2018: Guidelines for collecting, reporting and using data on innovation, 4th edition, the measurement of scientific, technological and innovation activities. OECD Publishing / Eurostat. https://doi.org/10.1787/9789264304604-en.
- Papaioannou, T., Rush, H., & Bessant, J. (2006). Benchmarking as a policy-making tool: From the private to the public sector. Science & Public Policy, 33(2), 91–102. https://doi.org/10.3152/147154306781779091
- Rodríguez-Gulías, M. J., Rodeiro-Pazos, D., Fernández-López, S., & Nogueira-Moreiras, M. A. (2020). The effect of regional resources on innovation: A firm-centered approach. The Journal of Technology Transfer, 46(3), 760–791. https://doi.org/10.1007/s10961-020-09811-8
- Schot, J., & Steinmueller, W. (2018). Three frames for innovation policy: R&D, systems of innovation and transformative change. Research Policy, 47(9), 1554–1567. https://doi.org/10.1016/j.respol.2018.08.011
- Schwab, K. (2019). The global competitiveness report 2019. World Economic Forum.
- Schwab, K., & Zahidi, S. (2020). The global competitiveness report. How countries are performing on the road to recovery. World Economic Forum.
- Tan, J., Lo, K., Qiu, F., Liu, W., Li, J., & Zhang, P. (2017). Regional economic resilience: Resistance and recoverability of resource-based cities during economic Crises in Northeast China. Sustainability, 9(12), 2136. 1–15. https://doi.org/10.3390/su9122136
- Tojeiro-Rivero, D., & Moreno, R. (2019). Technological cooperation, R&D outsourcing, and innovation performance at the firm level: The role of the regional context. Research Policy, 48(7), 1798–1808. https://doi.org/10.1016/j.respol.2019.04.006
- Torre, A. (2023). Contribution to the theory of territorial development: A territorial innovations approach. Regional Studies. https://doi.org/10.1080/00343404.2023.2193218.
- Ward, J. H. (1963). Hierarchical grouping to optimize and objective function. Journal of the American Statistical Association, 58(301), 263–244. https://doi.org/10.2307/2282981
- Wernerfelt, B. (1984). A resource-based view of the firm. Strategic Management Journal, 5(2), 171–180. https://doi.org/10.1002/smj.4250050207