
ABSTRACT
Effective hurricane preparedness and response demand a thorough understanding of the impact on mobility patterns. While existing studies have explored mobility disruptions caused by hurricanes, very few have delved into the impact, considering both mobility vulnerability and recovery, on a state level. Utilising mobile phone location data, this research examines the mobility patterns of Florida residents throughout Hurricane Ian. The findings reveal that the hurricane profoundly disturbed the mobility patterns of Floridians. The state experienced a maximum average daily mobility reduction of 63.41%, with certain neighbourhoods coming to a complete standstill at 100% cessation in mobility. On average, Florida neighbourhoods needed 2.61 days for mobility recovery, though this period stretched to as long as 92 days in the most severely affected areas. The bivariate map highlights a prevailing trend: neighbourhoods with prolonged recovery periods also witnessed more substantial reductions in mobility. This dual disadvantage underscores the critical need for increased focus on these neighbourhoods. Furthermore, our findings highlight the significance of factoring in forecasted hurricane paths when analysing mobility impacts, as we noted more substantial effects on neighbourhoods along the predicted trajectory.
Hurricanes frequently disturb human mobility patterns (He et al., Citation2024; Hong et al., Citation2021; Tanim et al., Citation2022). On 28 September 2022, Hurricane Ian, a Category 4 hurricane, struck Florida, significantly impacting communities along the southwest coast (). Nevertheless, there has been a lack of comprehensive investigations into the impact of Hurricane Ian on mobility patterns, particularly considering both mobility vulnerability and recovery, on a broader spatial scale.
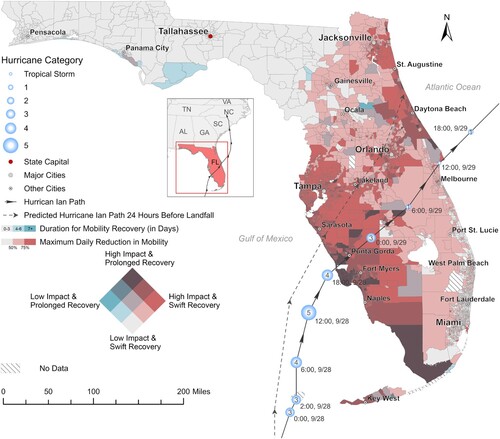
Figure 1. Bivariate map illustrating maximum daily mobility reductions and duration for mobility recovery across Florida’s census tracts throughout Hurricane Ian.
Source: Data gathered from Spectus (Cuebiq, Inc.), NOAA National Hurricane Center, United States Census Bureau
This regional graph explores the impact and recovery of mobility patterns across Florida neighbourhoods from September to December 2022. The mobility patterns are derived from mobile phone GPS trajectory data provided by Spectus, a location intelligence platform. Data are collected from anonymised users who have opted-in to provide access to their location data anonymously for research purposes, through a CCPA and GDPR-compliant framework. Each dataset entry comprises a de-identified user ID, latitude, longitude and timestamp.
The mobile phone data are aggregated at the census tract level on a daily basis to construct a series of mobility networks capturing total movement flows between tracts. A pre-hurricane baseline for mobility is established by calculating the average daily movement flows within each tract for each day of the week throughout the first three weeks of September (1 September–21 September). The hurricane stage is defined from 27 September, when the hurricane traversed the Florida Keys, until 29 September, after the hurricane exited Florida. The post-hurricane recovery stage spans from 30 September–31 December.
During and after the hurricane, daily movement flow volumes for each tract are compared to their pre-hurricane baseline volumes. The maximum percentage reduction in flows across all days during the hurricane indicates mobility vulnerability, while the time for mobility to recover to 90% of the baseline reflects the speed of mobility recovery. On average, the state experienced a maximum daily mobility reduction of 63.41% during the hurricane, with certain tracts experiencing a complete 100% cessation in mobility. Post-hurricane recovery took an average of 2.61 days, but severely affected tracts took up to 92 days to recover fully.
The figure illustrates, for each tract, the extent of the maximum daily mobility reduction and the duration of mobility recovery. Generally, tracts with extended recovery periods also witnessed more substantial reductions in mobility. For instance, the coastal neighbourhoods around Fort Myers, where the hurricane made landfall, exhibited both high impacts and a prolonged recovery period. These tracts warrant the most attention due to their dual disadvantage. As the hurricane weakened, the impact on mobility reduction gradually decreased inland. Remarkably, cities such as Tampa, Orlando and Daytona Beach experienced a more substantial decline in mobility compared to the inland areas directly on the hurricane’s path. This observation could be attributed to the early hurricane forecasts predicting a more northerly trajectory (see the dashed path in the figure), resulting in precautionary measures and a greater mobility reduction in these regions.
DISCLOSURE STATEMENT
No potential conflict of interest was reported by the author(s).
Additional information
Funding
REFERENCES
- He, Z., Hu, Y., Duan, L. L., & Michailidis, G. (2024). Returners and explorers dichotomy in the face of natural hazards. Scientific Reports, 14(1), 13184.
- Hong, B., Bonczak, B. J., Gupta, A., & Kontokosta, C. E. (2021). Measuring inequality in community resilience to natural disasters using large-scale mobility data. Nature Communications, 12(1), 1870. doi:10.1038/s41467-021-22160-w
- Tanim, S. H., Wiernik, B. M., Reader, S., & Hu, Y. (2022). Predictors of hurricane evacuation decisions: A meta-analysis. Journal of Environmental Psychology, 79, 101742. doi:10.1016/j.jenvp.2021.101742