
 ?Mathematical formulae have been encoded as MathML and are displayed in this HTML version using MathJax in order to improve their display. Uncheck the box to turn MathJax off. This feature requires Javascript. Click on a formula to zoom.
ABSTRACT
This article explores the question of the integration ability of peripheral regions into innovation-led growth. While previous research has suggested that peripheral regions may be at a disadvantage, recent studies have argued that there may be potential benefits to their integration into the innovation process. This article offers a different approach for the examination of this controversy. First, it uses knowledge-based occupations as a measure of innovation activity (instead of types of activities such as startups, high-tech activities or services). Second, it considers innovation advance under two perspectives: demand (as measured by types of occupations installed in a region) and supply (as measured by types of occupations of the resident labour force). We use regression analysis to compare trends in the last two decades in Israel.
Although findings indicate a process of adaptation of both periphery and centre to the innovation trend (in terms of increasing relative growth of high-level occupations), both in terms of supply and demand, steady gaps between the growth coefficients lead to a process of degradation of the periphery: lower increase of skills in the periphery and lower adaptation of demand to increasing skills. This results in a higher commuting rate (or migration) of skilled workers from the periphery, a substantial relative concentration of blue-collar occupations and an increasing supply of unskilled workers to the centre.
The prevention or attenuation of such a process requires the consideration of policy measures regarding the prevailing ecosystem factors.
‘The only constant in life is change’ – Heraclitus, Greek philosopher.
Innovation, one of the driving forces of economic growth, is often stimulated by the agglomeration of economic activities (Fujita et al., Citation2001; Grossman & Helpman, Citation1991), suggesting that peripheral regions are unlikely to be sites of innovation. This explains why innovation in the periphery has received less attention than the vast body of research on innovation in core or central areas. However, evidence suggests that some innovation occurs in peripheral regions despite the processes being distinct from those of their central counterparts (Davies et al., Citation2012; Doloreux, Citation2003; Eder & Trippl, Citation2019; Fritsch & Wyrwich, Citation2021; Virkkala, Citation2007). Some empirical studies on innovation in remote regions emphasise the importance of diverse knowledge sources for firms in such areas, including local links with customers, suppliers and education or research institutes (Vale & Caldeira, Citation2007). Others argue that innovation, especially in non-core areas, requires several company-related factors such as knowledge absorption capacity, growth policy, size and strategic planning (McAdam et al., Citation2014; North & Smallbone, Citation2000). This strand of the literature emphasises that innovative firms in the periphery compensate for their location disadvantages through more efficient internal organisation and superior initiatives (Eder & Trippl, Citation2019).
This empirical study identifies and analyses the process of integrating peripheral regions into innovation-driven economic growth in Israel, which has recently undergone substantial technological growth that has affected the labour market structure and employment opportunities in both its core and its peripheral regions. This study uses secondary data derived from the Israeli Central Bureau of Statistics to identify four categories of knowledge-based occupations. It then constructs and compares the regression trends for each occupation category based on employees’ place of work (labour demand) and place of residence (labour supply) to evaluate the changes and gap in demand and supply in both the core and the peripheral regions of Israel. Understanding this process can help develop policies and strategies to promote inclusive and sustainable economic growth.
1. LITERATURE REVIEW
Research on innovation in peripheral regions examines how innovation occurs in areas considered to be on the margins of the global economy. The distinction between core (or central or metropolitan) regions and peripheral (or marginal or rural) regions is important but the analysis of the various definitions is well beyond the scope of this study. We adopt the general concept of peripherality as used in our case study, evaluated by a combination of population density and distance from major urban centres.
According to the core–periphery model (Krugman, Citation1991), these peripheral regions are economically dependent on and are often exploited by more developed core regions, which limits their potential for innovation and growth. These regions may face unique challenges such as limited access to capital, technology and markets (customers and suppliers), hampering their ability to innovate and compete in the global economy (Copus et al., Citation2008; Doloreux, Citation2003).
1.1. Innovation challenges in peripheral regions
Researchers have recently examined ways to support and facilitate innovation in the periphery, drawing four main findings. First, innovation in the periphery often relies on networks and collaborations with partners in other regions, including multinational companies, universities and research institutes. Such partners provide access to new technologies, knowledge and markets as well as support local firms to build their capabilities and scale up their operations (Grillitsch & Nilsson, Citation2015). Second, local institutions and policies play a significant role in supporting innovation in the periphery. Incubators and accelerators can be established to foster new firm growth along with policies encouraging local industries to grow and adopt new technologies (Dawley, Citation2014; Doloreux, Citation2003; Isaksen & Trippl, Citation2017). Third, information and communications technology (ICT), which includes the Internet, mobile phones and cloud computing, can provide new opportunities for innovation in the periphery by opening access to global markets and customers as well as providing partners with the ability to collaborate and share knowledge globally (Bürgin & Mayer, Citation2020). Finally, a key element in fostering innovation within peripheral regions is the presence of a specialised university or research institute focusing on aspects relevant to a specific area. Peripheral regions having such institutions have a clear advantage over those that do not (Eder, Citation2019).
1.2. Measurement and impact of innovation in peripheral regions
No agreed-upon measurement of innovation, broadly described as the introduction of new ideas, products, processes, or methods, exists due to the different definitions of innovation outputs and outcomes (Jensen & Webster, Citation2009). First, typical outputs include patents, new products and processes, publications, facts, principles and previously unknown knowledge. The quantity of these outputs can serve as a measure of innovation performance based on the premise that innovation is the process of knowledge creation, usually in the research and development (R&D) departments of large companies, public labs, institutions and universities (Caraça et al., Citation2009). This is particularly so in developed countries and regions in which technological innovations are crucial for economic development. Second, innovation outcomes, which are the consequences of introducing innovations, can be measured at the firm level or more broadly (Bar-El, Citation2023; Janger et al., Citation2017). At the firm level, outcomes are accomplishments that have value for organisations, such as sales, customer feedback, market share and net profits. At the industry level, innovation outcomes can be measured by the number of new businesses formed in a region or community as a proxy of the extent to which new technologies or processes are adopted by firms in the area, indicating the level of entrepreneurial activity and potential for economic growth. At the broader level, innovation outcomes result from the diffusion of innovation from innovative firms to industries, regions and the economy as a whole, including growth, employment and social wellbeing (Rogers et al., Citation2014).
Innovation can occur throughout the production process as long as it creates new economic or social value. The Oslo Manual, first published in 1992, distinguishes between technological (product and process) and non-technological innovation (marketing and organisational) in contrast to previous innovation studies that focused on high-tech innovation indicators such as patents, thereby neglecting low-tech manufacturing industries that dominate the economic structure of peripheral regions (Eder, Citation2019). Jensen et al. (Citation2007) distinguish between two types of innovation modes. One relies on codifying scientific and technical knowledge relevant to high-tech industries in core areas, while the other is an experience-based mode of learning through doing and interacting. The latter can be found in firms located in both core and peripheral areas. Accordingly, peripheral firms can innovate incrementally, making themselves innovation followers rather than leaders; this kind of innovation might be hidden in traditional innovation surveys and indices based on R&D activities (Davies et al., Citation2012).
However, the question of the survival of peripheral regions in relation to the trend towards increased innovation cannot be answered simply by their ability to conduct innovation activities, as defined by patent applications, R&D activity and new products and services. As innovation is an instrument for achieving economic and social development, encouraging peripheral regions to be innovative should be evaluated in terms of the specific elements contributing to the development objective. Hence, in this study, we consider the type or quality of an occupation to be more relevant than the types of activities attracted to the periphery, as it better reflects the contribution to regional economic welfare. Furthermore, this study bridges the gap in the literature on how the periphery participates in the trend towards increased innovation by examining on what the objective function of regional economic activities is based. Is it based on its occupational structure, in terms of the increased proportion of high-tech activities in the region, or on social welfare, in terms of the occupations of the resident labour force (i.e., the increased proportion of high-level occupations of resident workers either employed within the region or commuting to other regions)?
2. OBJECTIVE AND APPROACH
This study responds to the unanswered issues in the literature described above. We define a clear objective and propose an approach based on the preliminary concept presented by Bar-El and Maymoni (Citation2022), which distinguishes between the reaction of the business sector (demand) and the response of the resident labour force (supply) in peripheral areas.
First, we consider the participation of the periphery in innovation by providing workers with high skill levels. For this, the measure of knowledge-based occupations and their classification into four relevant levels to innovation (as described in the methodology section) is used rather than knowledge creation activities or the production of new products and services (at the economic activity level). Conventional measures of innovation such as R&D activities and patent applications are not always valid tools, especially in remote regions (Dodgson & Hinze, Citation2000; Fritsch, Citation2002; Shearmur, Citation2017). By contrast, the concept of knowledge-based activities can provide a more accurate representation of the potential for innovation in remote regions and its role in economic growth (Felsenstein, Citation2011; Schwartz, Citation2006). Because such activities are based on the acquisition of an advanced education or professional skills, they imply higher added value. An increasing proportion of knowledge-based occupations in knowledge creation activities, industrial production, innovative products, or traditional manufacturing is expected to provide a more accurate evaluation of peripheral integration in the global innovation process.
Second, when considering the optimisation of the local economy and welfare of the local population, two key factors are important: the structure of business sector activities and structure of the labour force. The former prioritises profit-making by selecting appropriate activities and locations, whereas the latter optimises income by adapting to the skills required for innovation activities and seeking suitable employment, either locally or by commuting/migrating to other regions. The survival of peripheral regions hinges on either economic development or the welfare of the local population/labour force. The age-old question of whether jobs follow people or vice versa is a pivotal factor in this analysis.
A long-standing question is whether economic policy should optimise the conditions needed for regions to meet firms’ requirements and improve the business climate or focus on meeting people’s needs and enhancing their abilities (Florida, Citation2002; Storper & Scott, Citation2009). In other words, is regional economic development supply-biased (jobs following people) or demand-biased (people following jobs)?
The question of whether job opportunities or migration patterns should drive economic growth has long been a central concern in the regional economics literature. This question, initially posed by Muth (Citation1971), highlights the disagreement between the export-based theory of regional growth, which considers migration to be created by job opportunities (Blanco, Citation1963), and the Borts–Stein hypothesis, which views changes in employment as those created by changes in migration patterns (Borts & Stein, Citation1964).
Hoogstra et al.’s (Citation2017) meta-analysis, based on the vast literature on the relationship between job creation and population migration (Ihlanfeldt & Sjoquist, Citation1998), concluded that jobs follow people. Therefore, the entry and survival of innovative firms in the periphery can be facilitated by skilled workers whose performance is often seen as a key component of regional development (Fritsch & Storey, Citation2014; Piacentino et al., Citation2017). These firms can be attracted by the highly educated population living on the periphery, further attracting talented workers from outside the region (Meili & Shearmur, Citation2019; Tervo, Citation2016). Hoogstra et al.’s (Citation2017) conclusion that jobs follow people implies that the economic development of the region is approximately equal to the increase in knowledge-based occupations among the resident labour force. The gap between these two measures means that the resident labour force is commuting (or migrating in more extreme situations) to more suitable jobs in other regions. In this case, the national trend towards innovation will lead to the relative degradation of the economy in peripheral regions, which are typically less innovative, while the resident labour force will adapt to these trends by seeking jobs in other regions.
In the empirical analysis, a regional adjustment model, first employed by Carlino and Mills (Citation1987), has become a common method for analysing the interdependent processes of population and employment growth within dynamic adjustment processes. This model has been used to study the changes and outcomes of population and employment in regional economies, considering different employment groups, time lags and spatial frames of reference. As a starting point, this study accepts the main assertions of the literature, namely, the influence of ecosystem factors on the location of start-ups and impact of the specific advantages of the periphery. While recognising the tendency of jobs to follow people, as noted above, the prevailing local conditions are also considered. The findings contribute to the literature by introducing knowledge-based occupations as a criterion and distinguishing between the impact on the region’s economy and residents’ welfare (i.e., the balance between demand and supply). Therefore, our hypotheses are as follows:
H1: In the periphery, both demand and supply exhibit positive responses to the national trend towards increased innovations, leading to an increase in knowledge-based occupations (demand) and a greater adaptation of local workers to such occupations.
H2: The response of demand to the increased abilities of the resident labour force is weaker than the response of supply, leading to an increase in the region’s core–periphery gap and increased commuting by the resident labour force to other regions for employment (i.e., jobs follow people but at an insufficient rate).
3. METHODOLOGY
3.1. Case study: Israel
To analyse the changes in demand for and supply of the four categories of occupations in the two regions (centre and periphery) from 2000 to 2020 in Israel, we adapt the spatial approach of Carlino and Mills (Citation1987) with several modifications. First, the relationship between demand and supply is tested rather than between population and employment. Second, no time lags between changes in supply and demand are assumed, leading us to a more straightforward time-series analysis using regression methods. Although Israel is a small country, it has a robust and technologically advanced economy. One of its key strengths is its knowledge economy in which productivity and value are derived from the interaction of knowledge with itself rather than from raw materials (Cooke & Schwartz, Citation2008); thus, the key value-adding element is knowledge. Additionally, Israel has a thriving start-up culture and a high concentration of skilled workers in fields such as technology, engineering and science. Hence, it has developed a strong innovation ecosystem in various industries (Bar-El & Maymoni, Citation2022). Owing to the highly concentrated start-up culture in Tel Aviv and the central area of Israel, its central metropolis absorbs the majority of venture capital investment (Schwartz & Bar-El, Citation2007; Shefer & Antonio, Citation2013).
Israel is divided into six administrative districts (). The northern district (population: 1.5 million inhabitants) covers an area of 4473 km2 and includes five sub-districts: Tzfat, Kinneret, Yizre’el and Akko. The Haifa district (population: 1.1 million) covers 866 km2 and includes the Haifa and Hadera sub-districts. The central district (population: 2.3 million) covers 1294 km2 and includes four sub-districts: Sharon, Petah Tikva, Ramla and Rehovot. The southern district (population: 1.4 million), the largest in Israel, covers an area of 14,185 km2 and includes two sub-districts: Be’er Sheva and Ashkelon. The districts of Tel Aviv (population: 1.5 million) and Jerusalem (population: 0.8 million) cover areas of 172 km2 and 653 km2, respectively and do not include any sub-districts.
Figure 1. Map of Israel, by district.
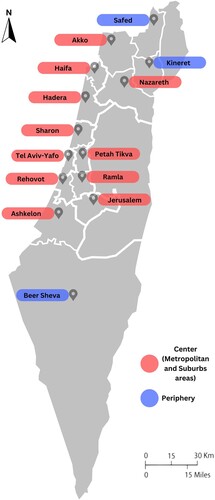
This study divides Israel into the following four areas based on the classification of its 14 sub-districts:
The metropolitan area, which includes the district of Tel-Aviv, the sub-district of Haifa (in the district of Haifa) and the district of Jerusalem, with a total population of 2.8 million.
The suburban area, which includes all the sub-districts adjacent to the metropolitan area, namely, the four sub-districts from the central region, the sub-districts of Izrael and Acco from the northern district adjacent to Haifa, the sub-district of Hadera from the district of Haifa and the sub-district of Ashkelon from the southern district. All these are located close to the metropolitan area and enjoy lower housing density. The population of the suburban area is 4.4 million inhabitants.
The northern periphery, which includes the sub-districts of Zefat and Kinneret, that lie 75–110 km (almost a 90-minute drive) from the metropolis of Haifa. The northern periphery is the smallest area by population and includes only 237,000 inhabitants.
The southern periphery, which includes the sub-district of Be’er Sheva, with the largest area lying at a distance of 110 km from the central metropolis of Tel Aviv (i.e., a two-hour drive from the city of Be’er Sheva) and up to 350 km (i.e., a four-hour drive from the town of Eilat). The southern periphery has 769,000 inhabitants.
Peripheral regions in Israel are assessed using a peripherality index (CBS, Citation2020, table 2). This index characterises an area as peripheral if it is distant from convenient amenities such as markets, employment opportunities and health services, as well as essential activities like work, school, shopping and leisure, or other common assets found in more central areas. For our analysis, the central region is defined as consisting of the sub-districts in the metropolitan and suburban areas with the lowest peripherality index, whereas the peripheral region comprises the sub-districts in the northern (Zefat and Kinneret) and southern (Be’er Sheva) peripheries, with the highest peripherality index.
3.2. Innovation indicator variable: knowledge-based occupations
In this study, the dependent variables are the supply and demand of knowledge-based occupations in Israel's peripheral and central regions, which will be expanded on in the next section. The innovation level is estimated by the classification of occupations into four levels based on their knowledge intensity and specialisation. Regional employment data is used to measure the proportion of workers in each occupation level, focusing on how these proportions and their impact on regional economic integration and growth change over time. We will begin by detailing the categorisation of the independent variable.
Although the notion that innovation drives economic growth is widely accepted (Gordon & McCann, Citation2005; Storper & Scott, Citation2009), consensus on its definition and measurement is lacking (Maradana et al., Citation2017). This is especially acute when considering regional innovation’s role in reducing the core–periphery gap. The integration of innovation, as an instrument for the optimisation of the objective function of economic growth in remote regions, requires an appropriately defined measure.
We use the International Standard Classification of Occupations (ISCO-08) of the International Labour Organization (Citation2012), which is adopted by the Israeli Central Bureau of Statistics. The International Labour Organization classifies all occupations into four primary levels based on skill (measured in terms of education) and specialisation. Specialisation is measured by the (a) field of knowledge required, (b) tools and machinery used, (c) materials worked on or with and (d) types of goods and services produced. Based on the above, we classify all occupations into 43 groups ‘based on their similarity in terms of skill levels and skill specialisation required for the jobs’ (International Labour Organization, Citation2012, pp. 3, 11–19). The categorisation is then adjusted to the specific education context in Israel (i.e., years of schooling and highest educational degree achieved) and its innovation. Four levels of knowledge-based occupations are identified: high scientific and technological knowledge-based occupations (Level 1), high social science knowledge-based occupations (Level 2), medium professional knowledge-based occupations (Level 3) and low knowledge-based occupations (Level 4).
Level 1 occupations include the following workers with an academic education (Occupations 21, 25, 31 and 35 in ISCO-08): science and engineering professionals, ICT professionals, science and engineering associate professionals, and ICT technicians (Occupations 0, 1, 2 and 10–13 in ISCO-08, used until 2011). Accordingly, we annotate Level 1 as ‘academics in scientific professions’.
Level 2 occupations also include workers with an academic education, employed as high-level executives in the fields of business, administration, law, health and teaching (Occupations 11, 12, 14, 22–24 and 26 or 3–9, 16 and 20–23 in ISCO-08). Hence, we annotate Level 2 as ‘academics in social science professions’.
Level 3 include workers with predominantly professional blue-collar education and skills, such as professional workers in manufacturing, agriculture and construction (Occupations 13, 61–63, 71–75 and 81–83 or 34, 41, 50–54 and 60–85 in ISCO-08). Consequently, we annotate Level 3 as ‘blue-collar skilled professions’.
Level 4 occupations include workers in jobs not requiring specific skills, e.g., general clerks and personal service workers and in those that require low-level skills, e.g., associate professionals in the fields of health, business, administration, law and culture (all the other occupations in ISCO-08). Thus, we annotate Level 4 as ‘unskilled occupations’.
3.3. Dependent variables: centre–periphery gap and balance between supply and demand
We distinguish between labour force supply and demand in each region. Demand is measured as the number of jobs prevailing in each region, occupied by employees residing in the region or commuting in from other regions. Supply is measured as the number of workers residing within each region, employed either within the region or commuting out to another region. This definition may be misleading because of missing data for unfilled jobs and unemployment for each of the occupations. Nevertheless, we believe that this flaw does not dramatically affect the results for two reasons. First, the total unemployment rate is relatively low, with an average of about 6% during this period. Second, although the unemployment rate is higher in the periphery, the gap with the centre remains quite constant during the period. This distinction is important because of the changes in commuting in and out throughout the study period: the share of commuting workers from the district of Beer-Sheva increased from 8.7% to 13.8%, and slightly less for northern regions (CBS, Citation2022 and previous years, table 2.45).
Based on the definition of the four types of knowledge-based occupations and the classification of the two types of regions, we measure the share of employees in each region in terms of demand (employees in regional economic activities) and supply (employees residing in the region) for each knowledge-based occupation:
(1)
(1)
(2)
(2) where
i represents the region and takes the value c for the centre and p for the periphery.
j represents the level of occupation and takes values from 1 (highest level of occupation) to 4 (lowest level).
t represents the year and takes 21 values from 2000 to 2020.
is the proportion of employees in occupation
employed in region
at time t (independently of their region of residence).
is the proportion of the resident labour force of region i employed in occupation
at time t (independent of the employment region).
We conduct regression analysis to test the significance of the trends over the 21-year period using the following trend regressions:
(3)
(3)
(4)
(4)
Where and
serve as the intercept terms,
and
indicate the trends over period t and
denotes the error term.
On the demand side, represents the proportion of workers in occupation j in the central region and
represents that proportion in the peripheral region:
(5)
(5) where
indicates the balance between the weight of occupation level j in the periphery and centre in year t (it would be defined as a location quotient (LQ) if the two regions covered the entire country). For example, a decreasing value for j = 1 over time indicates a decrease in the relative weight of high-level occupations in the periphery. This may occur even if the proportion of employees in high-level occupations in the periphery increases, but at a lower rate than the increase in the centre. We also estimate the trend using regression analysis, as described in Equations (3) and (4).
Similarly, for the supply side, we define:
(6)
(6) and also use a trend estimation.
Finally, we define the balance between supply and demand in each region for each occupation as follows:
(7)
(7) For example,
indicates the situation in which the proportion of the resident labour force employed in high-level occupations in the periphery in 2000 was higher than the proportion of high-level occupations in the periphery, leading to the commuting of high-level workers from the periphery to other regions. Similarly, we also conduct a trend analysis for this variable.
4. RESULTS
For both the periphery and the centre, shows the trend coefficients for supply (Panel A), demand (Panel B) and the balance between supply and demand (Panel C).
Table 1. Coefficients of the variables in the centre and periphery: supply, demand and the balance between supply and demand.
4.1. Supply: trends showing the adaptation of the resident labour force
As shown in Panel A of and , the analysis identifies a significant trend in the adaptation of the resident labour force in both the periphery and the centre, suggesting an increasing innovation trend during the two decades from 2000 to 2020. Of all the workers, the proportion of residents employed in high-level occupations (Levels 1 and 2) increases steadily over time (columns 1 and 2).
Figure 2. Supply: Proportion of resident labour force in each occupation in the centre and periphery (left: S_(i,j,t)) and ratio of the proportion of the periphery to the proportion of the centre (right: S_(p/c,j,t)), 2000–2020.
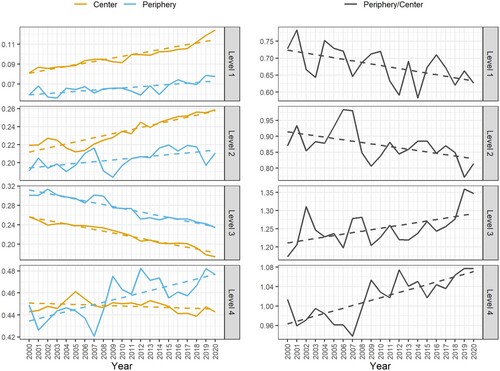
However, the proportion of the resident labour force is consistently higher in the centre and increases at a faster rate than in the periphery for both Level 1 (rising from approximately 8% in 2000 to more than 11% in the centre compared with 6% to 7% in the periphery) and Level 2 occupations. The slope of the trend is lower in the periphery for both these levels, suggesting that the residents of metropolitan areas are more affected by the new wave of innovation than those of the periphery. Thus, a notable gap exists between the two regions at the start of the millennium, which continues to widen significantly over the following 20 years, as shown in the right panel of and column 3 of Panel A in .
The results for Level 3 occupations (skilled blue-collar workers) demonstrate the inverse trend. The proportion of the resident labour force is consistently declining in both the centre and the periphery, reflecting the declining weight of manufacturing in all economic activities. However, while the proportions of Level 3 occupations are declining at approximately the same rate in both regions, the proportion of blue-collar workers in the periphery is increasing compared with that in the centre.
Finally, Level 4 occupations exhibit different trends in the periphery and centre. The centre’s proportion of Level 4 occupations remains stable over the 21-year period, while we observe a sharp and significant increase in the periphery. In the early years of the study period, the centre has a relatively large proportion of the low-knowledge labour market; however, this changes around 2008 when the periphery’s proportion of low-knowledge workers surpasses that of the centre, resulting in a significant increase in the periphery–centre gap.
In summary, on the supply side, we find an increasing but insufficient proportion of workers with higher skill levels residing in the periphery, not meeting the increased rate in the centre. Consequently, despite the decreasing rate of blue-collar employment, the balance leans towards a relatively higher concentration of blue-collar and unskilled workers in the periphery.
4.2. Demand: adaptation trends of local economic activities
Columns 4 and 5 in Panel B of and show that the regression coefficients for demand are highly significant for both the periphery and the centre. The results are similar to those in the analysis of supply but are even more emphasised.
Figure 3. Demand: Proportion of each occupation in regional economic activities in the centre and periphery (left: ) and ratio of the proportion of the periphery to the proportion of the centre (right:
), 2000–2020.
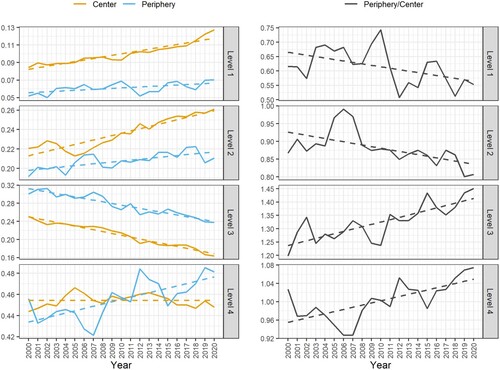
For highly knowledge-based occupations (Levels 1 and 2), we see a growing gap between central and peripheral regional economic activities, which means that the proportion of these occupations is growing at a slower rate in the periphery, indicating the inability to fully capitalise on the new opportunities generated by innovation. Blue-collar occupations (Level 3) exhibit an increasing periphery–centre gap, growing at a much higher rate than the supply gap, indicating an increasing relative concentration and specialisation of the periphery in Level 3 regional economic activities. Lastly, the lowest knowledge-based occupation (Level 4) also shows an increasing gap between regional economic activities as well as the continuous flow of low-level economic activities from the centre to the periphery.
4.3. Balance between supply and demand
The trend of the balance between supply and demand (i.e., the ratio between the proportion of labour supply to the proportion of labour demand) indicates the adaptation level of the local economic structure to changes in the skills of the resident labour force in 2000–2020. Columns 7 and 8 in Panel C in and show the trends for each knowledge-based occupation over time. A ratio above 1 (i.e., a higher increase in the skills of the region’s resident labour force than the increase in occupations in the region requiring such skills) indicates for a given occupation level that local workers’ adaptation to the innovation trend is not fully met by attracting appropriate economic activities, leading to either rising unemployment or increased commuting and the degradation of the local economy. A ratio below 1 for high-level activities suggests a trend of local growth, mostly driven by incoming commuters.
Figure 4. Ratios of the balance between supply and demand by occupation, 2000–2020.
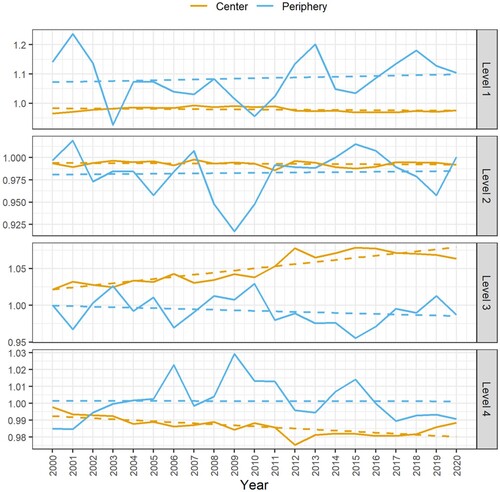
The results show the growing gap between supply and demand in the periphery for high-level occupations (Level 1), with a high (1.31) coefficient that is not statistically significant due to heavy fluctuations in peripheral data. This trend of a growing gap is supported by a significant increase in high-level skills increasing trend, accompanied by a significant but lower increase in demand in the periphery. In practical terms, during most of the study period, the proportion of the supply of the resident labour force for Level 1 occupations in peripheral regions is above that in the centre, reaching about 1.1 by the end of the period. Hence, although the resident labour force is acquiring the skills needed to be employed in high-level occupations, the increase in such occupations in the periphery is not keeping pace, leading to workers commuting to the centre.
The balance between supply and demand for Level 2 occupations shows a similar trend (the results are again not statistically significant). While there is a relatively constant slow rise in Level 2 occupations in the periphery compared with in the centre, the balance between supply and demand is stable at approximately 0.98 in the periphery, indicating some dependence on workers commuting into the region.
In the centre, the supply of Level 3 occupations surpasses demand in the study period at a significant rate. Hence, while both supply and demand are decreasing, the latter is decreasing at a higher rate. This finding suggests that the Level 3 labour force in the centre is not seeing sufficient demand for their skills; therefore, they are commuting to the periphery at an increasing rate.
Level 4 workers are mostly employed in nearby locations. This explains the steady level of the balance between supply and demand around 1. However, we do observe a statistically significant negative trend in the centre, potentially resulting in low-skilled employees commuting from the periphery.
5. DISCUSSION
Our results provide a clear picture of the response of both the periphery and the centre to the national trend of innovation-led growth in Israel. The periphery is trying to adapt to this changing situation, with the resident labour force adjusting to new professional demands (in terms of high-level occupations) and businesses discovering the advantages of innovation activities. However, the different magnitudes of these responses for the four levels of knowledge-based occupations signal the development of clear structural changes.
First, from the supply side, there is a continuous relative degradation of the balance of the labour force quality in the periphery in relation to the centre (besides an absolute improvement), leading to an increasing difficulty of the periphery to attract innovation activities from the centre. In particular, the response of workers in the periphery to improving employment opportunities offered by the innovation trend (by acquiring more advanced skills) is much weaker than that of those in the centre. This gap can be explained by two factors. One is the lower impetus in the periphery since it faces the innovation trend at lower levels than the centre. The other is a weaker ability of skills improvement in the periphery because of lower accessibility to education facilities as well as inferior technological and physical infrastructures.
Second, from the demand side, the relative degradation of the balance of the economic strength of the periphery (in terms of quality of occupations) is even stronger than that of the labour force supply. This is due to the insufficient improvement of the local labour force quality and relative scarcity of other production-related factors, including insufficient ICT infrastructure, restricted access to suppliers and consumers, and lower availability of financial and legal services despite the advantage of lower land costs in the periphery.
This phenomenon is clear and highly statistically significant for both Levels 1 and 2, but it is much less intensified for Level 2 (academic occupations in social sciences) than for Level 1 (academic occupations in technological sciences): the local population in the periphery finds it easier to improve their skills in social sciences because education in technological sciences is mostly concentrated in universities in the centre region.
The failure of the periphery to keep pace with the national trend towards increased innovation has led to a trend of skilled workers commuting to occupations in other regions. Such a pattern leads to an important evolving change in the structure of the centre – periphery balance: the transformation of the periphery into ‘dormitory locations’, while the main innovation activity is concentrated in the centre.
By contrast, in the periphery, there is an increasing relative concentration of skilled blue-collar occupations (Level 3), mostly in manufacturing. While the share of manufacturing in the economy of the periphery is consistently decreasing, the positive trend of the peripheral economy relying less on blue-collar occupations does not match that in the centre as a consequence of the heavy concentration of high-level activities. The consequence is that although the economy in the periphery is less based on blue-collar occupations, it accounts for an increased proportion of blue-collar workers in the national economy.
Unskilled occupations (Level 4) constituted almost half of all occupations in both regions at the beginning of the study period. However, while its relative proportion remained approximately constant in the centre (in terms of both supply and demand), it increased in the periphery. The outcome of the different rates of change was a significant flow of unskilled workers from the periphery to the centre.
6. CONCLUSION
Israel’s peripheral regions are making noteworthy strides towards participating in the national innovation process, not only adapting their labour force structures, but also attracting advanced innovation activities. Nonetheless, this positive response to national innovation-led growth still provides an insufficient answer to the tendency of increasing core–periphery gaps in terms of both demand and supply. As a consequence, the fundamental pattern of the peripheral economy is a slow but steady process of change.
From the labour force demand perspective, the periphery emerges with the increasing role of a focal location for blue-collar activities (mostly manufacturing), while its relative participation in innovation activities is gradually reduced, dangerously increasing the centre–periphery gap. This highly statistically significant trend over the past two decades clearly implies the inability of the periphery to sufficiently adapt to the changing national economy, which is expected to lead to a continuous and deep deterioration of its economy in future years.
From the labour force supply perspective, despite a continuous improvement in workers’ skills, the periphery has emerged as a supplier of two types of workers to the centre: high-level workers who cannot find suitable occupations in the peripheral region and unskilled workers who are filling the relative scarcity in the centre. The continuation of this trend may result in the transition of high-skilled workers from commuting to migrating from the periphery to the centre. However, the migration of unskilled workers would only be moderate due to its high cost in comparison with their low income level. This may lead to the degradation of the periphery, turning it into a region with a high concentration of low-skilled and blue-collar workers.
Deriving appropriate policy measures to address these issues is challenging. The insufficient participation of the periphery in innovation at the national level has resulted from current and past policy measures such as the provision of education through the establishment of regional colleges, support for technological incubators and laws and regulations encouraging capital investment in the periphery. Public policy is certainly an important potential contributor to the integration of the periphery into the national innovation trend, but it seems that the measures implemented until now are not yet fully adapted to the characteristics of the new development trends. A prevailing law of investment incentives in the periphery is mainly oriented towards the support of employment creation, less to innovative activities.
Possible future policy measures to be considered could include supporting universities’ links with local initiatives, opening technological education channels in local colleges (Eder, Citation2019), improving the ICT infrastructure (Bürgin & Mayer, Citation2020) and supporting joint ventures between firms from the periphery and centre (Grillitsch & Nilsson, Citation2015). Some of these measures support the supply side (e.g., educational and technological support), whereas others are more related to the demand side (e.g., infrastructural development).
Another policy perspective is that in addition to encouraging the integration of the periphery in the national trend towards increased innovation, it is important to identify innovation activities that are more appropriate to the specific conditions of peripheral regions. In other words, not only must the periphery adapt to the needs of innovation, but innovation activities must also adapt to conditions in the periphery. Innovation includes a variety of activities broadly classified as knowledge creation such as R&D activities and patent applications and the production of new or improved products and services (Bar-El, Citation2023). Given the advantages of the periphery for land-intensive activities such as manufacturing and tourism, the authorities must consider supporting innovation in traditional activities as a policy initiative. Increasing the relative proportion of manufacturing activities may provide opportunities to include advanced technological processes.
Adopting this approach could lead to the partial or complete adaptation of the periphery to the trend towards increased innovation, both in terms of economic activities (demand) and in terms of the labour force (supply). The naturally raised question is the cost/benefit issue. Government intervention should only include factors expected to contribute to economic and social gains for the nation as a whole. Extensive research is required to identify the most effective measures for achieving an optimal balance of support for peripheral innovation.
In addition, further research is required to draw more reliable and focused conclusions than those offered in this study. For example, the fact that the Israeli periphery is not that isolated from the centre is a limitation that should be considered by future researchers. Researchers could also conduct a more detailed analysis based on the distinction between the four regions (i.e., core, suburbs and northern and southern peripheries) instead of aggregating these into two. Another limitation of our study is the influence of regional characteristics. The importance of the innovation ecosystem is well known, and relevant factors that may have been overlooked in this study should be considered in future core–periphery analyses.
DATA AVAILABILITY STATEMENT
The data supporting this study's findings are available from the corresponding author upon request.
DISCLOSURE STATEMENT
No potential conflict of interest was reported by the author(s).
REFERENCES
- Bar-El, R. (2023). Reframing innovation: A case of split personality. Economic Analysis and Policy, 77, 111–122. https://doi.org/10.1016/j.eap.2022.11.002
- Bar-El, R., & Maymoni, L. (2022). Peripheral implications of national innovation: Insights from the Israeli experience. European Planning Studies. https://doi.org/10.1080/09654313.2022.2156272
- Blanco, C. (1963). The determinants of interstate population movements. Journal of Regional Science, 5(1), 77–84. https://doi.org/10.1111/j.1467-9787.1963.tb00911.x
- Borts, G. H., & Stein, J. L. (1964). Economic growth in a free market. Columbia University Press.
- Bürgin, R., & Mayer, H. (2020). Digital periphery? A community case study of digitalization efforts in Swiss mountain regions. In S. Patnaik, S. Sen, & M. S. Mahmoud (Eds.), Smart village technology (pp. 67–98). Springer.
- Caraça, J., Lundvall, BÅ, & Mendonça, S. (2009). The changing role of science in the innovation process: From queen to Cinderella? Technological Forecasting and Social Change, 76(6), 861–867. https://doi.org/10.1016/j.techfore.2008.08.003
- Carlino, G. A., & Mills, E. S. (1987). The determinants of county growth. Journal of Regional Science, 27(1), 39–54. https://doi.org/10.1111/j.1467-9787.1987.tb01143.x
- CBS. (2020). Peripherality index of localities and local authorities. Central Bureau of Statistics, Israel. https://www.cbs.gov.il/he/mediarelease/doclib/2022/420/24_22_420t2.xlsx
- CBS. (2022). Labor force survey. 2020. Central Bureau of Statistics, Israel.
- Cooke, P., & Schwartz, D. (2008). Regional knowledge economies: An EU-UK and Israel perspective. Tijdschrift voor Economische en Sociale Geografie, 99(2), 178–192. https://doi.org/10.1111/j.1467-9663.2008.00451.x
- Copus, A., Skuras, D., & Tsegenidi, K. (2008). Innovation and peripherality: An empirical comparative study of SMEs in six European Union member countries. Economic Geography, 84(1), 51–82. https://doi.org/10.1111/j.1944-8287.2008.tb00391.x
- Davies, S., Michie, R., & Vironen, H. (2012). Can peripheral regions innovate? In M. Danson, & P. de Souza (Eds.), Regional development in Northern Europe (pp. 136–151). Routledge.
- Dawley, S. (2014). Creating new paths? Offshore wind, policy activism, and peripheral region development. Economic Geography, 90(1), 91–112. https://doi.org/10.1111/ecge.12028
- Dodgson, M., & Hinze, S. (2000). Indicators used to measure the innovation process: Defects and possible remedies. Research Evaluation, 9(2), 101–114. https://doi.org/10.3152/147154400781777368
- Doloreux, D. (2003). Regional innovation systems in the periphery: The case of Beauce in Québec (Canada). International Journal of Innovation Management, 7(1), 67–94. https://doi.org/10.1142/S1363919603000738
- Eder, J. (2019). Innovation in the periphery: A critical survey and research agenda. International Regional Science Review, 42(2), 119–146. https://doi.org/10.1177/0160017618764279
- Eder, J., & Trippl, M. (2019). Innovation in the periphery: Compensation and exploitation strategies. Growth and Change, 50(4), 1511–1531. https://doi.org/10.1111/grow.12328
- Felsenstein, D. (2011). Human capital and labour mobility determinants of regional innovation. In P. Cooke, B. T. Asheim, R. Boschma, R. Martin, D. Schwartz, & F. Tödtling (Eds.), Handbook of regional innovation and growth (pp. 119–131). Edward Elgar Publishing.
- Florida, R. (2002). The rise of the creative class: And how it's transforming work, leisure, community and everyday life. Basic Books.
- Fritsch, M. (2002). Measuring the quality of regional innovation systems: A knowledge production function approach. International Regional Science Review, 25(1), 86–101. https://doi.org/10.1177/016001702762039394
- Fritsch, M., & Storey, D. J. (2014). Entrepreneurship in a regional context: Historical roots, recent developments, and future challenges. Regional Studies, 48(6), 939–954. https://doi.org/10.1080/00343404.2014.892574
- Fritsch, M., & Wyrwich, M. (2021). Does successful innovation require large urban areas? Germany as a counterexample. Economic Geography, 97(3), 284–308. https://doi.org/10.1080/00130095.2021.1920391
- Fujita, M., Krugman, P. R., & Venables, A. (2001). The spatial economy: Cities, regions, and international trade. MIT press.
- Gordon, I. R., & McCann, P. (2005). Innovation, agglomeration, and regional development. Journal of Economic Geography, 5(5), 523–543. https://doi.org/10.1093/jeg/lbh072
- Grillitsch, M., & Nilsson, M. (2015). Innovation in peripheral regions: Do collaborations compensate for a lack of local knowledge spillovers? The Annals of Regional Science, 54(1), 299–321. https://doi.org/10.1007/s00168-014-0655-8
- Grossman, G. M., & Helpman, E. (1991). Innovation and growth in the global economy. MIT Press.
- Hoogstra, G. J., Van Dijk, J., & Florax, R. J. (2017). Do jobs follow people or people follow jobs? A meta-analysis of carlino–mills studies. Spatial Economic Analysis, 12(4), 357–378. https://doi.org/10.1080/17421772.2017.1340663
- Ihlanfeldt, K. R., & Sjoquist, D. L. (1998). The spatial mismatch hypothesis: A review of recent studies and their implications for welfare reform. Housing Policy Debate, 9(4), 849–892. https://doi.org/10.1080/10511482.1998.9521321
- International Labour Organization. (2012). International standard classification of occupations, ISCO-08. International Labour Office—Department of Statistics. https://isco-ilo.netlify.app/en/.
- Isaksen, A., & Trippl, M. (2017). Exogenously led and policy-supported new path development in peripheral regions: Analytical and synthetic routes. Economic Geography, 93(5), 436–457. https://doi.org/10.1080/00130095.2016.1154443
- Janger, J., Schubert, T., Andries, P., Rammer, C., & Hoskens, M. (2017). The EU 2020 innovation indicator: A step forward in measuring innovation outputs and outcomes? Research Policy, 46(1), 30–42. https://doi.org/10.1016/j.respol.2016.10.001
- Jensen, M., Johnson, B., Lorenz, E., & Lundvall, B. A. (2007). Forms of knowledge and modes of innovation. Research Policy, 36(5), 680–693. https://doi.org/10.1016/j.respol.2007.01.006
- Jensen, P. H., & Webster, E. (2009). Another look at the relationship between innovation proxies. Australian Economic Papers, 48(3), 252–269. https://doi.org/10.1111/j.1467-8454.2009.00374.x
- Krugman, P. (1991). Increasing returns and economic geography. Journal of Political Economy, 99(3), 483–499. https://doi.org/10.1086/261763
- Maradana, R. P., Pradhan, R. P., Dash, S., Gaurav, K., Jayakumar, M., & Chatterjee, D. (2017). Does innovation promote economic growth? Evidence from European countries. Journal of Innovation and Entrepreneurship, 6(1), 1–23. https://doi.org/10.1186/s13731-016-0061-9
- McAdam, R., Reid, R., & Shevlin, M. (2014). Determinants for innovation implementation at SME and inter SME levels within peripheral regions. International Journal of Entrepreneurial Behavior & Research, 20(1), 66–90. https://doi.org/10.1108/IJEBR-02-2012-0025
- Meili, R., & Shearmur, R. (2019). Diverse diversities—open innovation in small towns and rural areas. Growth and Change, 50(2), 492–514. https://doi.org/10.1111/grow.12291
- Muth, R. F. (1971). Migration: Chicken or egg? Southern Economic Journal, 37(3), 295–306. https://doi.org/10.2307/1056181
- North, D., & Smallbone, D. (2000). The innovativeness and growth of rural SMEs during the 1990s. Regional Studies, 34(2), 145–157. https://doi.org/10.1080/00343400050006069
- Piacentino, D., Espa, G., Filipponi, D., & Giuliani, D. (2017). Firm demography and regional development: Evidence from Italy. Growth and Change, 48(3), 359–389. https://doi.org/10.1111/grow.12172
- Rogers, E. M., Singhal, A., & Quinlan, M. M. (2014). Diffusion of innovations. In D. W. Stacks, & M. B. Salwen (Eds.), An integrated approach to communication theory and research (pp. 432–448). Routledge.
- Schwartz, D. (2006). The regional location of knowledge based economy activities in Israel. Journal of Technology Transfer (JTT), 31(1), 31–44. https://doi.org/10.1007/s10961-005-5011-9
- Schwartz, D., & Bar-El, R. (2007). Venture investments in Israel—A regional perspective. European Planning Studies, 15(5), 623–644. https://doi.org/10.1080/09654310701213905
- Shearmur, R. (2017). Urban bias in innovation studies. In H. Bathelt, P. Cohendet, S. Henn, & L. Simon (Eds.), The Elgar companion to innovation and knowledge creation (pp. 440–456). Edward Elgar Publishing.
- Shefer, D., & Antonio, M. (2013). Spatial inequality between and within urban areas: The case of Israeli cities. European Planning Studies, 21(3), 373–387. https://doi.org/10.1080/09654313.2012.718198
- Storper, M., & Scott, A. J. (2009). Rethinking human capital, creativity and urban growth. Journal of Economic Geography, 9(2), 147–167. https://doi.org/10.1093/jeg/lbn052
- Tervo, H. (2016). Do people follow jobs or do jobs follow people? The case of Finland in an international context. Journal of Regional Analysis & Policy, 46(1), 95–109. https://doi.org/10.22004/ag.econ.244629
- Vale, M., & Caldeira, J. (2007). Proximity and knowledge governance in localized production systems: The footwear industry in the north region of Portugal. European Planning Studies, 15(4), 531–548. https://doi.org/10.1080/09654310601134854
- Virkkala, S. (2007). Innovation and networking in peripheral areas – a case study of emergence and change in rural manufacturing. European Planning Studies, 15(4), 511–529. https://doi.org/10.1080/09654310601133948