
 ?Mathematical formulae have been encoded as MathML and are displayed in this HTML version using MathJax in order to improve their display. Uncheck the box to turn MathJax off. This feature requires Javascript. Click on a formula to zoom.
ABSTRACT
This paper introduces a new tool, the lunar phase visualisation, and conducts a multitemporal analysis of the spatial patterns and their changes in China’s intercity mobility during the Spring Festival travel rush between 2019 and 2023. By associating the volume of intercity movement in China across various years with lunar phases, it illustrates that during both the return home (first 20 days) and back-to-city (last 20 days) periods, intercity mobility demonstrates a trend of initial decline followed by an increase. This trend aligns with the onset and subsequent mitigation of the COVID-19 pandemic, with more pronounced changes observed at the city level versus the provincial level. It also underscores the resilience of mobility during traditional holidays amid a public health crisis.
JEL:
China was the first country to face the nationwide sweep of the COVID-19 pandemic, resulting in widespread ramifications (Huang et al., Citation2021). Evidence of intercity mobility in China during the COVID-19 pandemic captures the spatiotemporal shifts in travel patterns across various outbreak stages, indicating a negative correlation between the pandemic and intercity mobility (Cui et al., Citation2022). While geographical visualisation has been instrumental in uncovering changing trends and shedding light on the resilience of China’s mobility during the pandemic, an overview of its transformations at multiple geographical scales across distinct pandemic periods remains unexplored (Abel and Sander, Citation2014).
The Spring Festival travel rush is the quintessential population movement in China. Drawing inspiration from the migration Kaleidoscope proposed by Gu and Xu (Citation2022), this article introduces a visualisation technique that incorporates lunar phase diagrams to illustrate intercity mobility patterns during the Spring Festival travel rush among 365 cities across 31 provinces in China from 2019 to 2023 (). This five-year timeframe covers the entirety of the COVID-19 pandemic, and the latest location-based services data on intercity mobility from the Gaode map support the analysis.
Figure 1. Intercity mobility patterns during the Spring Festival travel rush, 2019–2023.
Note: Shaded regions indicate reduced mobility. 2023 as the benchmark group with all other years being compared to it. Colour represents the intercity mobility volume of each city. Circle size represents total daily average intercity mobility for all cities in each year.
Source: Gaode Maps (https://report.amap.com/migrate/page.do).
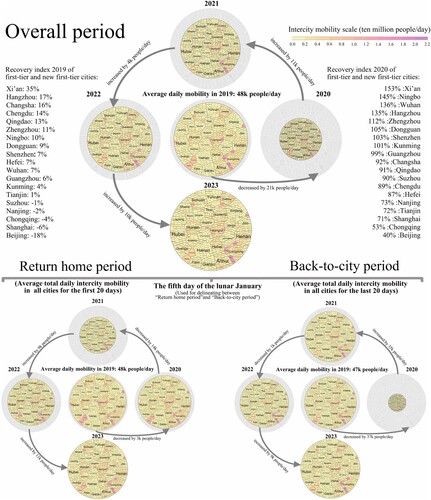
Intercity mobility during the Spring Festival travel rush displays an overall trend of initially decreasing and subsequently increasing, presenting notable resilience, especially in megacities, where most have returned to pre-pandemic levels. Yet, the two major cities, Beijing and Shanghai, reveal their challenges in the recovery process. Despite experiencing a decline in the back-to-city period in 2020, most cities swiftly recover and stabilise from 2021 onward. This phenomenon reflects an asymmetry in intercity mobility patterns between homeward and cityward movement periods. Besides, in 2020, intercity mobility during the back-to-city period was significantly lower than during the return-home period, but this had reversed by 2021. Overall, there have been minimal changes in the spatial pattern of intercity mobility among provinces versus cities. In addressing potential future public health crises, it becomes essential to balance safeguarding travel needs for significant festivals like the Spring Festival and implementing travel restrictions for epidemic control.
DISCLOSURE STATEMENT
No potential conflict of interest was reported by the author(s).
Additional information
Funding
REFERENCES
- Abel, G. J., & Sander, N. (2014). Quantifying global international migration flows. Science, 343(6178), 1520–1522. https://doi.org/10.1126/science.1248676
- Cui, L., Li, T., & Wang, J. (2022). Geovisualizing the recovery pattern of intercity mobility during the Covid-19 outbreak in China. Regional Studies, Regional Science, 9(1), 204–206. https://doi.org/10.1080/21681376.2022.2060132
- Gu, H., & Xu, Z. (2022). Kaleidoscope visualisation of China’s internal migration, 1985–2020. Environment and Planning B: Urban Analytics and City Science, 49(4), 1341–1344. https://doi.org/10.1177/23998083221082916
- Huang, B., Wang, J., Cai, J., Yao, S., Chan, P. K. S., Tam, T. H. W., & Lai, S. (2021). Integrated vaccination and physical distancing interventions to prevent future COVID-19 waves in Chinese cities. Nature human behaviour, 5(6), 695–705. https://doi.org/10.1038/s41562-021-01063-2