
Abstract
Objective
To evaluate digital rectal examination (DRE) as a predictor of prostate cancer (PC) at serum PSA level 3.0–3.9 ng/ml. We compared the PC incidence rates of men with different screening test results in this PSA range and analyzed DRE in comparison with free/total PSA ratio as an additional screening test.
Materials and methods
Using data from the FinRSPC trial, PC incidence rate ratios (IRR) for groups defined by the secondary screening test results (DRE vs. free/total PSA) were calculated for 17-year follow-up, using adjustment for age, family history of PC and place of residence. Screening test performance was evaluated by calculating sensitivity, specificity, positive and negative predictive value, and likelihood ratio.
Results
The IRR for men with a positive DRE compared to those with a negative result was 1.40 (95% confidence interval (CI) 1.00–1.96), while the IRR for men with a positive free/total PSA result compared to those with a negative one was 1.62 (95% CI 1.08–2.43). The estimated sensitivity was 0.15 (95% CI 0.11–0.20, 40/270) for DRE and 0.32 (95% CI 0.23–0.41, 36/113) for free/total PSA, and the specificity 0.91 (95% CI 0.88–0.93, 419/461) for DRE and 0.85 (95% CI 0.78–0.90, 134/158) for free/total PSA.
Conclusions
Our results do not support utility of DRE as a screening test for PC at serum PSA level 3.0–3.9 ng/ml, while the results regarding free/total PSA determination were more encouraging and reconfirm the decision to switch from DRE to free/total PSA.
Introduction
Prostate cancer (PC) is a major cause of morbidity and mortality among men especially in industrialized countries, with an estimated incidence of 1,276,000 new cancer cases and 359,000 deaths worldwide in 2018 [Citation1]. PC is also becoming more common among young adults, with an annual incidence increase of 2% on average in all age groups between ages 15 and 40 years [Citation2].
Serum prostate specific antigen (PSA) screening offers an opportunity to reduce mortality [Citation3] and has been frequent in some populations during the past decades. Despite this, routine screening is currently not recommended due to debate on whether the mortality reduction achievable with screening outweighs the risks of overdiagnosis and overtreatment [Citation4]. Results of a European randomized study showed a 20% relative risk reduction in PC mortality in the screening arm relative to the control arm [Citation5]. Modelling studies correcting for contamination and biopsy compliance also indicated a reduced PC mortality in the US Prostate, Lung, Colorectal, and Ovarian Cancer Screening Trial [Citation6]. Evidence from other studies is, however, contradictory [Citation4,Citation7–10]. DRE was used as a screening test in the Netherlands section of ERSPC during 1993–1996 among men with PSA 1.0–4.0 ng/ml [Citation5] and annually for four years in the PLCO screening trial among all men in the screening arm [Citation11].
The earliest screening tests used for PC are PSA, digital rectal examination (DRE), and transrectal ultrasound (TRUS). The proportion of free PSA and prostate specific antigen density (PSAD) can also be measured to improve the accuracy of serum PSA. Despite their increasing effect on PSA specificity, free/total PSA and PSAD are not routinely determined and have not been adequately studied as screening tests.
TRUS is not accurate enough in detecting PC and in some cases cannot differentiate cancer from benign changes. The accuracy of TRUS in the detection of PC is low (50–60%), the positive predictive value (PPV) being only 6% [Citation12].
An advantage of relying solely on blood-based tests is that any reflex tests can be run from the initial sample while undergoing DRE or TRUS requires a separate attendance with a medical professional, which complicates logistics and increases cost. However, such triage may have an opposite effect if compared with biopsy-based on PSA alone.
At a DRE, possible signs of PC include induration and nodularity. The accuracy of the procedure shows considerable inter-individual variation depending on the skills of the performer. Some studies suggest DRE does not reduce mortality [Citation13] and some even recommend against it [Citation14]. Serum PSA has been reported to be better at predicting PC than DRE, PPVs values being 32% and 21% [Citation15].
Novel serum-based models, such as 4Kscore and Prostate Health Index (PHI), have been proposed as more specific biomarkers. They are generally efficient at detecting clinically significant PC and potentially applicable in screening [Citation16,Citation17].
The most recently introduced biomarkers of PC include urinary RNA-based prostate cancer antigen 3 (PCA3) and TMPRSS2-ERG. Urine PCA3 and TMPRSS2-ERG scores have improved the performance of PSA in predicting PC [Citation18]. While 4KScore, PHI, PCA3, and TMPRSS2-ERG show promise as screening tests, they have not been sufficiently studied in randomized trials with long-term follow-up.
A combination of PSA and DRE could enhance the sensitivity and specificity of screening, and therefore promote early detection of PC, while decreasing overdiagnosis. Therefore, DRE was evaluated as a reflex test at the intermediate PSA level in this retrospective analysis of a randomized screening trial with nearly a 20-year follow-up to capture all cancers missed by the screening test.
The purpose of this study was to evaluate digital rectal examination as a predictor of PC at serum PSA level 3.0–3.9 ng/ml. The specific aims were to compare the PC incidence rates of men with different screening test results and evaluate DRE and free/total PSA ratio as additional screening tests at this PSA level.
Materials and methods
Data from the Finnish Randomized Study of Screening for Prostate Cancer (FinRSPC), the main component of the European Randomized Study for Prostate Cancer (ERSPC), were used for this study. The target population of the trial consisted of men born in 1929–1944 (aged 55, 59, 63, or 67 years at entry) living in the metropolitan areas of Helsinki and Tampere. The men were identified from the Population Registry of Finland. Men with a previous PC diagnosis were identified from the Finnish Cancer Registry and excluded.
Each year during 1996–1999, 8,000 men were randomized to screening, while the remaining ∼12,000 men in the same age groups formed the control arm. The randomization was performed at the Finnish Population Registry using computer-generated pseudorandom numbers. In total, the control arm included 48,458 men and the screening arm invited 32,000 men (corresponding to roughly 1.5:1 allocation). Men with a previous prostate cancer diagnosis were excluded. This study analyzed men in the screening arm, focusing on those with PSA 3.0–3.9 ng/ml in the first screening round.
The primary screening test was serum PSA determination followed by a diagnostic examination of all men with PSA of 4 ng/ml or higher. The diagnostic examination consisted of a systematic sextant biopsy of the prostate.
Men with PSA of 3.0–3.9 ng/ml were offered a DRE examination by a urologist during 1996–1998. The examination was performed by doctors working in the urology department who had experience in the procedure, including residents and attending specialists. A suspicious DRE finding then led to a diagnostic examination, including a targeted biopsy.
In 1999, DRE was replaced by the determination of free/total PSA ratio as the supplementary test. The cut-off value was set at 0.16, meaning men with free/total serum PSA ratio <0.16 were considered screen-positive. In the beginning of the FinRSPC, men with PSA of 2.0–2.9 ng/ml were also offered a DRE. This was discontinued in June 1996 to avoid loss in specificity, after examinations of 109 men.
The men were invited to the second and third screening rounds four and eight years after the first screen. Men aged 67 years at entry were only screened twice since men older than 71 were no longer invited to screening.
Prostate cancer cases were identified from the Finnish Cancer Registry, and clinical information was abstracted from medical records. In the present study, data from the FinRSPC included date of randomization, age at randomization, family history of prostate cancer, place of residence, date of attendance, test results of the three screening rounds, and tumor characteristics.
Prostate cancers were categorized as low-risk, moderate-risk, and high-risk using the EAU risk group classification based on PSA at diagnosis, Gleason score, and TNM stage [Citation19]. Advanced prostate cancers were combined with high-risk cancers. Gleason scores were retrospectively re-graded by two experienced uropathologists using the ISUP 2005 criteria.
The follow-up began on the date of the first screening and ended at death, emigration from Finland, or the common closing date (31 December 2016), whichever was first. The median length of follow-up was 17.3 years and that for those at follow-up at the common closing date 18.9 years.
The PCs were categorized into the following groups based on the time of diagnosis: (1) the cancers detected during the 1st screening round, (2) the cancers detected in later screening rounds, and (3) the cancers detected after the screening period (three rounds and eight years, except two rounds and four years for the oldest age group). Cancers detected between the screening rounds or after a missed screening round were included in the second group.
Negative binomial regression was used to calculate PC incidence rate ratios (IRR) for groups defined by PSA at initial screening and secondary test results. In the multivariate analysis, adjustment for age, family history of PC, and place of residence was used. The combined use of DRE and PSA as a screening test was evaluated by calculating its sensitivity, specificity, positive predictive value (PPV), negative predictive value (NPV), and likelihood ratio. Statistical analysis was performed using statistical software Stata 16 (Stata Corp, College Station, TX, USA).
PPV was defined as the number of screen-positives diagnosed with PC at any phase of the study, divided by the number of all screen positives. NPV was defined as the number of screen-negatives who remained free of PC during the follow-up, divided by the number of all screen-negatives.
Test sensitivity was defined as the number of screen-positives diagnosed with PC at any phase of the study, divided by the number of all PC cases among the screened men. Test specificity was defined as the number of screen-negatives never diagnosed during the follow-up, divided by the number of all the screened men who were never diagnosed.
The positive likelihood ratio was defined as the probability of a man with PC being screen-positive, divided by the probability of a man without PC being screen-positive. The negative likelihood ratio was defined as the probability of a man with PC being screen-negative, divided by the probability of a man without PC being screen-negative.
Written informed consent was obtained from all men participating in screening. The study protocol was reviewed by the research ethics committee of the Pirkanmaa University Hospital (tracking no. 95077/1995, 2009, 2011).
Results
In the first round of the Finnish Randomized Study of Screening for Prostate Cancer, the annual number of men invited and screened remained similar during the four years (). The smaller number of invitees in 1996 was the result of 247 men not receiving their invitation due to a logistic problem. Of the 30,201 men invited, 81 were excluded from the analysis due to emigration from the study area before the first screening round. Of the remaining 30,120 men, 22,533 (74.8%) were from Helsinki and 7,587 (25.2%) from Tampere, while participation was higher in Tampere (76.4%) than in Helsinki (66.3%). Participation varied with age from 65.1% at 55 years to 79.2% at 59 years ().
Table 1. Number and proportion of men invited and participating at the first screening round by year of invitation, age, and family history of prostate cancer in the FinRSPC trial.
In the first screening round, 15,698 men had PSA < 2.0 ng/ml and 1,222 PSA ≥ 5.0 ng/ml. In the detailed analysis, we included 1,067 men with PSA of 3.0–3.9 ng/ml. During 1996 − 1998, they were offered a supplementary digital rectal examination. Of the DRE findings, 649 were normal and 82 were suspicious for cancer. In 1999, free/total PSA ratio was introduced as the supplementary test and 211 of the men were screen-negative (free/total PSA ≥ 0.16), and 60 were screen-positive (free/total PSA < 0.16). ()
Table 2. Number and proportion of men at the first screening round by prostate specific antigen (PSA) level, ancillary test result including the digital rectal examination (DRE)* finding and free/total PSA ratios# and number of prostate cancers (PC) by the time of detection in the FinRSPC trial.
A total of 1,225 men with PSA of 2.0–4.9 ng/ml (32%) at the initial screen were diagnosed with PC. The men with PSA 2.0–2.9 ng/ml were less likely to be diagnosed than the men with PSA 3.0–3.9 ng/ml or 4.0–4.9 ng/ml (detection rate 27% vs. 37% and 41%). ()
Of the 82 men with suspicious DRE findings 40 (49%) were diagnosed with PC, while 36 (60%) cases were detected out of the 60 men with free/total PSA < 0.16 (). Therefore, cancer detection based on free/total PSA was more frequent compared with DRE as the supplementary test at serum PSA level 3.0–3.9 ng/ml.
However, a suspicious DRE finding was more likely to lead to detection of high risk/advanced cancer than a suspicious free/total PSA value (12% vs. 5% of the findings leading to detection of a high risk/advanced cancer). The proportion of men with low-risk cancers was higher among men with free/total PSA ratio < 0.16 than among those with a suspicious DRE (35% vs. 23%). ()
Table 3. The number and proportion of prostate cancers (PC) by EAU risk classification and ancillary test result including the digital rectal examination (DRE) finding and free/total (F/T) PSA ratio.
The PPV was estimated at 0.49 (95% CI 0.38–0.60, 40/82) for DRE and 0.60 (36/60, 95% CI 0.47–0.72) for free/total PSA ratio. The NPV was 0.65 (95% CI 0.61–0.68, 419/649) for DRE and 0.64 (95% CI 0.57–0.70, 134/211) for free/total PSA.
The test sensitivity was 0.15 (95% CI 0.11–0.20, 40/270) for DRE and 0.32 (95% CI 0.23–0.41, 36/113) for free/total PSA. The test specificity was estimated at 0.91 (95% CI 0.88–0.93, 419/461) for DRE and 0.85 (95% CI 0.78–0.90, 134/158) for free/total PSA.
The positive likelihood ratio was 1.63 (95% CI 1.08–2.44) for DRE and 2.10 (95% CI 1.33–3.31) for free/total PSA, while the negative likelihood ratio was 0.94 (95% CI 0.88–0.99) for DRE and 0.80 (95% CI 0.80–0.93) for free/total PSA.
The age-adjusted prostate cancer IRR for men with a positive DRE result compared to those with a negative DRE result was 1.40 (95% CI 1.00–1.96) when all PCs detected at any phase of the follow-up were included in the analysis (). The IRR for men with a positive free/total PSA result compared to those with a negative one was 1.62 (95% CI 1.08–2.43), all PCs included.
Figure 1. Prostate cancer (PC) incidence rate ratios (IRR) for different first-round screening results adjusted for age, family history of PC and place of residence in PSA range 3.0–3.9 ng/ml. The first-round prostate cancer IRRs were excluded from the table due to the strong correlation between diagnosis and the test leading to the diagnosis. (A) Later round PC, (B) post-screening PC, (C) PC during any round including the first and (D) all PCs. DRE: digital rectal examination; F/T: free/total.
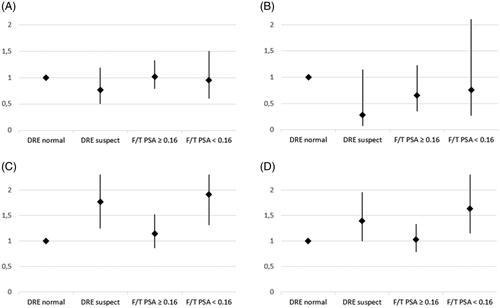
The corresponding IRRs regarding only the cancers detected during the screenings were 1.77 (95% CI 1.25–2.52) for DRE () and 1.67 (95% CI 1.08–2.58) for free/total PSA. When including only the cancers detected after the screenings, the IRRs were 0.28 (95% CI 0.07–1.15) for DRE () and 1.27 (95% CI 0.40–4.01) for free/total PSA.
The prostate cancer IRR for men with a negative free/total PSA result compared to a negative DRE result was 1.03 (95% CI 0.79–1.33) regarding all PC cases, 0.66 (95% CI 0.35–1.23) regarding only the cancers detected after screenings and 1.15 (95% CI 0.86–1.53) regarding only the screen-detected cancers (). When comparing men with negative secondary screening results to men who did not attend the secondary test, the IRRs were 1.34 (95% CI 0.80–2.24) for free/total PSA and 1.31 (95% CI 0.81–2.12) for DRE, including all cancers cases.
The PC incidence rates were higher among those with higher baseline PSA levels when considering all cancers. The IRRs for men with PSA of 3.0–3.9 ng/ml and 4.0–4.9 ng/ml compared to men with PSA of 2.0–2.9 ng/ml were 1.40 (95% CI 1.23–1.59) and 1.54 (95% CI 1.33–1.79), respectively. When considering only the cancers detected after screenings, the corresponding IRRs were 0.94 (95% CI 0.72–1.23) and 0.67 (95% CI 0.45–0.99). The first-round prostate cancer IRRs for PSA were notably high due to the strong correlation between a diagnosis and the screening test leading to the diagnosis.
Discussion
Our findings demonstrate that a suspicious DRE finding at initial screening predicts PC detection at serum PSA level 3.0–3.9 ng/ml. In our detailed analysis of a randomized screening trial, the risk for PC was 1.40-fold overall during a follow-up of 17 years compared to a normal DRE. Free/total PSA ratio was a slightly better predictor, with a 1.6-fold. However, DRE predicted a larger proportion of high-risk cancers than free/total PSA, suggesting less over-diagnosis and hence overtreatment, which could indicate a role for DRE.
The risk for PC was similar (IRR 1.03) for a negative free/total PSA result as a negative DRE result and correspondingly, similar test specificity was found for DRE and free/total PSA (0.91 vs. 0.85). The test sensitivity, however, was lower for DRE (0.15 compared with 0.32 for free/total PSA). Thus, our results support free/total PSA for screening test rather than DRE.
Earlier studies have found DRE to significantly improve PC detection when combined with other parameters such as PSA [Citation15,Citation20]. DRE is already used as a part of well-established PC risk calculators such as PCPT and SWOP [Citation21]. A large American cohort reported DRE to be prognostically most useful when PSA is >3 ng/ml [Citation22]. This was supported by our finding that DRE improves the accuracy of serum PSA at PSA range of 3.0–3.9 ng/ml. Rotterdam section of the ESPRC found the PPV and sensitivity of DRE to depend strongly on PSA level and therefore considered DRE a poor predictor of PC in low PSA ranges [Citation23]. A study based on the ERSPC Rotterdam compared the number and characteristics of PCs between men with and without suspicious DRE results at the initial screen and found no significant differences, suggesting that DRE does not predict PC to a useful extent [Citation24]. The design and setting of this study were similar to those of ours, except for a shorter follow-up of only eight years. Our results did, however, demonstrate that DRE can be a statistically significant predictor of PC. One study of over 2,000 men found PSA to outperform DRE as biopsy indication but mentioned DRE to detect more selectively high-grade cancers [Citation25], which was in accordance with our results.
Earlier studies have recognized free/total PSA ratio to be lower among men with PC [Citation26,Citation27]. This was discovered in the 1990s when it became apparent that the proportion of the PSA-alpha 1-antichymotrypsin complex was higher in patients with PC than in those with benign hyperplasia [Citation28]. Using free/total PSA ratio improved the efficiency of PSA by eliminating half of the false-positive results without loss of sensitivity in a Finnish study [Citation29]. This was supported by another study which found that using a positive free/total PSA result as a biopsy criterion 30% of the negative biopsies could be eliminated, while still detecting 98% of the cancers [Citation27]. The study used a 0.22 cutoff point for free/total PSA, which was slightly higher than that of ours (0.16). Despite this, our results were similar and regarded free/total PSA ratio as a statistically significant predictor of PC.
The impact of DRE on PC mortality is questionable and therefore screening using DRE is not recommended. Data of two case-control studies suggest that DRE does not reduce PC mortality notably [Citation9,Citation13]. Contrary to this, other case-control studies found a strong inverse correlation between DRE and PC mortality [Citation8,Citation30]. The retrospective design of the case-control studies makes, however, them prone to recall error and selection bias. A meta-analysis of seven studies with 9,241 patients recommends against the routine performance of DRE in screening for PC, having estimated a pooled PPV of 0.41 and a pooled NPV 0.64 [Citation14]. Our results were similar, including a PPV of 0.49 and a NPV of 0.65.
Strengths of the current study are its long follow-up time, comprehensive data, relatively large sample size and its study design, within a randomized controlled trial. The prospective design of the FinRSPC minimized recall error making data on the screening rounds and PCs reliable since only the information on the family history of PC was obtained by interviewing the men. Selection bias was minimal due to the population-based design of the study. The relatively large sample size reduced random error and allowed robust, precise estimates. Adjustment for age and family history of PC limited confounding since they are known risk factors of prostate cancer [Citation31]. Contamination bias was minimal since each group was equally contaminated by screening outside the study.
This study has also its limitations, which should be considered when interpreting the results. Some of the analyses were performed with small sample size since only 731 men with PSA 3.0–3.9 ng/ml underwent a DRE. This can be seen in the wide confidence intervals of the results. Owing to the sample size, analyses could not be performed on subgroups by age or family history of PC. The limitations also include the narrow range of PSA (3.0–3.9 ng/ml) that contributed to the small sample size, although the narrow range has its virtues as well, since it makes estimates for PC risks comparable. Further, we did not have free/total PSA for and DRE for the same men in this analysis for side-by-side comparison. It is also of concern that in this study, DRE was not evaluated with current screening tests and principles of diagnostics of PC.
In our study, DRE was performed by urologists and residents with experience in DRE. This likely improved the performance and enhanced the quality of the assessment. However, this also means that the results are not directly applicable to a situation where the examinations are performed by family physicians.
Given the findings of our analysis, we do not support using DRE as a screening test for PC at serum PSA level 3.0–3.9 ng/ml, while the results regarding free/total PSA determination as the screening test were more encouraging and reconfirm the decision to switch from DRE to free/total PSA. While the balance of benefits and harms with screening based only on serum PSA are questionable, further research on screening utilizing modern approaches such as urine PCA3 and TMPRSS2-ERG, or novel serum-based models such as K4Score and PHI is warranted.
Disclosure statement
No potential conflict of interest was reported by the author(s).
Additional information
Funding
References
- Culp MB, Soerjomataram I, Efstathiou JA, et al. Recent global patterns in prostate cancer incidence and mortality rates. Eur Urol. 2020;77(1):38–52.
- Bleyer A, Spreafico F, Barr R. Prostate cancer in young men: an emerging young adult and older adolescent challenge. Cancer. 2020;126(1):46–57.
- Bergstralh EJ, Roberts RO, Farmer SA, et al. Population-based case-control study of PSA and DRE screening on prostate cancer mortality. Urology. 2007;70(5):936–941.
- Ilic D, Djulbegovic M, Jung JH, et al. Prostate cancer screening with prostate-specific antigen (PSA) test: a systematic review and meta-analysis. BMJ. 2018;362:k3519.
- Hugosson J, Roobol MJ, Månsson M, et al. A 16-yr follow-up of the European randomized study of screening for prostate cancer. Eur Urol. 2019;76(1):43–51.
- Tsodikov A, Gulati R, Heijnsdijk EAM, et al. Reconciling the effects of screening on prostate cancer mortality in the ERSPC and PLCO trials. Ann Intern Med. 2017;3167(7):449–455.
- Fenton JJ, Weyrich MS, Durbin S, et al. Prostate-specific antigen-based screening for prostate cancer: evidence report and systematic review for the US preventive services task force. JAMA. 2018;319(18):1914–1931.
- Weinmann S, Richert-Boe K, Glass AG, et al. Prostate cancer screening and mortality: a case-control study (United States). Cancer Causes Control. 2004;15(2):133–138.
- Concato J, Wells CK, Horwitz RI, et al. The effectiveness of screening for prostate cancer: a nested case-control study. Arch Intern Med. 2006;166(1):38–43.
- Agalliu I, Weiss NS, Lin DW, et al. Prostate cancer mortality in relation to screening by prostate-specific antigen testing and digital rectal examination: a population-based study in middle-aged men. Cancer Causes Control. 2007;18(9):931–937.
- Andriole GL, Crawford ED, Grubb RL, 3rd, PLCO Project Team, et al. Prostate cancer screening in the randomized prostate, lung, colorectal, and ovarian cancer screening trial: mortality results after 13 years of follow-up. J Natl Cancer Inst. 2012;104(2):125–132.
- Harvey CJ, Pilcher J, Richenberg J, et al. Applications of transrectal ultrasound in prostate cancer. Br J Radiol. 2012;85(1):S3–S17.
- Richert-Boe KE, Humphrey LL, Glass AG, et al. Screening digital rectal examination and prostate cancer mortality: a case-control study. J Med Screen. 1998;5(2):99–103.
- Naji L, Randhawa H, Sohani Z, et al. Digital rectal examination for prostate cancer screening in primary care: a systematic review and meta-analysis. Ann Fam Med. 2018;16(2):149–154.
- Catalona WJ, Richie JP, Ahmann FR, et al. Comparison of digital rectal examination and serum prostate specific antigen in the early detection of prostate cancer: results of a multicenter clinical trial of 6,630 men. J Urol. 2017;197(2S):S200–S207.
- Tan GH, Nason G, Ajib K, et al. Smarter screening for prostate cancer. World J Urol. 2019;37(6):991–999.
- Chiu PK, Ng CF, Semjonow A, et al. A multicentre evaluation of the role of the prostate health index (PHI) in regions with differing prevalence of prostate cancer: adjustment of PHI reference ranges is needed for European and Asian settings. Eur Urol. 2019;75(4):558–561.
- Tomlins SA, Day JR, Lonigro RJ, et al. Urine TMPRSS2:ERG plus PCA3 for individualized prostate cancer risk assessment. Eur Urol. 2016;70(1):45–53.
- Mottet N, Bellmunt J, Briers E, et al. EAU – ESTRO – ESUR – SIOG guidelines on prostate cancer. Edn. presented at the EAU annual congress Milan. Arnhem: EAU Guidelines Office; 2021.
- Issa MM, Zasada W, Ward K, et al. The value of digital rectal examination as a predictor of prostate cancer diagnosis among United States veterans referred for prostate biopsy. Cancer Detect Prev. 2006;30(3):269–275.
- Poyet C, Nieboer D, Bhindi B, et al. Prostate cancer risk prediction using the novel versions of the European randomised study for screening of prostate cancer (ERSPC) and prostate cancer prevention trial (PCPT) risk calculators: independent validation and comparison in a contemporary European cohort. BJU Int. 2016;117(3):401–408.
- Halpern JA, Oromendia C, Shoag JE, et al. Use of digital rectal examination as an adjunct to prostate specific antigen in the detection of clinically significant prostate cancer. J Urol. 2018;199(4):947–953.
- Schröder FH, van der Maas P, Beemsterboer P, et al. Evaluation of the digital rectal examination as a screening test for prostate cancer. Rotterdam section of the European randomized study of screening for prostate cancer. J Natl Cancer Inst. 1998;90(23):1817–1823.
- Gosselaar C, Roobol MJ, van den Bergh RC, et al. Digital rectal examination and the diagnosis of prostate cancer-a study based on 8 years and three screenings within the European Randomized Study of Screening for Prostate Cancer (ERSPC), Rotterdam. Eur Urol. 2009;55(1):139–146.
- Gosselaar C, Roobol MJ, Roemeling S, et al. Screening for prostate cancer at low PSA range: the impact of digital rectal examination on tumor incidence and tumor characteristics. Prostate. 2007;67(2):154–161.
- Christensson A, Björk T, Nilsson O, et al. Serum prostate specific antigen complexed to alpha 1-antichymotrypsin as an indicator of prostate cancer. J Urol. 1993;150(1):100–105.
- Reissigl A, Klocker H, Pointner J, et al. Usefulness of the ratio free/total prostate-specific antigen in addition to total PSA levels in prostate cancer screening. Urology. 1996;48(6):62–66.
- Stenman UH, Leinonen J, Alfthan H, et al. A complex between prostate-specific antigen and alpha 1-antichymotrypsin is the major form of prostate-specific antigen in serum of patients with prostatic cancer: assay of the complex improves clinical sensitivity for cancer. Cancer Res. 1991;51(1):222–226.
- Stenman UH, Hakama M, Knekt P, et al. Serum concentrations of prostate specific antigen and its complex with alpha 1-antichymotrypsin before diagnosis of prostate cancer. Lancet. 1994;344(8937):1594–1598.
- Jacobsen SJ, Bergstralh EJ, Katusic SK, et al. Screening digital rectal examination and prostate cancer mortality: a population-based case-control study. Urology. 1998;52(2):173–179.
- Patel AR, Klein EA. Risk factors for prostate cancer. Nat Clin Pract Urol. 2009;6(2):87–95.